Using Filters to Forecast Metrics
OpenNMS includes several pre-defined filters that HELM can use to display forecast metrics in a panel. Adding a forecast filter can help you anticipate when you might need to make changes to your network depending, for example, on anticipated bandwidth usage, disk space capacity, network traffic, and so on.
This procedure describes how to create forecast metrics on network usage, using the ifHCOutOctets attribute (the number of octets sent by the interface).
Create a Network Usage Panel
-
In your dashboard, click the
Add panelicon. -
Click Add Query.
-
In the Query drop-down, select the datasource.
-
You need to select a performance datasource.
-
-
In the Type drop-down, choose Attribute.
-
Specify the node you want to monitor.
-
Specify the resource ID.
-
In the Attribute field label, click the tag icon to display the list of available attributes and select
ifHCOutOctets.
To display this information in bits, create an expression:
-
Click Add Query.
-
In the Type drop-down, choose Expression.
-
In the Expression field, add the following:
ifHCOutOctets * 8. -
Add a label, for example,
Out. -
Hide the
ifHCOutOctetsattribute you configured by clicking the disable/enable (eye) icon beside it.
Create a Forecast Filter
-
Click Add Query.
-
In the Type drop-down, choose Filter.
-
Click the Filter type label, select
HoltWintersfrom the pop-up dialog, and click Select.-
Note that the far right column displays requirements on the node being queried, e.g., R, Java.
-
-
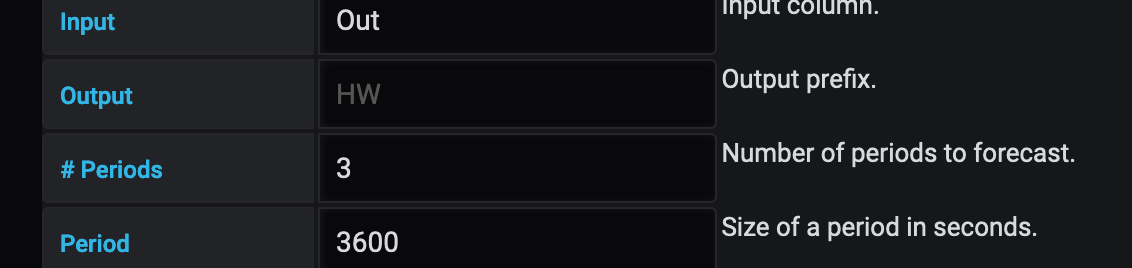
For the Input column, specify the name of the attribute or expresssion you wish to forecast, in this case,
Out. -
Specify an output, or accept the default (
HW).-
The output is the prefix for the lower and upper fit (how successfully the forecast method fits to your data).
-
-
Specify the number of periods to forecast, the size of the period in seconds, and the desired probability in the appropriate fields.
-
Note that the number of periods to forecast, the size of the period, and the time range are interdependent. For example, the following specifies a three-hour forecast:
-
Your time range must include at least more than twice the period size to get the historical data required for the forecast. For example, to forecast a period of one hour (3600 seconds), you need to specify a time range greater than two hours.
-
Consider the seasonality of the data (i.e., you may not want weekend network usage to be included in a forecast of usage during regular business hours) when specifying a time range.
-
-
If you have noisy or spiky data, forecasting does not work as well. You should also add the Chomp and Outlier filters, and move them so that they appear before the HoltWinters filter in the list of queries. You must specify an input for the Outlier filter.
-
Save the dashboard.
Displaying Forecast Data
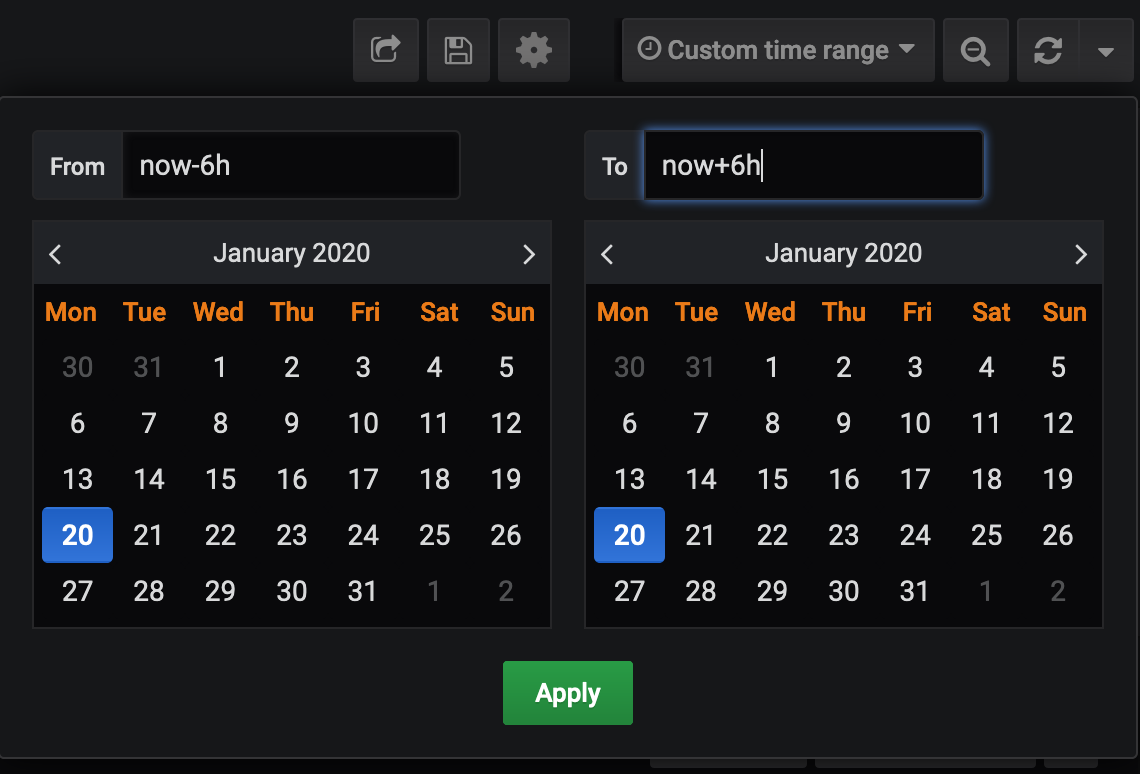
Since the default time range for a panel returns data from the past to the present, you need to create a custom time range to display forecast data beyond the current time.
-
In the upper-right of the dashboard, select Custom time range from the time range drop-down.
-
Specify the start of your data range in the From field (for example,
now-6h). -
For the end time, specify a time in the future, as in the following:
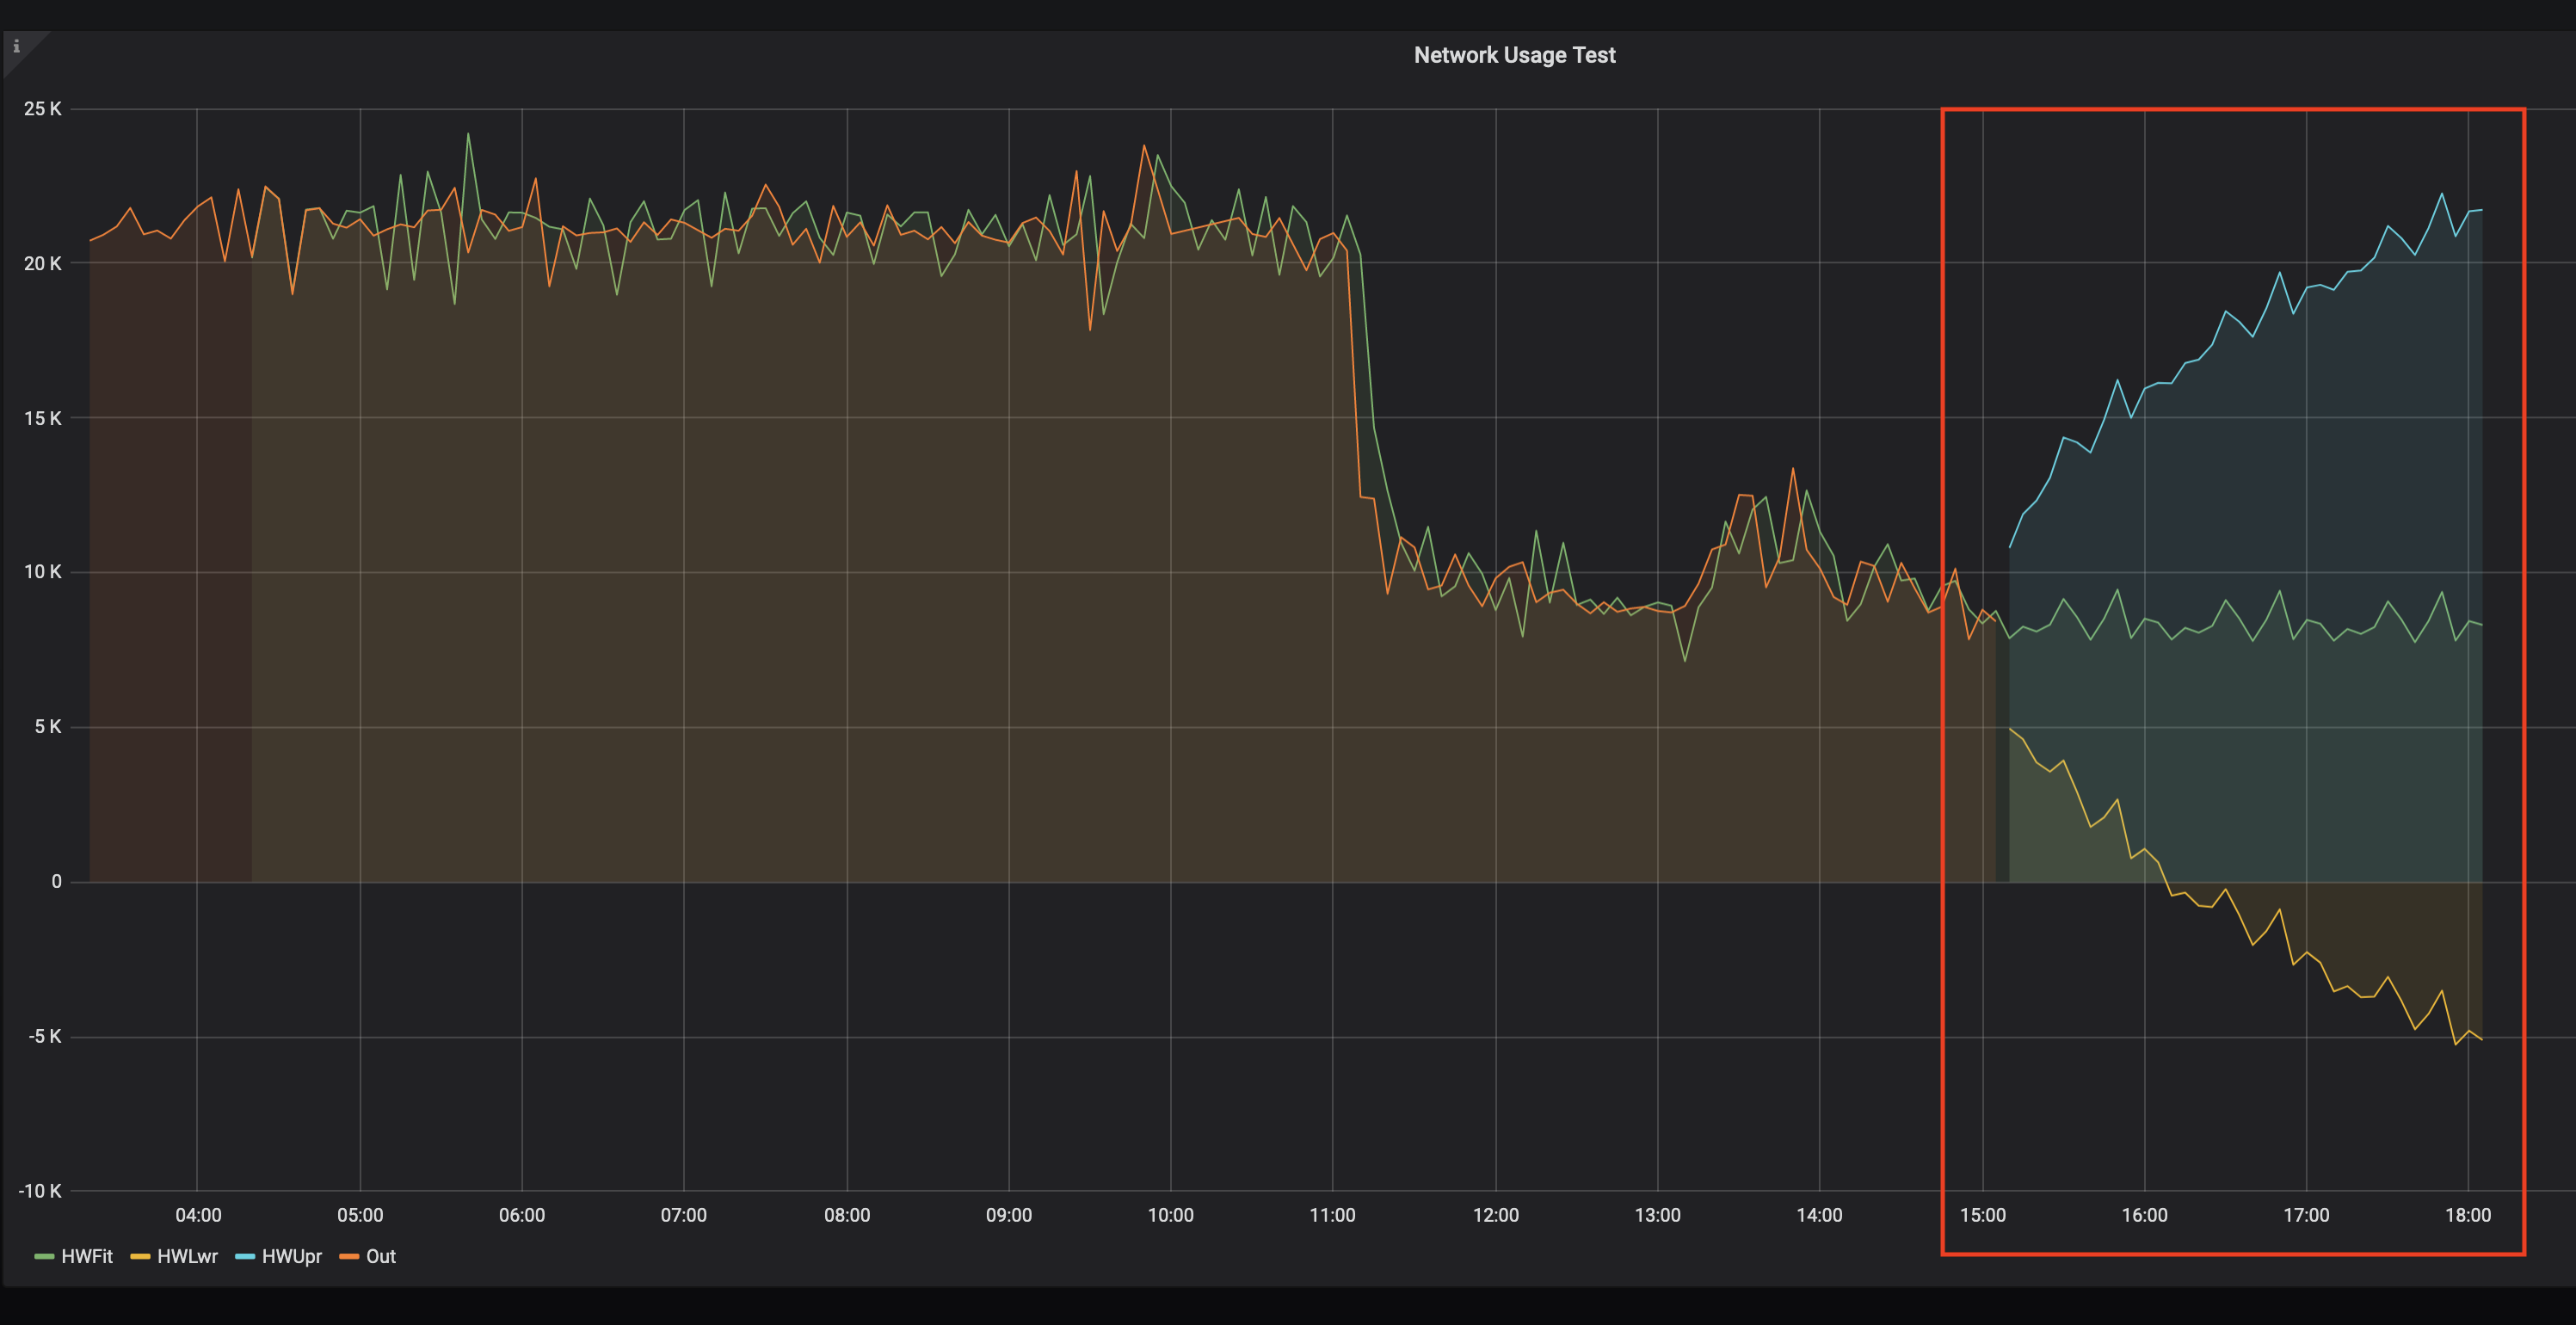
The panel displays the forecast you specified:
-
Experiment with changing the time range and forecast results. The further into the future you forecast, the less authoritative the forecast will be.
Pre-defined Filters
The following table describes the pre-defined filters from OpenNMS that Helm provides for forecast metrics:
| Filter | Description | Use |
|---|---|---|
Chomp |
Strips leading and trailing rows that contain nothing but NaNs/null values. |
This filter is useful when the values from the data source do not cover the entire time interval the report uses. |
HoltWinters |
Performs Holt-Winters forecasting, a way to model and predict the behavior of a sequence of values over time. |
Creates forecasts of your data based on the parameters you specify. |
Outlier |
Removes data points that differ significantly from other data and replaces them with interpolated values. |
Helps to smooth the data to improve forecasting results. |
Trend |
Fits a trend line or polynomial to a given column. |
Displays upwards or downwards changes in the forecast data. |
JEXL |
Generic JEXL expression filter |
Filters on mathematical and conditional operators provided by JEXL. For example, you could specify a filter to display the SUM of certain data. |
Percentile |
Calculates percentiles. |
Displays the percentage of data under the specified percentile. |
Derivative |
Calculates the derivative (rate of change) between rows. |
Displays the rate of change during the forecast period. |