Importing a Dashboard
There are a number of official- and community-built OpenNMS dashboards available for import, that display the following:
-
SNMP data collected by Linux hosts
-
Business service availability
-
Cassandra performance
-
Generic UPS statitstics
-
Network interfaces
-
And more …
You can edit these pre-designed dashboards to meet your needs or to learn more about how to build your own dashboards.
To import an existing dashboard, follow these steps:
-
Go to the Grafana dashboards page and search for OpenNMS.
-
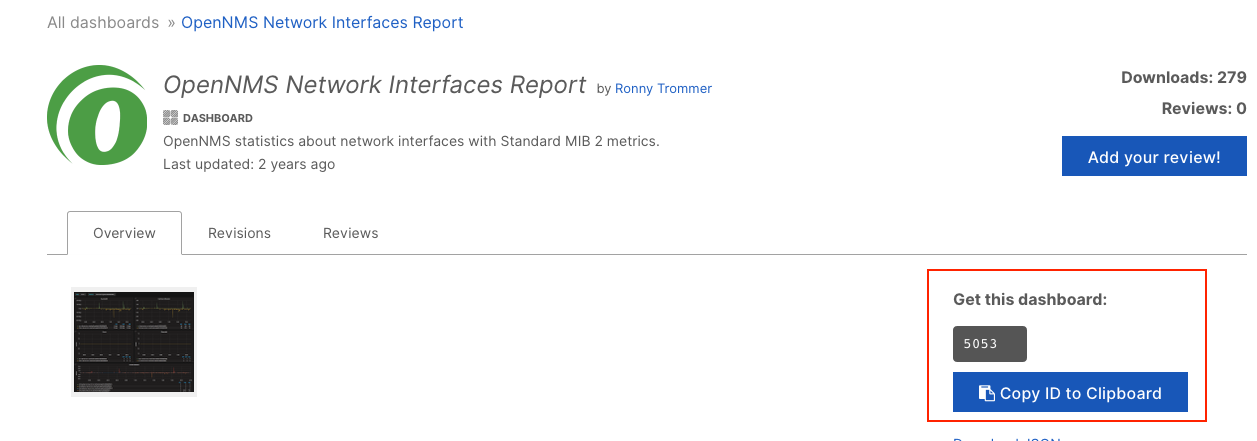
Click on the dashboard you want to import.
-
Copy the dashboard ID:
-
In HELM, click on the plus sign in the left menu and choose Import.
-
In the Grafana.com Dashboard field, enter the dashboard ID and click Load.
-
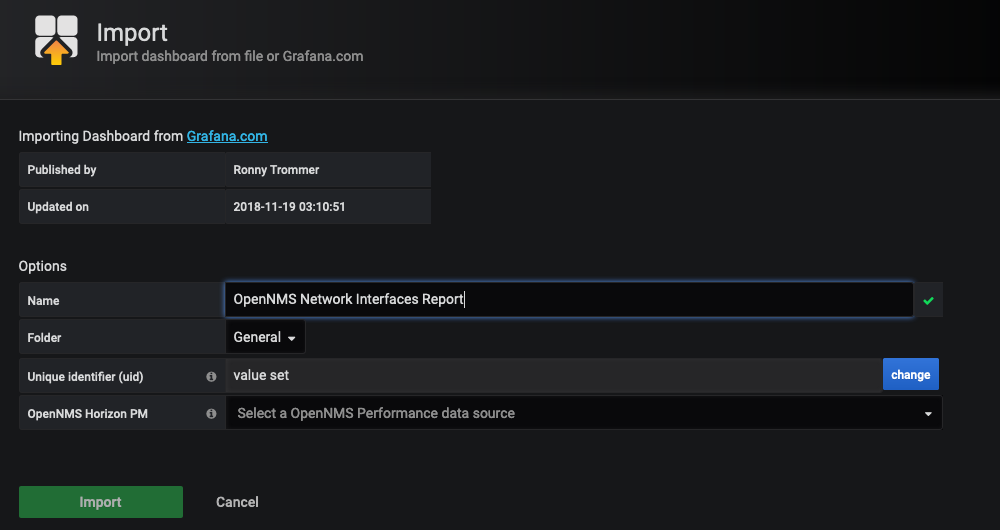
The Import screen appears:
-
-
Change information as desired and click Import.
-
Go to Dashboards>Manage to view/edit the imported dashboard.