Basic Walk-Through
Overview
This guide demonstrates how to create a simple dashboard with HELM by doing the following:
The tutorial assumes that you have:
-
an instance of Grafana with the HELM application installed
-
an instance of OpenNMS that is reachable from the Grafana instance above
-
one or mode nodes being monitored by OpenNMS
|
If you are already using the OpenNMS Data Source plugin with Grafana, see Migrating from the OpenNMS Data Source plugin to migrate to using HELM to interface with OpenNMS. |
Application Setup
In this section, you will enable the HELM application in Grafana and create Custom Actions.
-
Navigate to the home page of your Grafana instance.
-
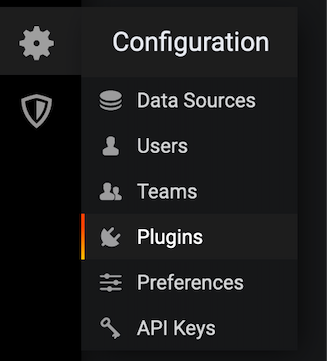
In the left menu, click on the Configuration icon, and click Plugins:
-
Search for the
OpenNMS Helmapplication and click on it.If the
OpenNMS Helmapplication is not listed on thePluginstab, try restarting the Grafana server. If the issue persists, make sure the application is installed correctly. -
Enable the application by clicking the
Enablebutton.If you see a
Disablebutton, then the application is already enabled and you can skip to the next step (creating Custom Actions). You may also chooseUpdatefor the latest version of HELM.
Custom Actions
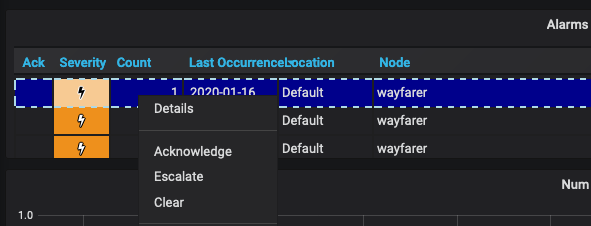
A custom action is a user-defined operation, such as a link to a node detail page or a Wiki knowledgebase article, that can help users obtain a deeper diagnosis of an alarm. Once created, custom actions appear when you right-click an alarm in an alarms table:
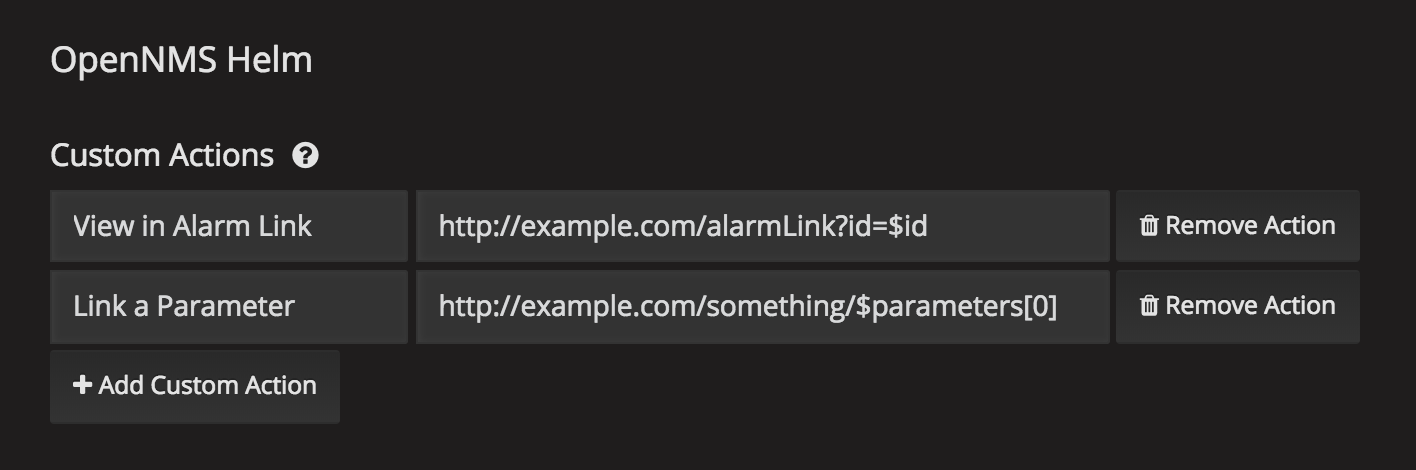
Created in the Helm Config tab, a custom action includes a label and URL.
Custom action URLs may contain $variables that reference properties of an OpenNMS alarm.
See OpenNMS.js documentation for a list of the available properties.
|
Special case: event parameters on the alarm can be accessed either by index ( |
If a variable can’t be matched against the row, the action will not appear in the context menu.
Variables will be URL-encoded when they are injected into the URL.
To create a custom action, follow these steps:
-
Navigate to the home page of your Grafana instance.
-
In the left menu, click on the Configuration icon and click Plugins:
-
Select OpenNMS Helm.
-
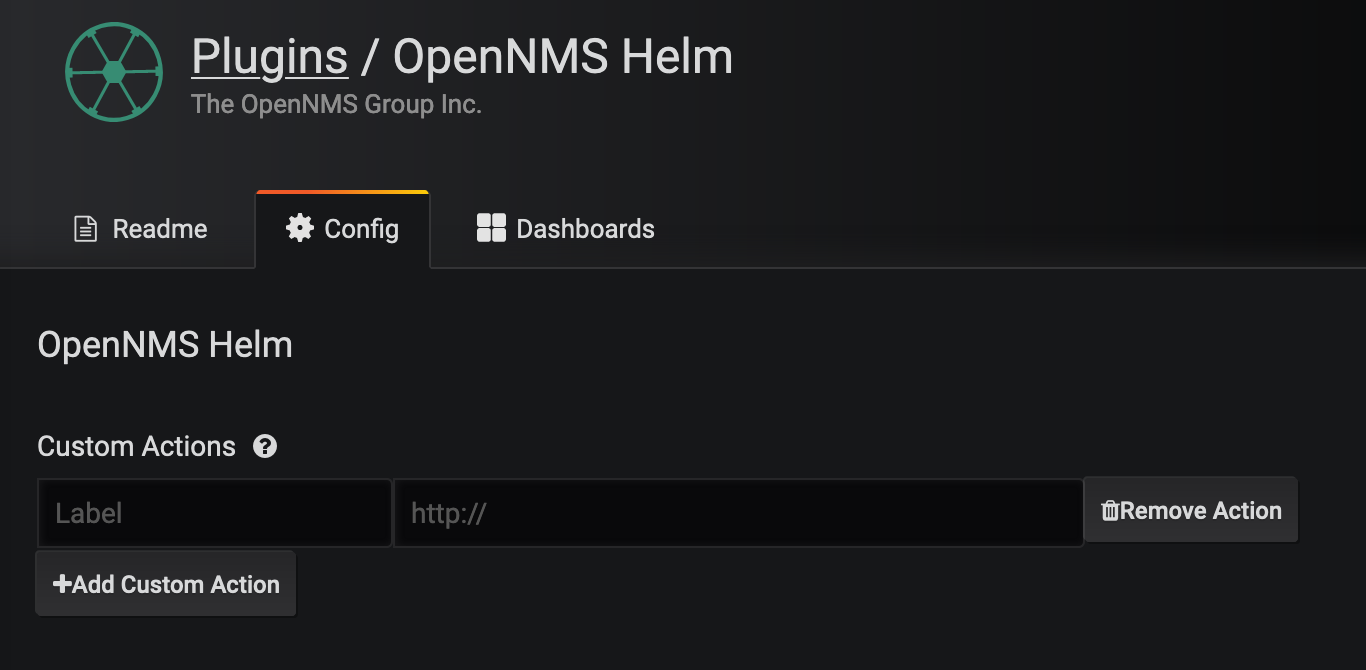
On the Confg tab, click +Add Custom Action:
-
Specify a label and enter a URL.
-
In most cases the URL will be your OpenNMS instance, e.g.,
http://localhost:8980/opennms/, appended with the $variable that references a property of an OpenNMS alarm.
-
-
Repeat for each custom action you want to create.
-
Click Update.
Datasource Setup
The type of data you can display in your dashboard depends on the datasource you select. Before creating a dashboard, you need to set up the datasource. OpenNMS datasources include performance, flow, and entity. For more information on OpenNMS datasources, see Datasources.
In this section, you will configure the Entity datasource.
Follow the same process to configure a Flow or Performance datasource.
The only fields you need to configure are the following: URL, Basic auth, Basic Auth Details (user and password).
Refer to Grafana’s documentation for information on configuring the other fields.
-
Navigate to the home page of your Grafana instance.
-
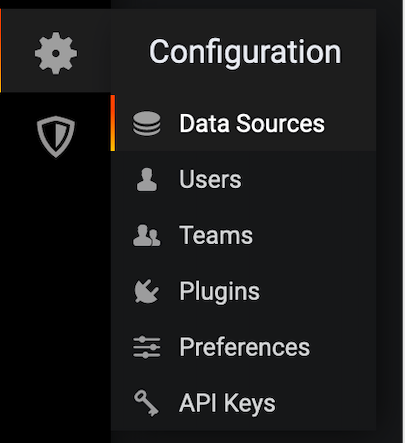
In the left menu, click on the Configuration icon, and click Data Sources:
-
Click on Add data source.
-
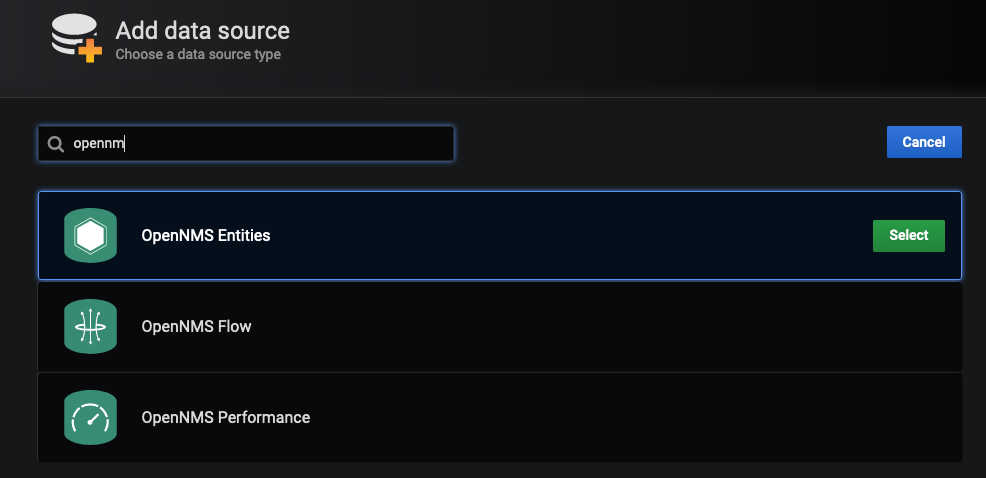
In the search field enter OpenNMS Entities.
-
Beside the OpenNMS Entities datasource, click Select:
The settings screen appears:
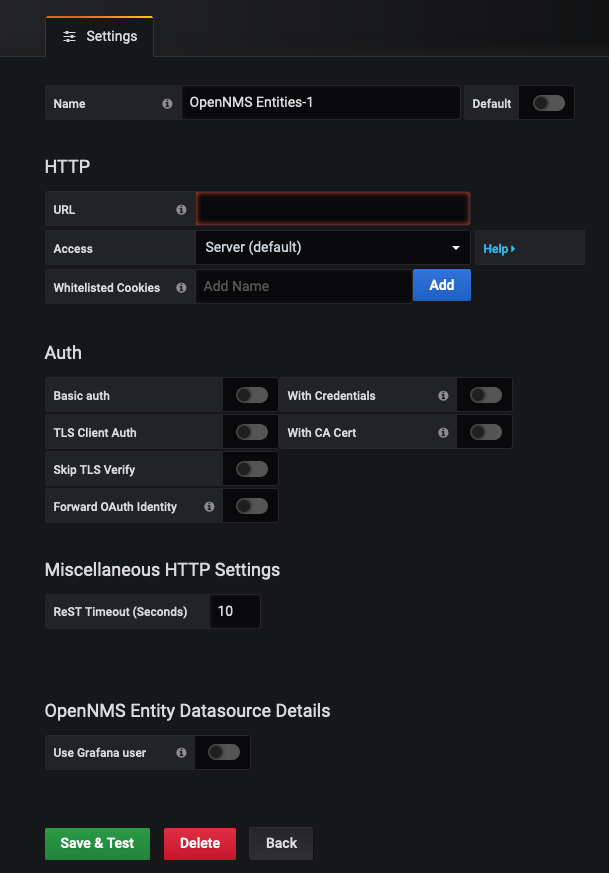
-
In the URL field, enter the URL to your OpenNMS instance, i.e.,
http://localhost:8980/opennms.The URL to your OpenNMS instance should normally end with
/opennms. -
Click the toggle switch next to Basic Auth.
-
Enter the credentials for an OpenNMS user in the User and Password fields.
-
Click Save & Test.
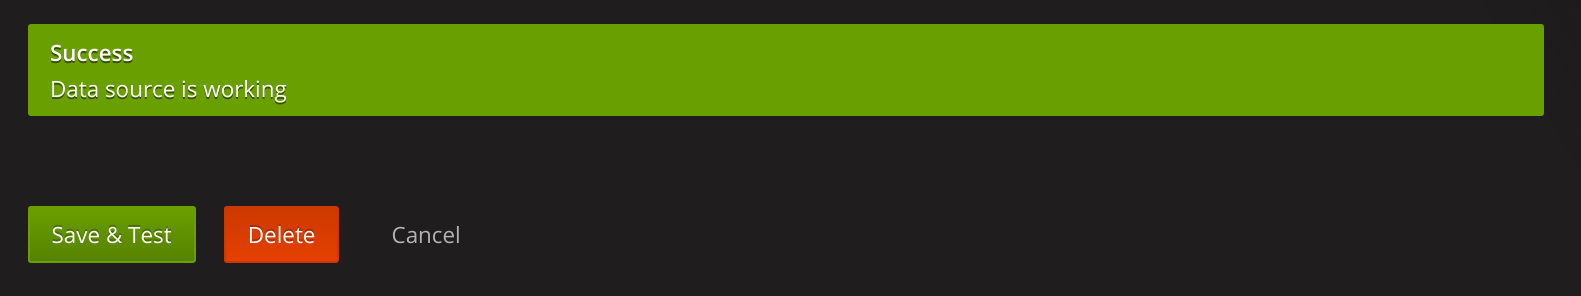
If the datasource is configured correctly a message indicating that the Data source is working appears.
If the message indicates a failure, review the information you entered and click Save & Test to test the datasource again.
Dashboard Setup
This section describes how to create a dashboard with an alarm table. For information on displaying additional or different types of data, see creating a panel.
-
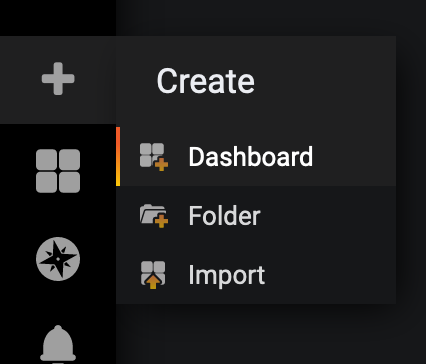
Create a new dashboard by clicking the + sign in the left menu and chooosing Create>Dashboard.
-
To add an alarm table, in the top right, click the
Add panelicon: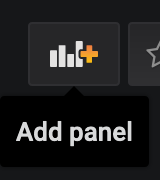
-
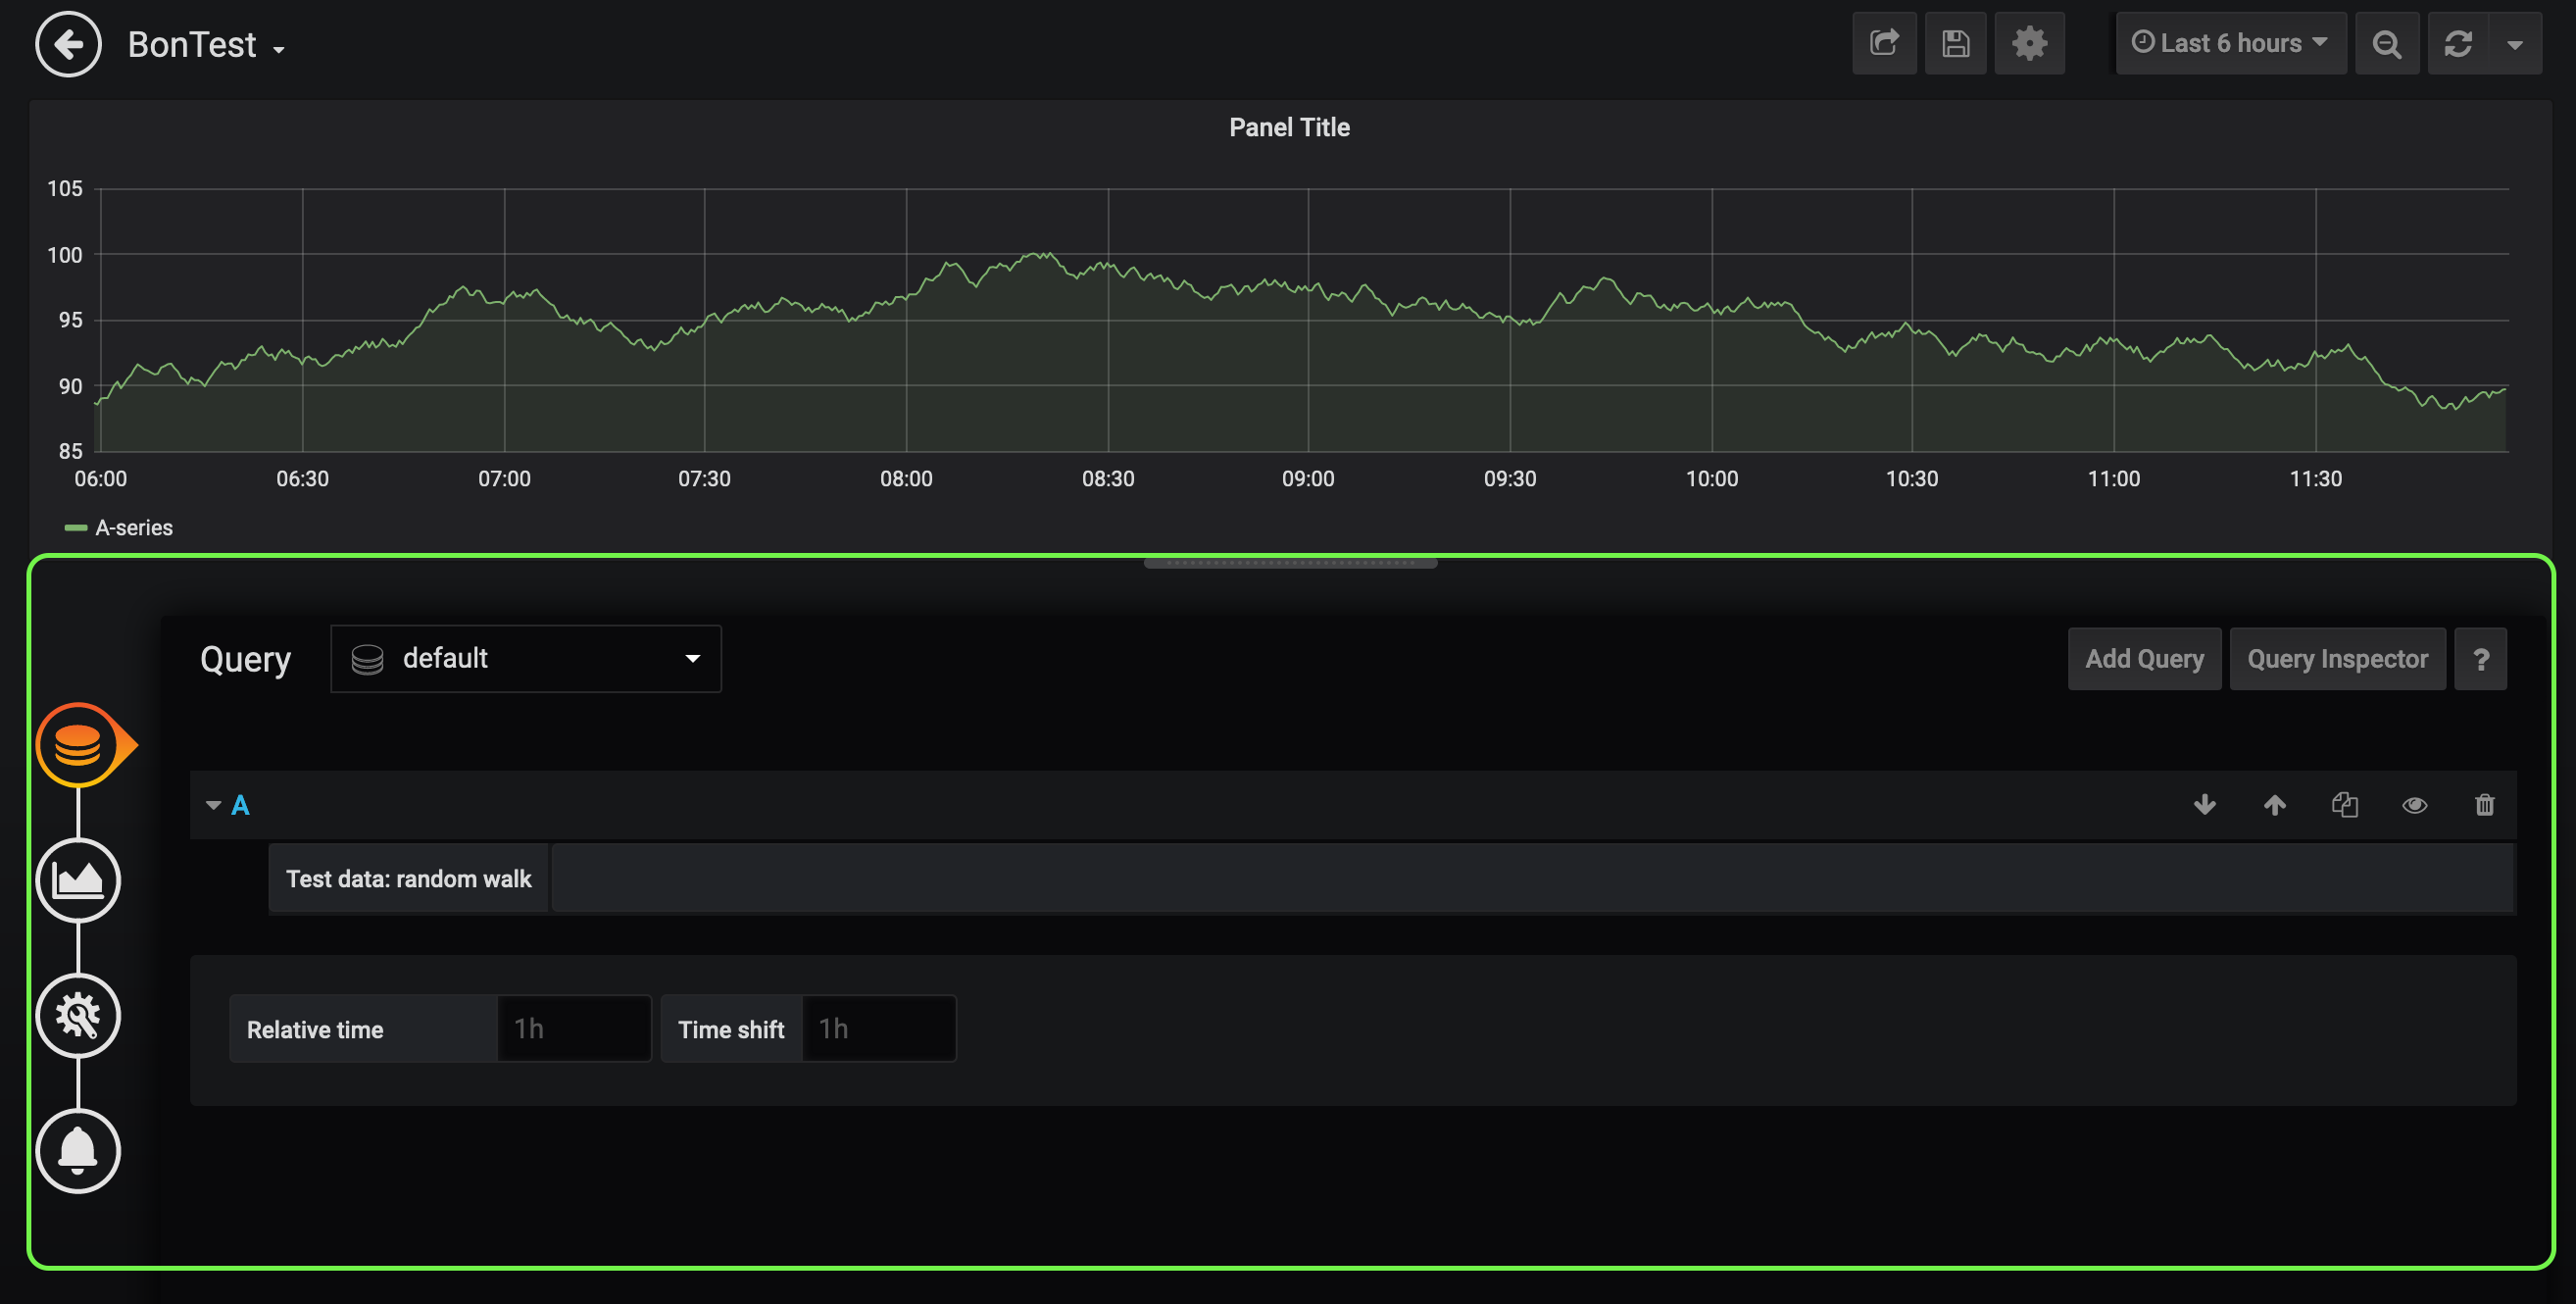
Click Add Query. A screen similar to the following appears. The lower half of the screen is where you configure your panel:
-
In the Query drop-down, select the datasource we previously created in Datasource Setup.
-
Select Alarms in the SELECT drop-down.
-
Configure addtional information and add filters as desired.
-
-
In the left menu, click the visualization icon.
-
In the Visualization drop-down, select Graph.
-
Click Alarm Table. The graph appears in the top of the panel.
-
You can further customize the graph by specifying information in the bottom half of the panel.
-
-
In the left menu, click the General icon to change the name of the panel and specify additional information.
-
In the top-right menu, click the
Save dashboardicon.
That’s it! Now, you have your first dashboard. Try changing the time range at the top right of the screen, or try performing actions against the alarms by right clicking on any of the alarm rows. You can also display other data by creating more panels, or import an existing dashboard to learn more about how to design your own.
Creating a Panel
A panel is the part of your dashboard that displays the fault and performance management data you specify. Before adding a panel, determine what type of data you want to display (performance, metrics, alarms/nodes), and make sure that you have setup the associated datasource. Default graph types in Grafana work only with the appropriate data source (i.e., an alarm table visualization will not display data if a flow datasource is specified.)
-
In your dashboard, click the
Add panelicon. -
Click Add Query.
-
In the Query drop-down, select the datasource.
-
Configure addtiional information as appropriate. Options are dependent on the type of datasource selected.
-
In the left menu, click the visualization icon.
-
In the Visualization drop-down, select Graph.
-
Select a graph type. The graph appears in the top of the panel.
-
You can further customize the graph by specifying information in the bottom half of the panel.
-
-
In the left menu, click the General icon to change the name of the panel and specify additional information.
-
In the top-right menu, click the
Save dashboardicon.
Creating an Alarm Panel
An alarm panel displays alarms from an entities datasource. Visualization of entity datasource information (currently nodes and alarms) is normally done in tables.
This procedure creates an alarm panel using an alarm table visualization.
-
In your dashboard, click the
Add panelicon. -
Click Add Query.
-
In the Query drop-down, select an entity datasource.
-
From SELECT, choose
Alarms. -
Create filters and conditions to specify the nodes/alarms to display:
-
Note that you can use nested "and/or" logic.
-
You can order by ascending (oldest alarms first) or descending (most recent alarms) and limit the number of alarms displayed.
-
Toggle featured attributes on to display select attributes. Toggle it off to display all attributes in the drop-downs.
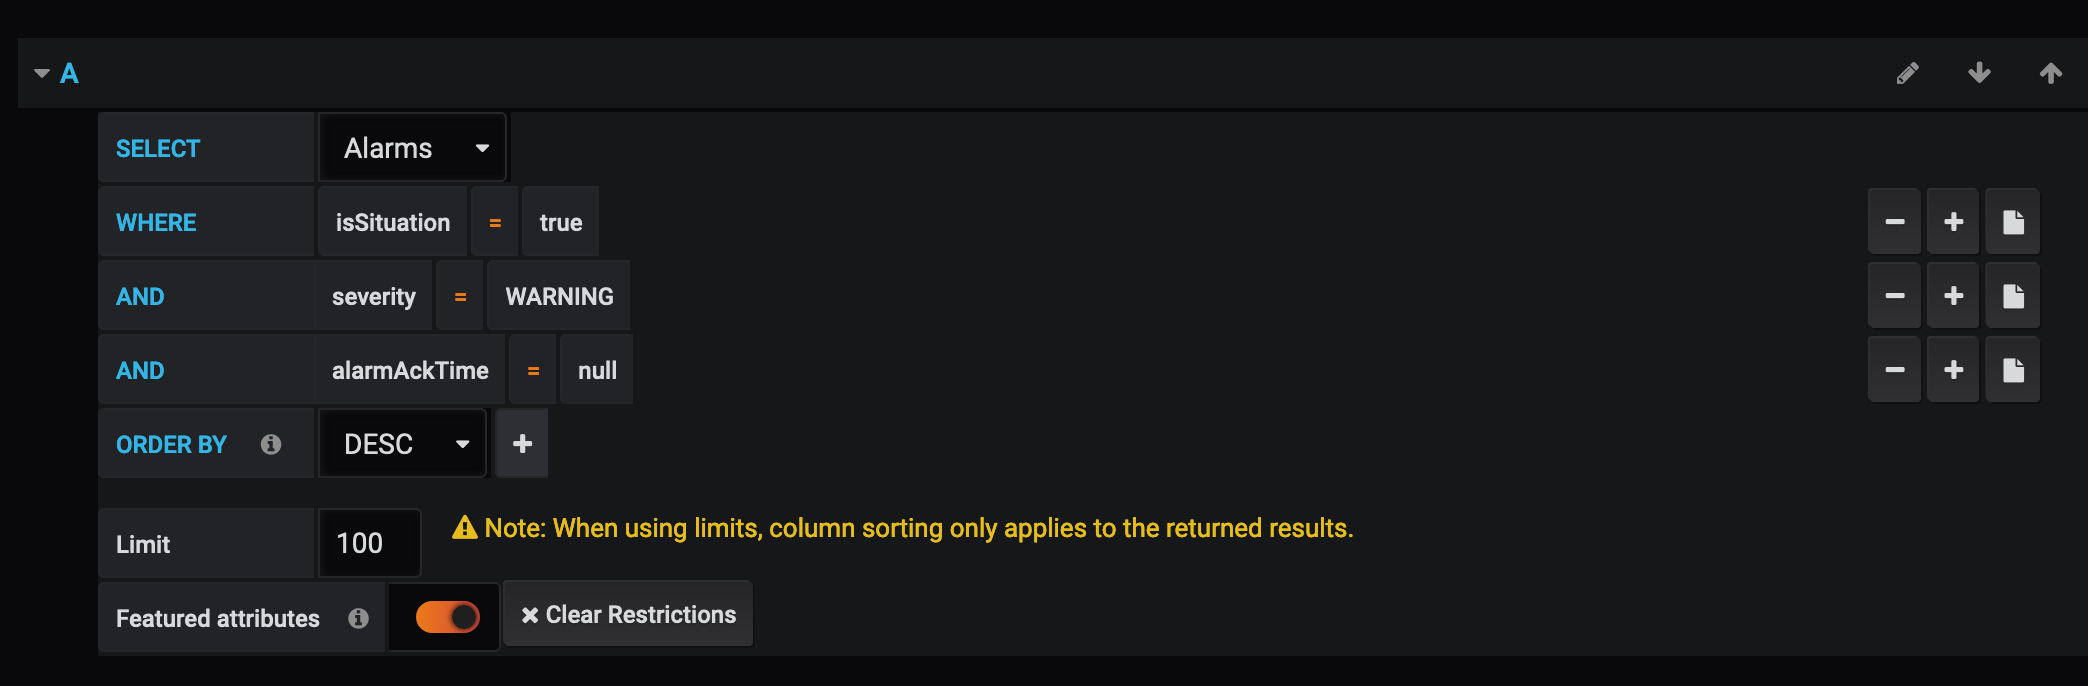 Sample alarm table configuration
 -
-
In the left menu, click the visualization icon.
-
In the Visualization drop-down, select Graph.
-
Select an
Alarm Tablegraph.-
With alarms, you can also choose
TableorAlarm histogram; with nodes, chooseTable -
The graph appears in the top of the panel.
-
You can further customize the graph by specifying information in the bottom half of the screen.
-
-
In the left menu, click the General icon to change the name of the panel and specify additional information.
-
In the top-right menu, click the
Save dashboardicon.