What is HELM?
HELM is an application that allows users to create flexible dashboards to interact with data stored by OpenNMS. HELM works with Grafana, an analytics platform, to display and customize fault management (FM) and performance management (PM) data from OpenNMS® Horizon™ and/or OpenNMS® Meridian™. Create and customize dashboards to display the data you want to see — alarms, outages, key performance indicators — in a way that best meets the needs of your workflow and staff.
How does it work?
HELM includes datasources for retrieving both FM and PM data from an existing OpenNMS deployment as well as specialized panels to display and interact with the faults. The ability to aggregate data from multiple instances of OpenNMS allows operators to build a single pane of glass from distributed deployments.
All interactions with OpenNMS are done via the REST API. No FM or PM data is stored within HELM or Grafana.

Fault Management
Fault management (FM) is the process of identifying problems (or faults) related to network devices and systems, and managing their lifecycle. OpenNMS can do this using a combination of events, outages, alarms, notifications, tickets, etc.
HELM supports filtering, retrieving, displaying and performing actions against alarms in OpenNMS.
|
Not familiar with alarms in OpenNMS? Check out this OpenNMS 101 video on YouTube: OpenNMS 101 - Module 5: Alarms. |
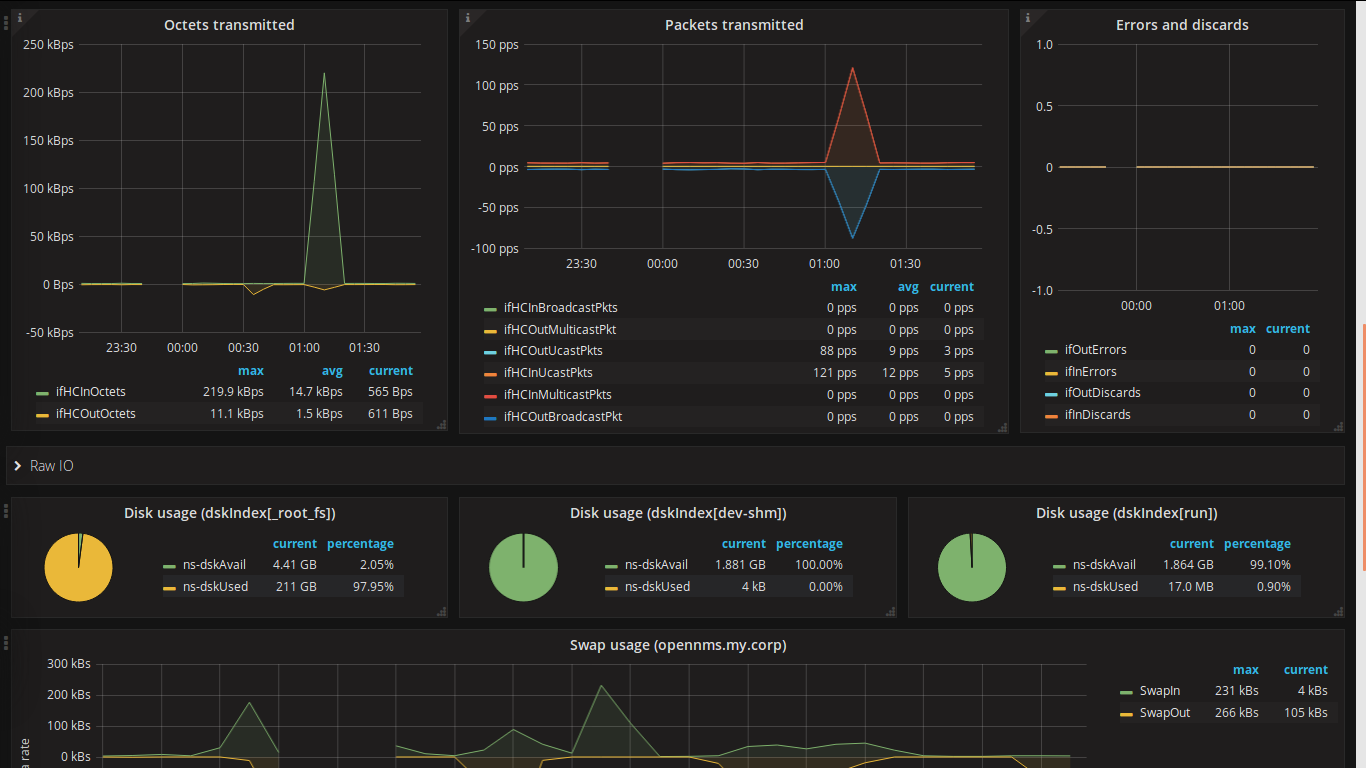
Performance Management
Performance management (PM) is the process of gathering, storing, and analyzing system health using a series of metrics or key performance indicators (KPIs). These metrics can be used for historical analysis, or to automatically generate faults when certain conditions or thresholds are met.
HELM supports retrieving and visualizing metric data (measurements) that OpenNMS stores.
|
Not familiar with data collection and storage in OpenNMS? Check out this OpenNMS 101 video on YouTube: OpenNMS 101 - Module 11: Data Collection. |