1. Service Assurance
This section will cover the basic functionalities how OpenNMS monitors availability and latency from applications or management agents. To change the behavior of how OpenNMS monitors applications or status information from management agents please see the Administration Guide. To extend the Service Monitor framework please see the Development Guide.
Measuring availability and latency of network services or applications is an important part in fault and performance management. In OpenNMS this task is provided by a Service Monitor framework. The main component is Pollerd which provides the following functionalities:
-
Track the status of a management resource or an application for availability calculations
-
Measure response times for service quality
-
Correlation of node and interface outages based on a Critical Service
The following image shows the model and representation of availability and response time.
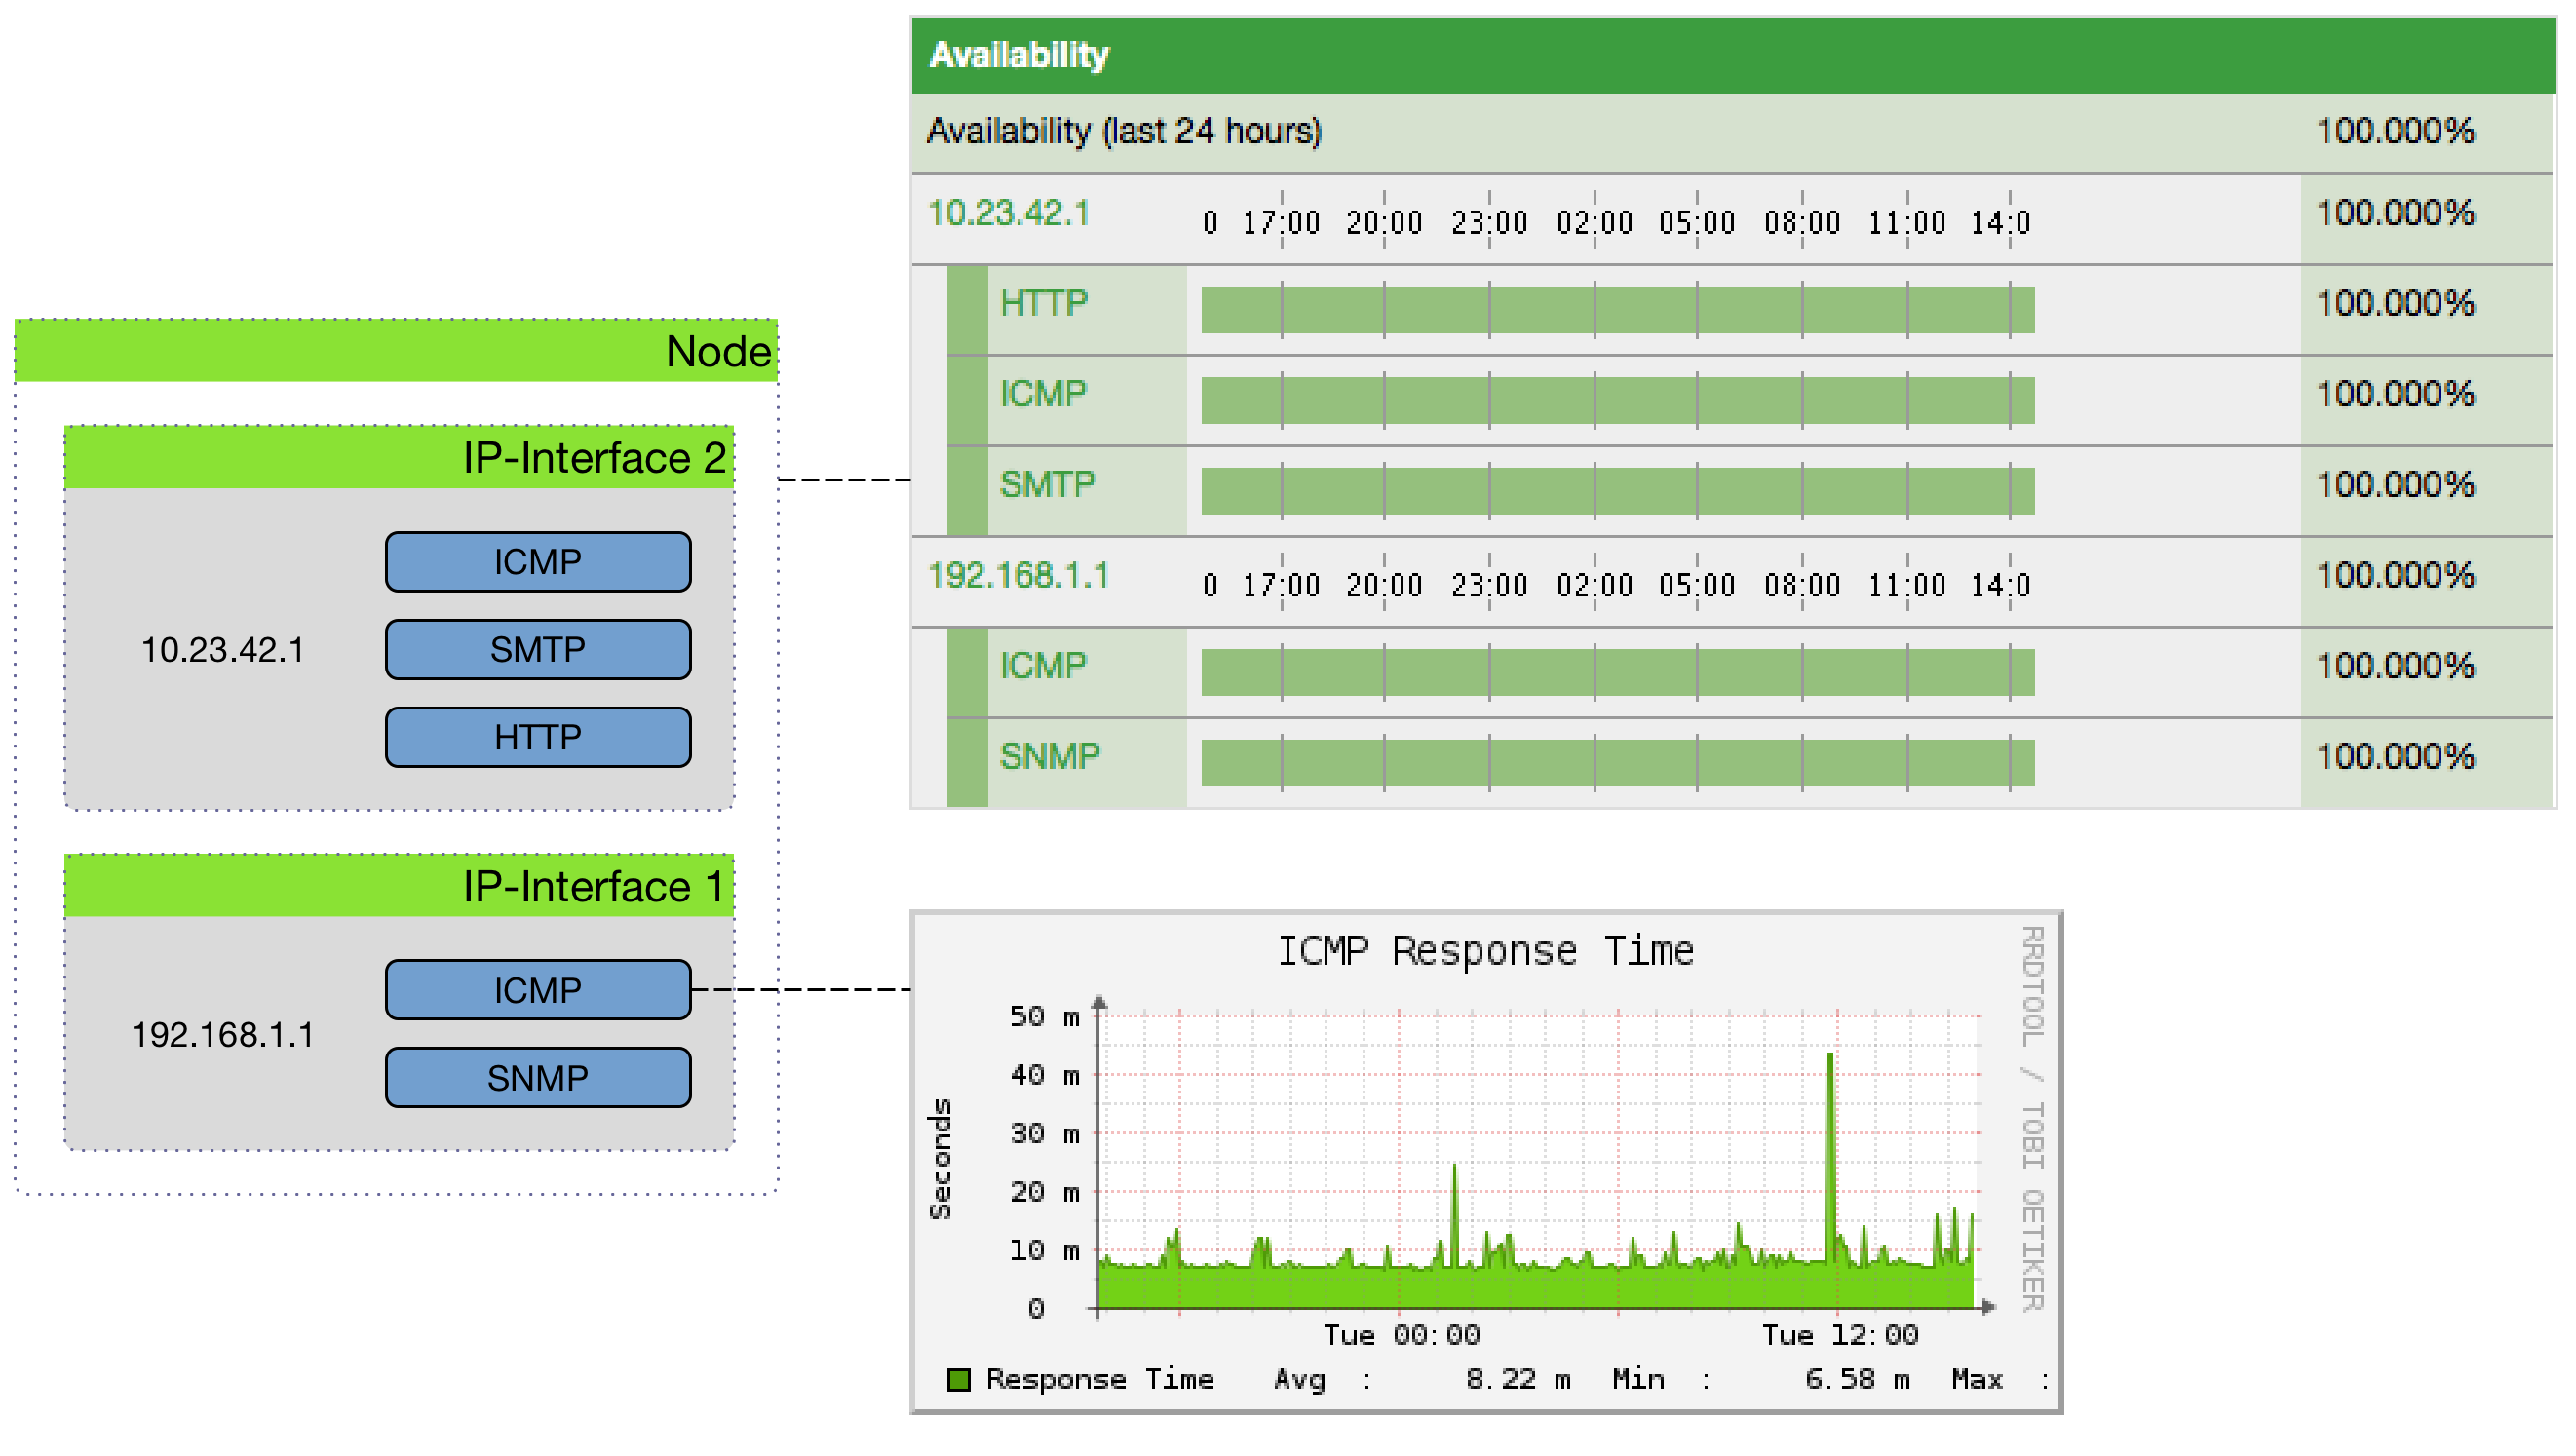
This information is based on Service Monitors which are scheduled and executed by Pollerd. A Service can have any arbitrary name and is associated with a Service Monitor. For example, we can define two Services with the name HTTP and HTTP-8080, both are associated with the HTTP Service Monitor but use a different TCP port configuration parameter. The following figure shows how Pollerd interacts with other components in OpenNMS and applications or agents to be monitored.
The availability is calculated over the last 24 hours and is shown in the Surveillance Views, SLA Categories and the Node Detail Page. Response times are displayed as Resource Graphs of the IP Interface on the Node Detail Page. Configuration parameters of the Service Monitor can be seen in the Service Page by clicking on the Service Name on the Node Detail Page. The status of a Service can be Up or Down.
When a Service Monitor detects an outage, Pollerd sends an Event which is used to create an Alarm. Events can also be used to generate Notifications for on-call network or server administrators. The following images shows the interaction of Pollerd in OpenNMS.

Pollerd can generate the following Events in OpenNMS:
| Event name | Description |
|---|---|
|
Critical Services are still up, just this service is lost. |
|
Service came back up |
|
Critical Service on an IP interface is down or all services are down. |
|
Critical Service on that interface came back up again |
|
All critical services on all IP interfaces are down from node. The whole host is unreachable over the network. |
|
Some of the Critical Services came back online. |
The behavior to generate interfaceDown and nodeDown events is described in the Critical Service section.
| This assumes that node-outage processing is enabled. |
1.1. Critical service
Monitoring services on an IP network can be resource expensive, especially in cases where many of these services are not available. When a service is offline, or unreachable, the monitoring system spends most of it’s time waiting for retries and timeouts.
In order to improve efficiency, OpenNMS deems all services on a interface to be Down if the critical service is Down. By default OpenNMS uses ICMP as the critical service.
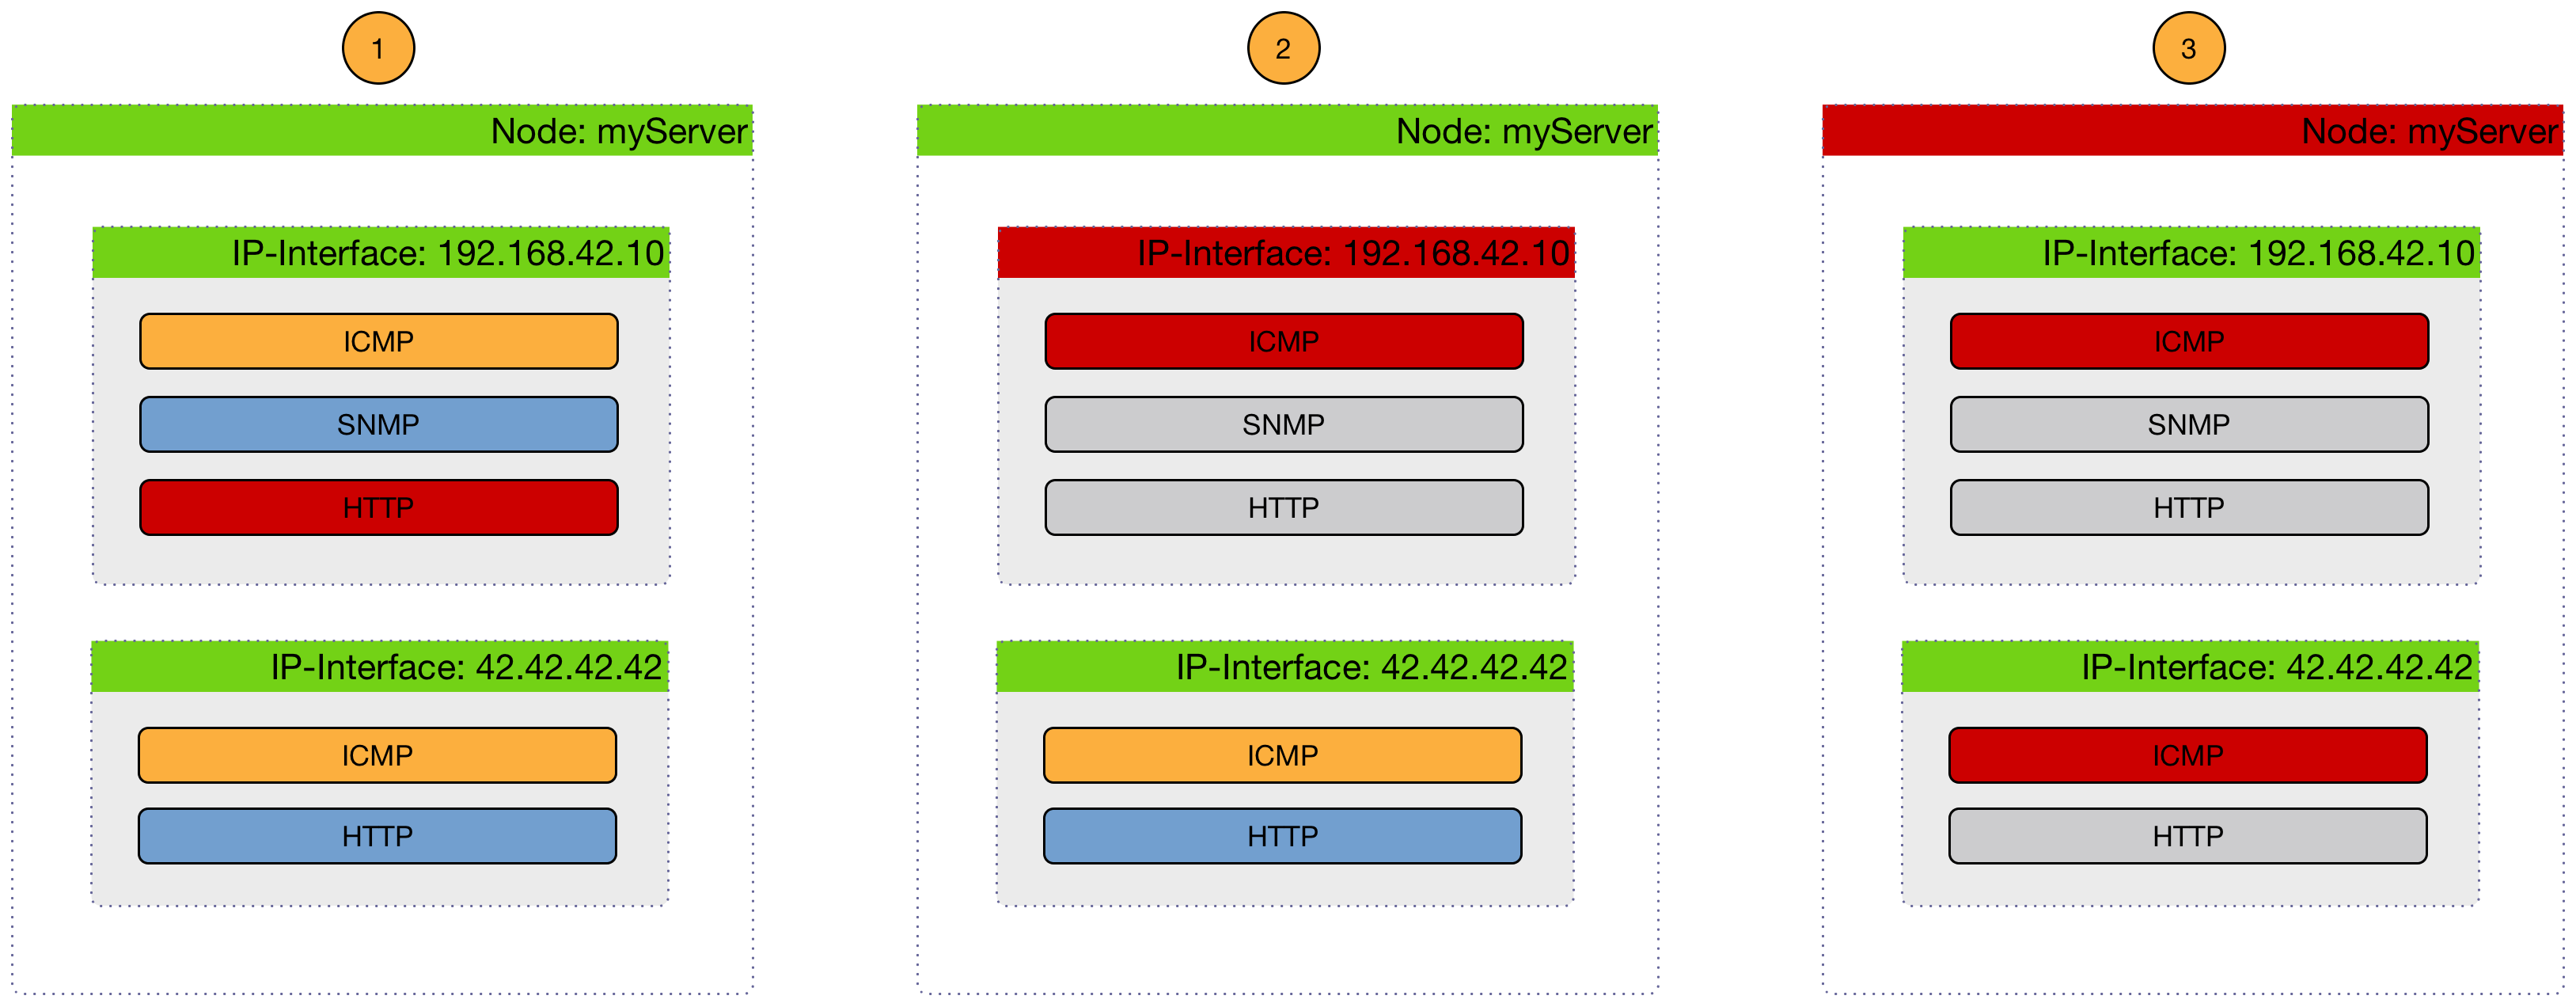
The following image shows, how a Critical Services is used to generate these events.
-
(1) Critical services are all Up on the Node and just a nodeLostService is sent.
-
(2) Critical service of one of many IP interface is Down and interfaceDown is sent. All other services are not tested and no events are sent, the services are assumed as unreachable.
-
(3) All Critical services on the Node are Down and just a nodeDown is sent. All other services on the other IP Interfaces are not tested and no events are sent, these services are assumed as unreachable.
1.2. Path Outage
An outage of a central core component can cause a lot of node outages and notifications. For this reason it is possible to define a Critical Path. The Critical Path has to be defined from the network perspective of the monitoring system. The following image shows a simple example how devices can be reached in a Layer 3 network topology.
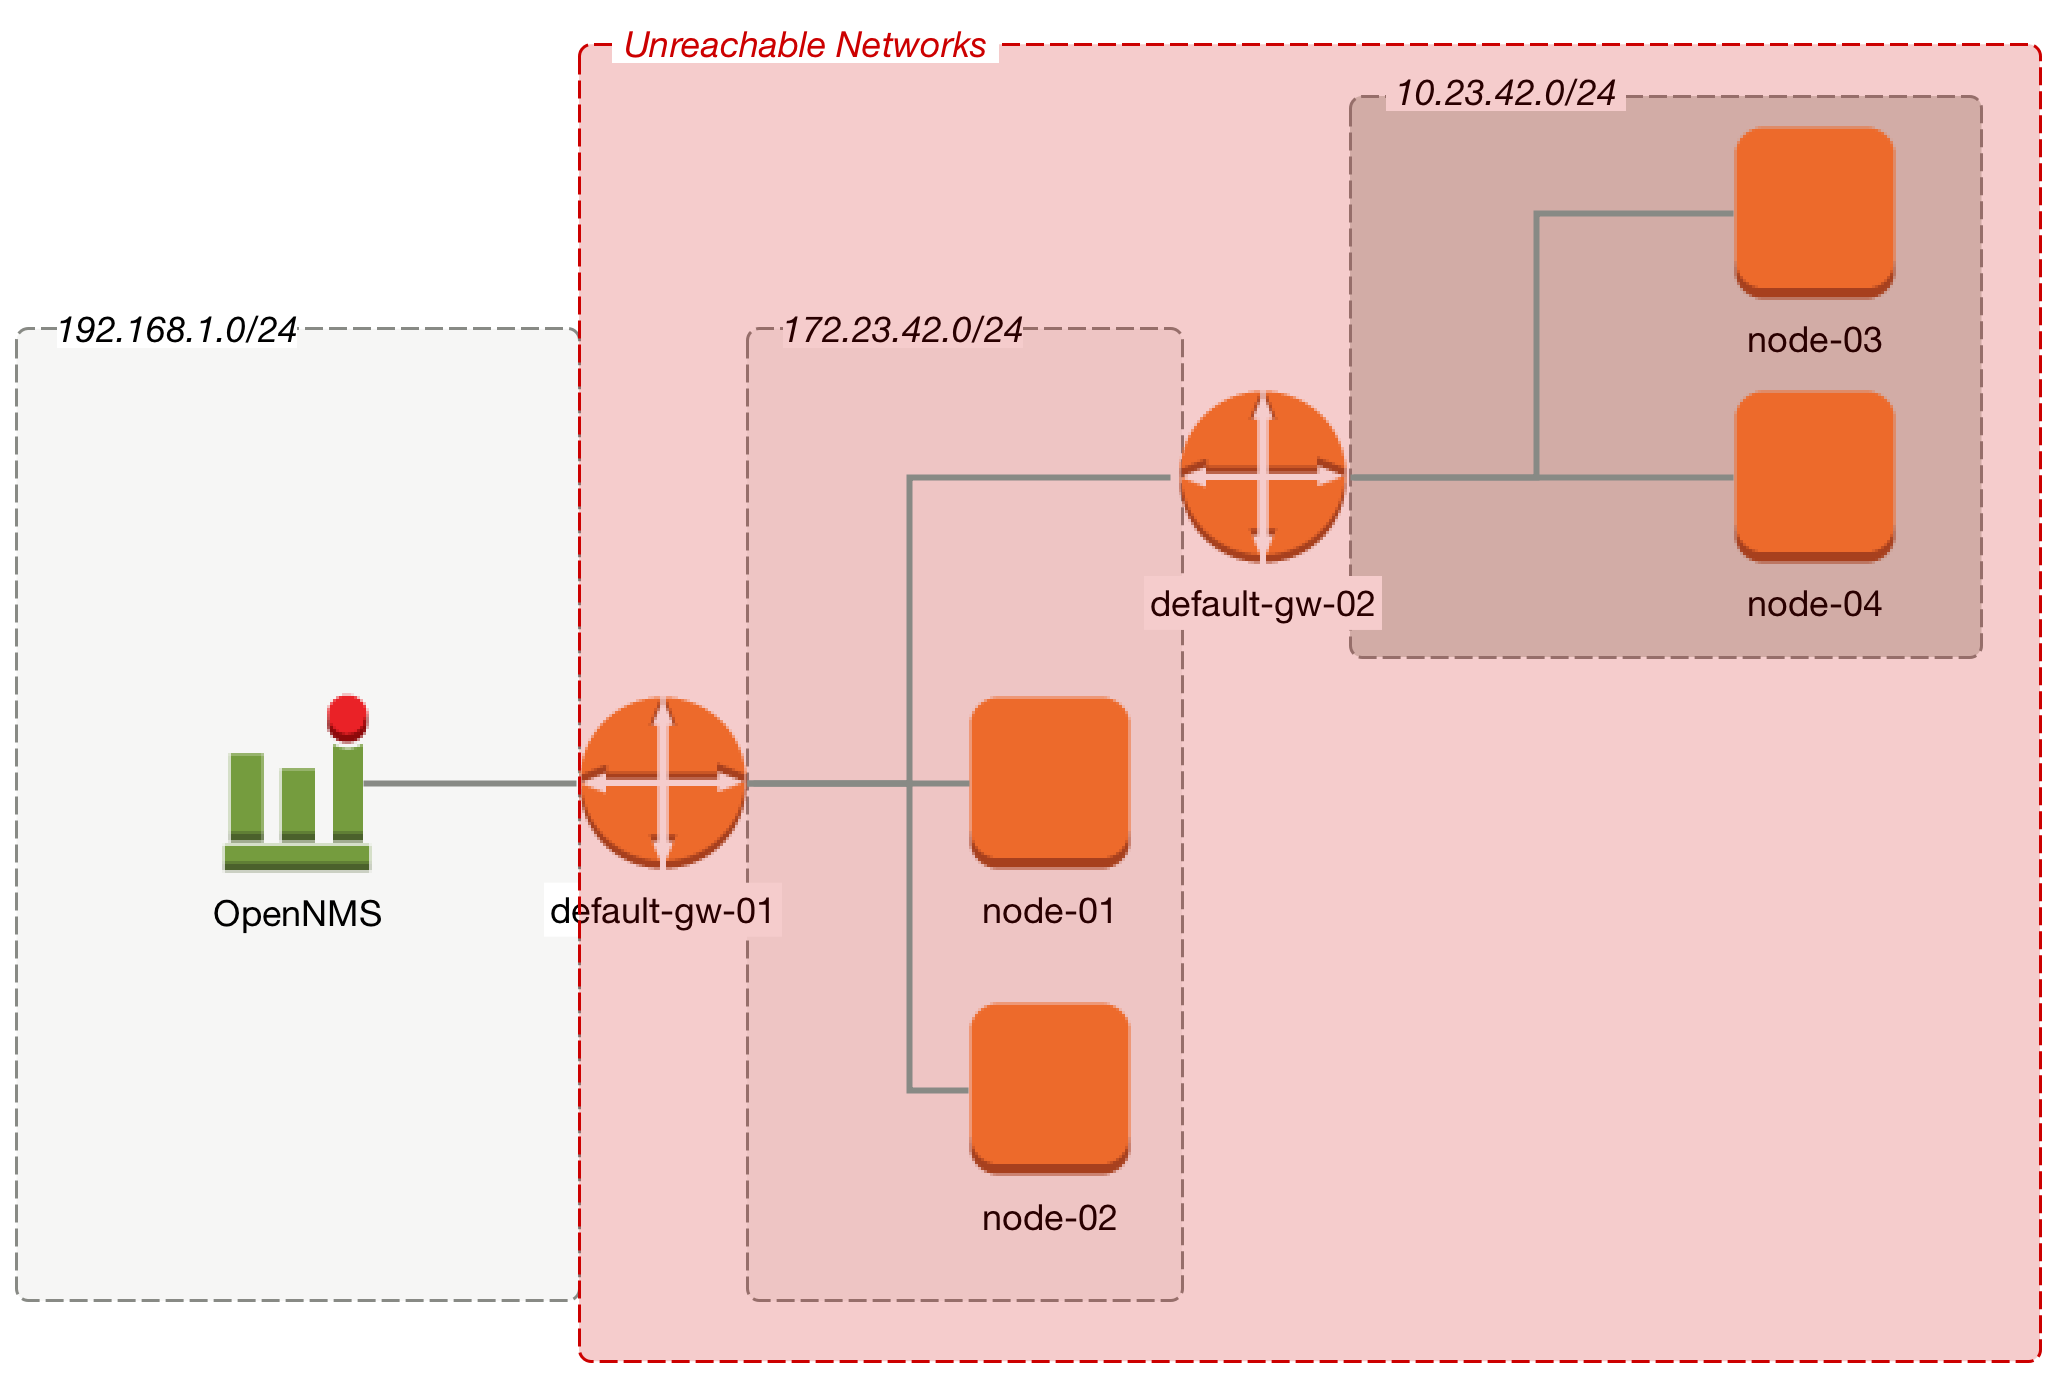
In figure Path Outage example implies a network Layer 3 topology. From the perspective of the monitoring system, default-gw-01 is on the Critical Path to two networks. In case default-gw-01 is down, it is not possible to reach any node in the two networks behind default-gw-01. To guide a network administrator to the correct problem, Notifications to all other unreachable Nodes based on the Critical Path are suppressed. The administrator will get just one Notification for the default-gw-01.
2. OpenNMS Horizon Surveillance View
When networks are larger and contain devices of different priority, it becomes interesting to show at a glance how the "whole system" is working. The surveillance view aims to do that. By using categories, you can define a matrix which allows to aggregate monitoring results. Imagine you have 10 servers with 10 internet connections and some 5 PCs with DSL lines:
| Servers | Internet Connections | |
|---|---|---|
Super important |
1 of 10 |
0 of 10 |
Slightly important |
0 of 10 |
0 of 10 |
Vanity |
4 of 10 |
0 of 10 |
The whole idea is to give somebody at a glance a hint on where the trouble is. The matrix-type of display allows a significantly higher aggregation than the simple list. In addition, the surveillance view shows nodes rather than services - an important tidbit of information when you look at categories. At a glance, you want to know how many of my servers have an issue rather than how many services in this category have an issue.

The visual indication for outages in the surveillance view cells is defined as the following:
-
No services down: green as normal
-
One (1) service down: yellow as warning
-
More than one (1) services down: red as critical
This Surveillance View model also builds the foundation of the Dashboard View.
2.1. Default Surveillance View Configuration
Surveillance Views are defined in the surveillance-views.xml file.
This file resides in the OpenNMS Horizon etc directory.
| This file can be modified in a text editor and is reread every time the Surveillance View page is loaded. Thus, changes to this file do not require OpenNMS Horizon to be restarted. |
The default configuration looks like this:
<?xml version="1.0" encoding="UTF-8"?>
<surveillance-view-configuration
  xmlns:this="http://www.opennms.org/xsd/config/surveillance-views"
  xmlns:xsi="http://www.w3.org/2001/XMLSchema-instance"
  xsi:schemaLocation="http://www.opennms.org/xsd/config/surveillance-views http://www.opennms.org/xsd/config/surveillance-views.xsd"
  default-view="default" >
  <views >
    <view name="default" refresh-seconds="300" >
      <rows>
        <row-def label="Routers" >
          <category name="Routers"/>
        </row-def>
        <row-def label="Switches" >
          <category name="Switches" />
        </row-def>
        <row-def label="Servers" >
          <category name="Servers" />
        </row-def>
      </rows>
      <columns>
        <column-def label="PROD" >
          <category name="Production" />
        </column-def>
        <column-def label="TEST" >
          <category name="Test" />
        </column-def>
        <column-def label="DEV" >
          <category name="Development" />
        </column-def>
      </columns>
    </view>
  </views>
</surveillance-view-configuration>
Please note, that the old report-category attribute is deprecated and is no longer supported.
|
2.2. Configuring Surveillance Views
The Surveillance View configuration can also be modified using the Surveillance View Configurations editor on the OpenNMS Horizon Admin page.

This page gives an overview of the configured Surveillance Views and allows the user to edit, remove or even preview the defined Surveillance View. Furthermore, the default Surveillance View can be selected using the checkbox in the DEFAULT column.
When editing a Surveillance View the user has to define the view’s title and the time in seconds between successive refreshes. On the left side of this dialog the defined rows, on the right side the defined columns are listed. Beside adding new entries an user can modify or delete existing entries. Furthermore, the position of an entry can be modified using the up/down buttons.
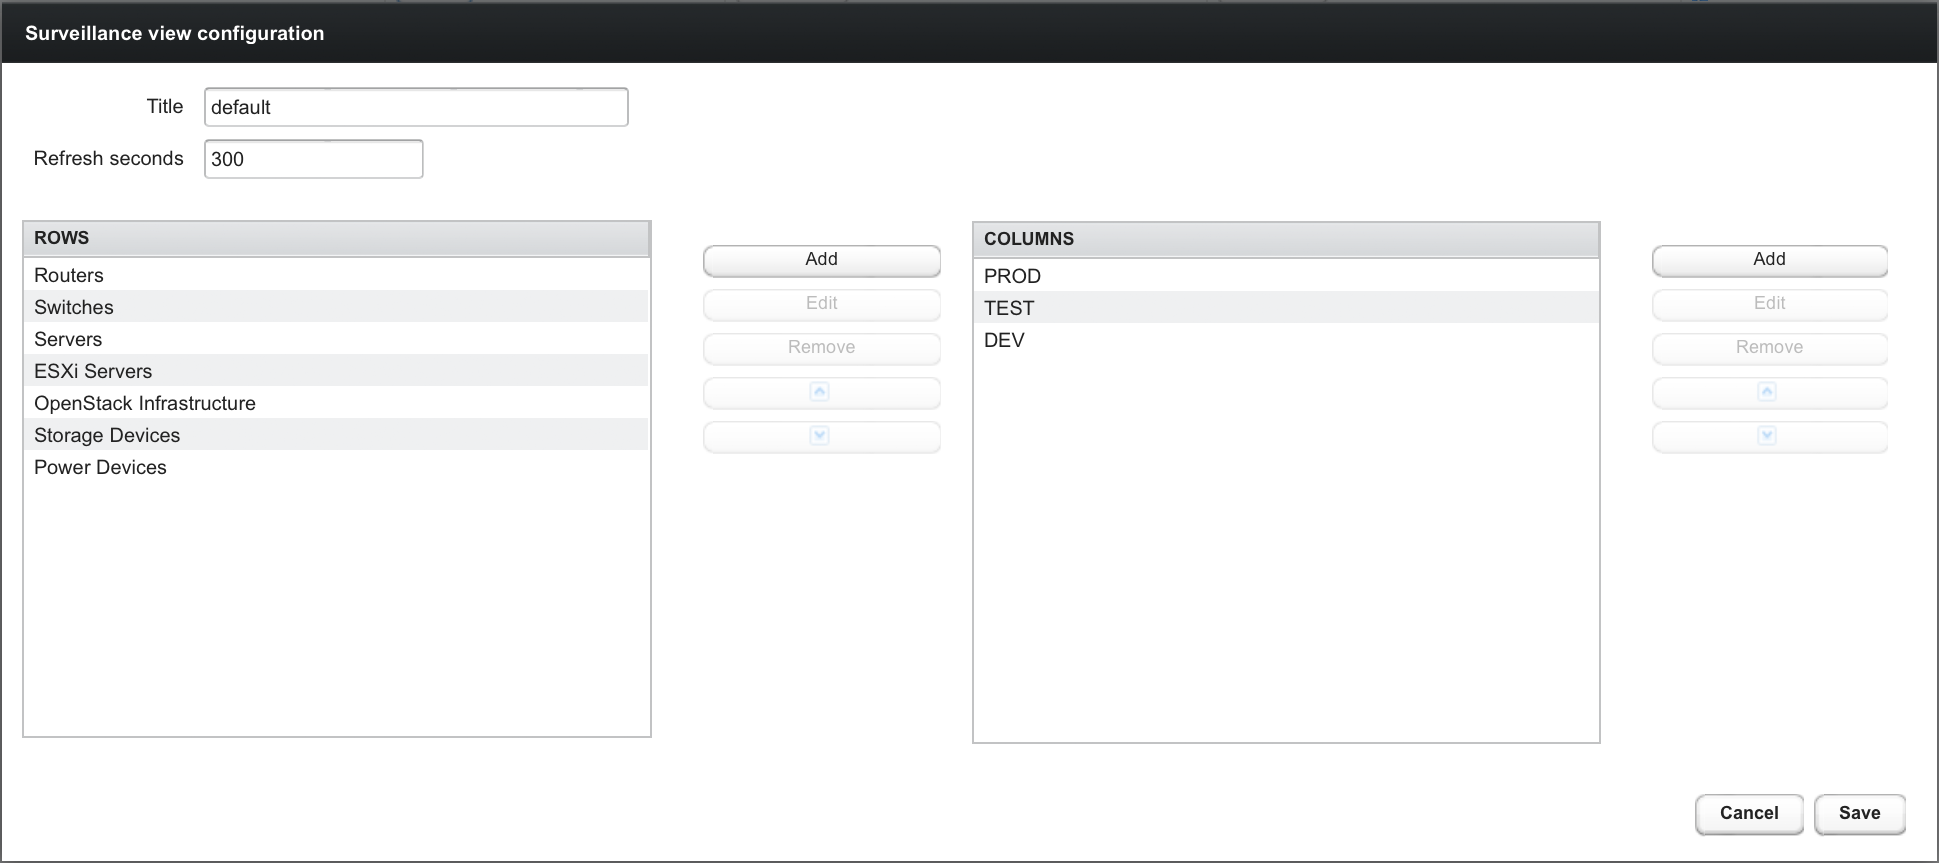
Editing row or column definitions require to choose an unique label for this entry and at least one OpenNMS Horizon category. When finished you can hit the Save button to persist your modified configuration or Cancel to close this dialog.
2.3. Categorizing Nodes
In order to categorize nodes in the Surveillance View, choose a node and click Edit beside Surveillance Category Memberships. Recalling from your Surveillance View, choose two categories that represent a column and a row, for example, Servers and Test, then click Add.
2.4. Creating Views for Users and Groups
You can use user and group names for Surveillance Views. When the Surveillance View page is invoked the following criteria selects the proper Surveillance View to be displayed. The first matching item wins:
-
Surveillance View name equal to the user name they used when logging into OpenNMS Horizon.
-
Surveillance View name equal to the user’s assigned OpenNMS Horizon group name
-
Surveillance View name equal to the
default-viewattribute in thesurveillance-views.xmlconfiguration file.
3. OpenNMS Horizon Dashboard
In Network Operation Centers NOC an overview about issues in the network is important and often described as Dashboards. Large networks have people (Operator) with different responsibilities and the Dashboard should show only information for a given monitoring context. Network or Server operator have a need to customize or filter information on the Dashboard. A Dashboard as an At-a-glance overview is also often used to give an entry point for more detailed diagnosis through the information provided by the monitoring system. The Surveillance View allows to reduce the visible information by selecting rows, columns and cells to quickly limit the amount of information to navigate through.
3.1. Dashboard Components
The Dashboard is built with five components:
-
Surveillance View: Allows to model a monitoring context for the Dashboard.
-
Alarms: Shows unacknowledged Alarms which should be escalated by an Operator.
-
Notifications: Shows outstanding and unacknowledged notifications sent to Engineers.
-
Node Status: Shows all ongoing network Outages.
-
Resource Graph Viewer: Shows performance time series reports for performance diagnosis.
The following screenshot shows a configured Dashboard and which information are displayed in the components.
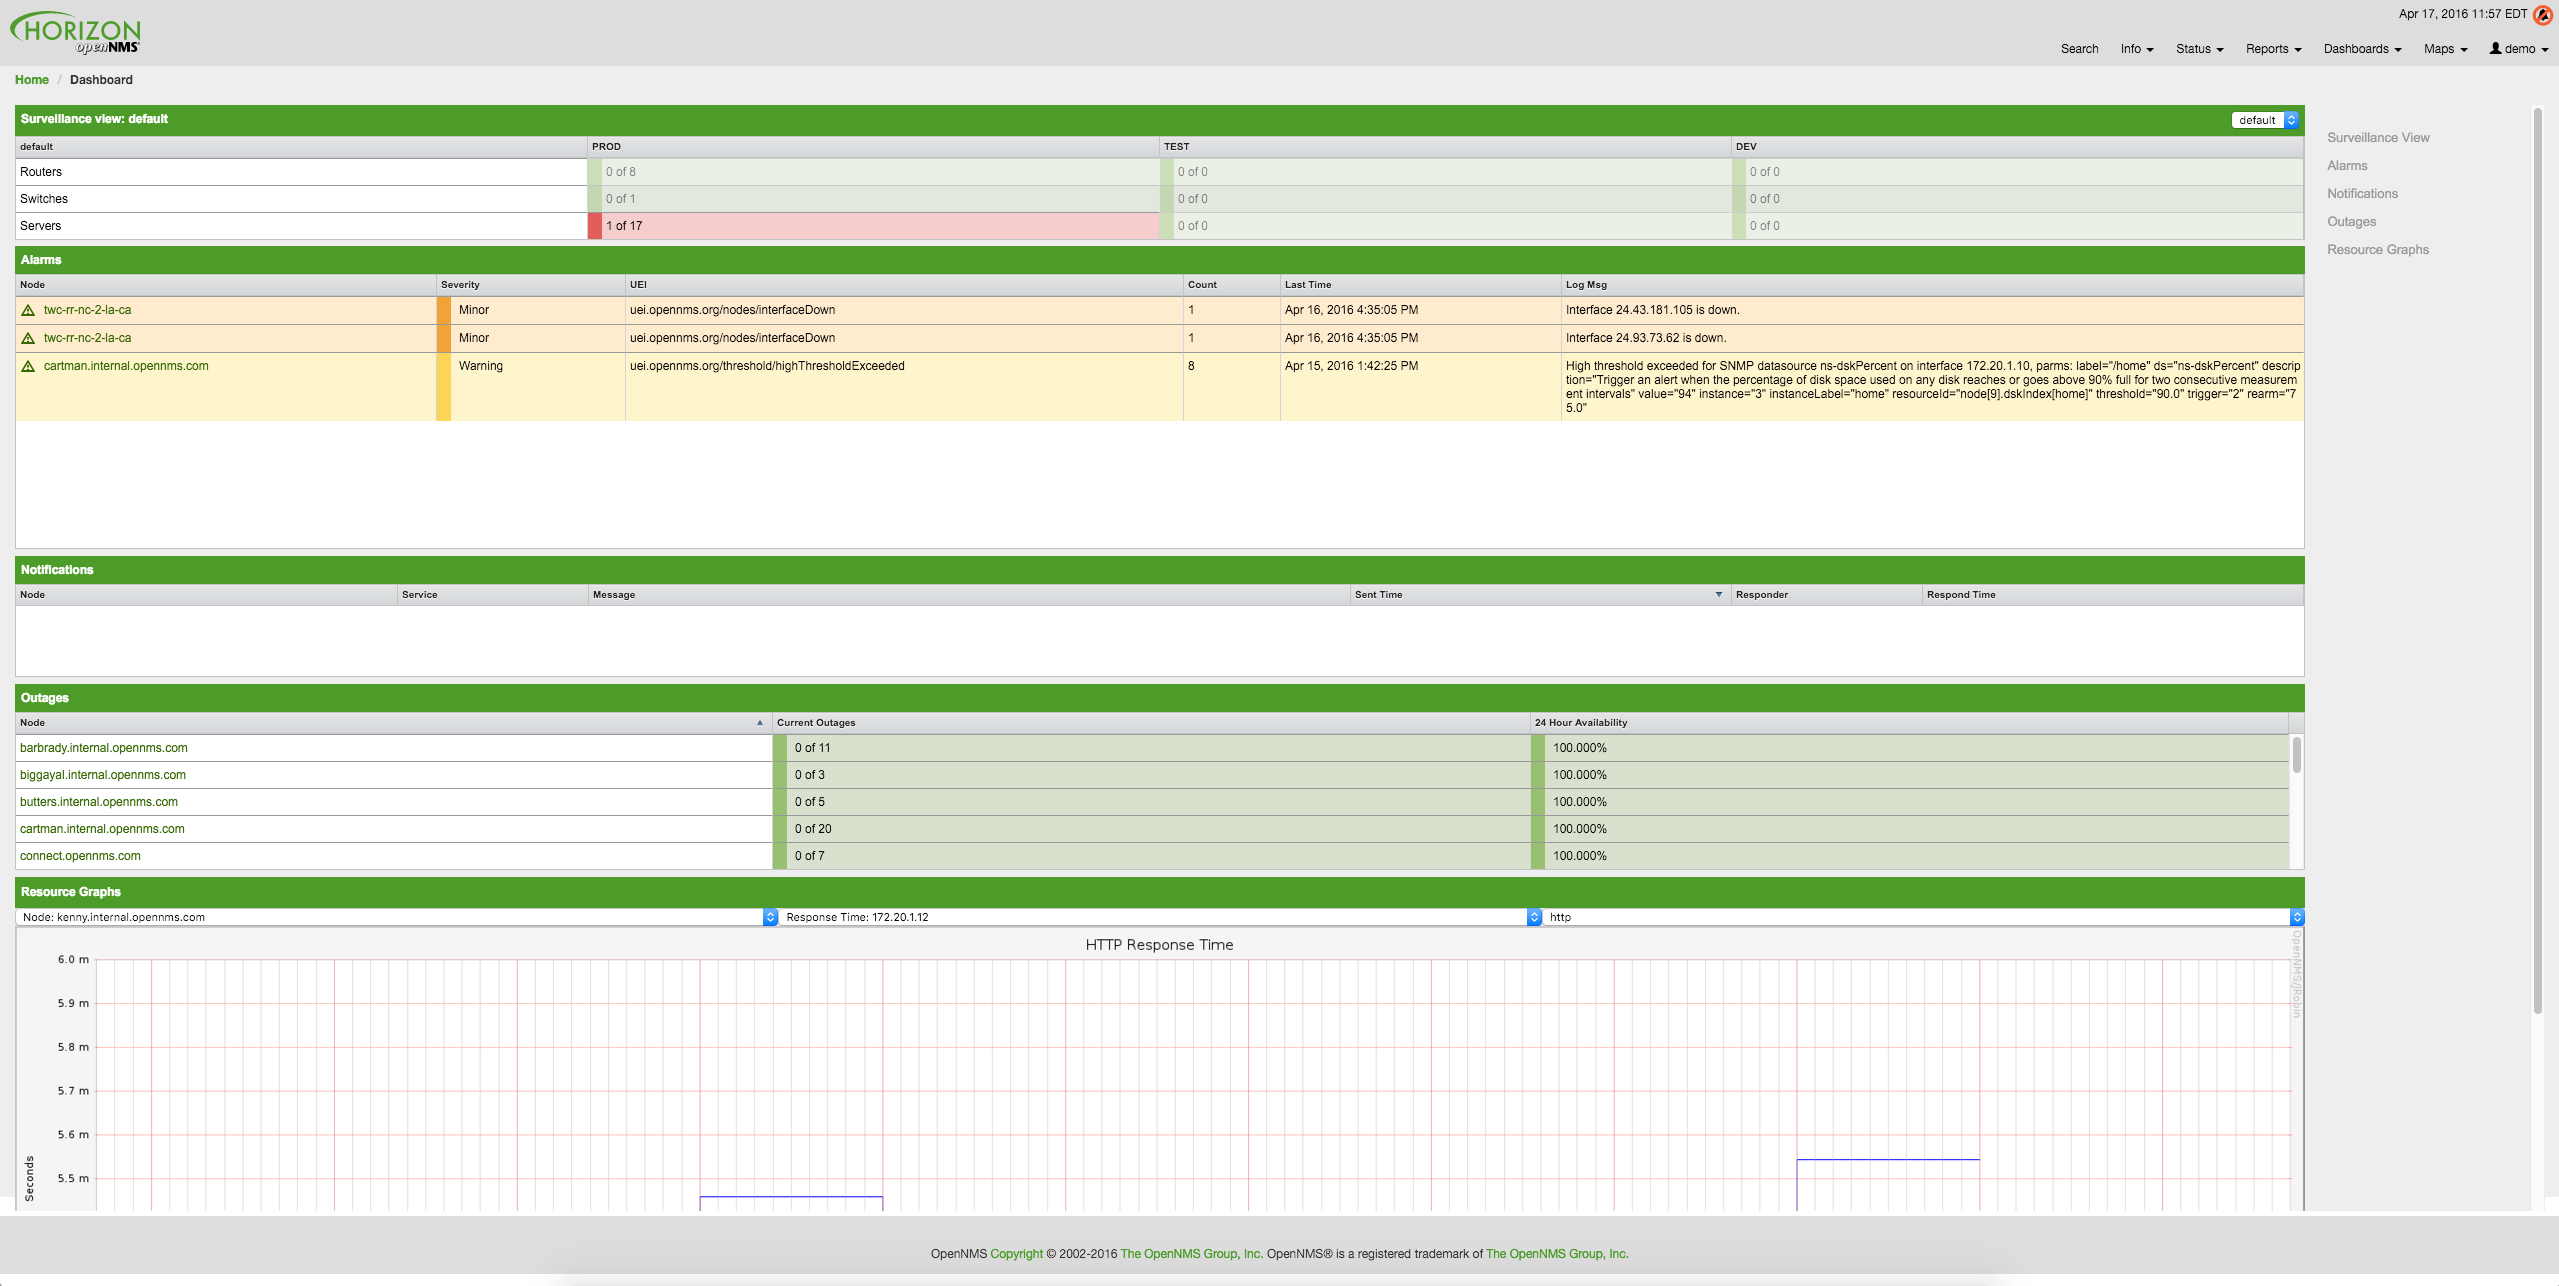
The following section describe the information shown in each component. All other components display information based on the Surveillance View.
3.1.1. Surveillance View
The Surveillance View has multiple functions.
-
Allows to model the monitoring context and shows service and node Outages in compact matrix view.
-
Allows to limit the number of information in the Dashboard by selecting rows, columns and cells.
You can select columns, rows, single cells and of course all entries in a Surveillance View. Please refer to the Surveillance View Section for details on how to configure Surveillance Views.

3.1.2. Alarms
The Alarms component gives an overview about all unacknowledged Alarms with a severity higher than Normal(1). Acknowledged Alarms will be removed from the responsibility of the Operator. The following information are shown in:

-
Node: Node label of the node the Alarm is associated
-
Severity: Severity of the Alarm
-
UEI: Shows the UEI of the Alarm
-
Count: Number of Alarms deduplicated by the reduction key of the Alarm
-
Last Time: Time for the last occurrence of the Alarm
-
Log Msg: The log message from the Event which is the source for this Alarm. It is specified in the event configuration file in
<logmsg />
The Alarms component shows the most recent Alarms and allows the user to scroll through the last 100 Alarms.
3.1.3. Notifications
To inform people on a duty schedule notifications are used and force action to fix or reconfigure systems immediately. In OpenNMS Horizon it is possible to acknowledge notifications to see who is working on a specific issue. The Dashboard should show outstanding notifications in the NOC to provide an overview and give the possibility for intervention.

-
Node: Label of the monitored node the notification is associated with
-
Service: Name of the service the notification is associated with
-
Message: Message of the notification
-
Sent Time: Time when the notification was sent
-
Responder: User name who acknowledged the notification
-
Response Time: Time when the user acknowledged the notification
The Notifications component shows the most recent unacknowledged notifications and allows the user to scroll through the last 100 Notifications.
3.1.4. Node Status
An acknowledged Alarm doesn’t mean necessarily the outage is solved. To give an overview information about ongoing Outages in the network, the Dashboard shows an outage list in the Node Status component.

-
Node: Label of the monitored node with ongoing outages.
-
Current Outages: Number of services on the node with outages and total number of monitored services, e.g. with the natural meaning of "3 of 3 services are affected".
-
24 Hour Availability: Availability of all services provided by the node calculated by the last 24 hours.
3.1.5. Resource Graph Viewer
To give a quick entry point diagnose performance issues a Resource Graph Viewer allows to navigate to time series data reports which are filtered in the context of the Surveillance View.

It allows to navigate sequentially through resource graphs provided by nodes filtered by the Surveillance View context and selection and shows one graph report at a time.
3.2. Advanced configuration
The Surveillance View component allows to model multiple views for different monitoring contexts. It gives the possibility to create special view as example for network operators or server operators. The Dashboard shows only one configured Surveillance View. To give different users the possibility using their Surveillance View fitting there requirements it is possible to map a logged in user to a given Surveillance View used in the Dashboard.
The selected nodes from the Surveillance View are also aware of User Restriction Filter. If you have a group of users, which should see just a subset of nodes the Surveillance View will filter nodes which are not related to the assigned user group.
The Dashboard is designed to focus, and therefore also restrict, a user’s view to devices of their interest. To do this, a new role was added that can be assigned to a user that restricts them to viewing only the Dashboard if that is intended.
3.2.1. Using the Dashboard role
The following example illustrates how this Dashboard role can be used.
For instance the user drv4doe is assigned the dashboard role.
So, when logging in as drv4doe, the user is taking directly to the Dashboard page and is presented with a custom Dashboard based on the drv4doe Surveillance View definition.
Step 1: Create an user
The following example assigns a Dashboard to the user "drv4doe" (a router and switch jockey) and restricts the user for navigation to any other link in the OpenNMS Horizon WebUI.

drv4doe using the OpenNMS Horizon WebUIStep 2: Change Security Roles
Now, add the ROLE_PROVISION role to the user through the WebUI or by manually editing the users.xml file in the /opt/opennms/etc directory for the user drv4doe.
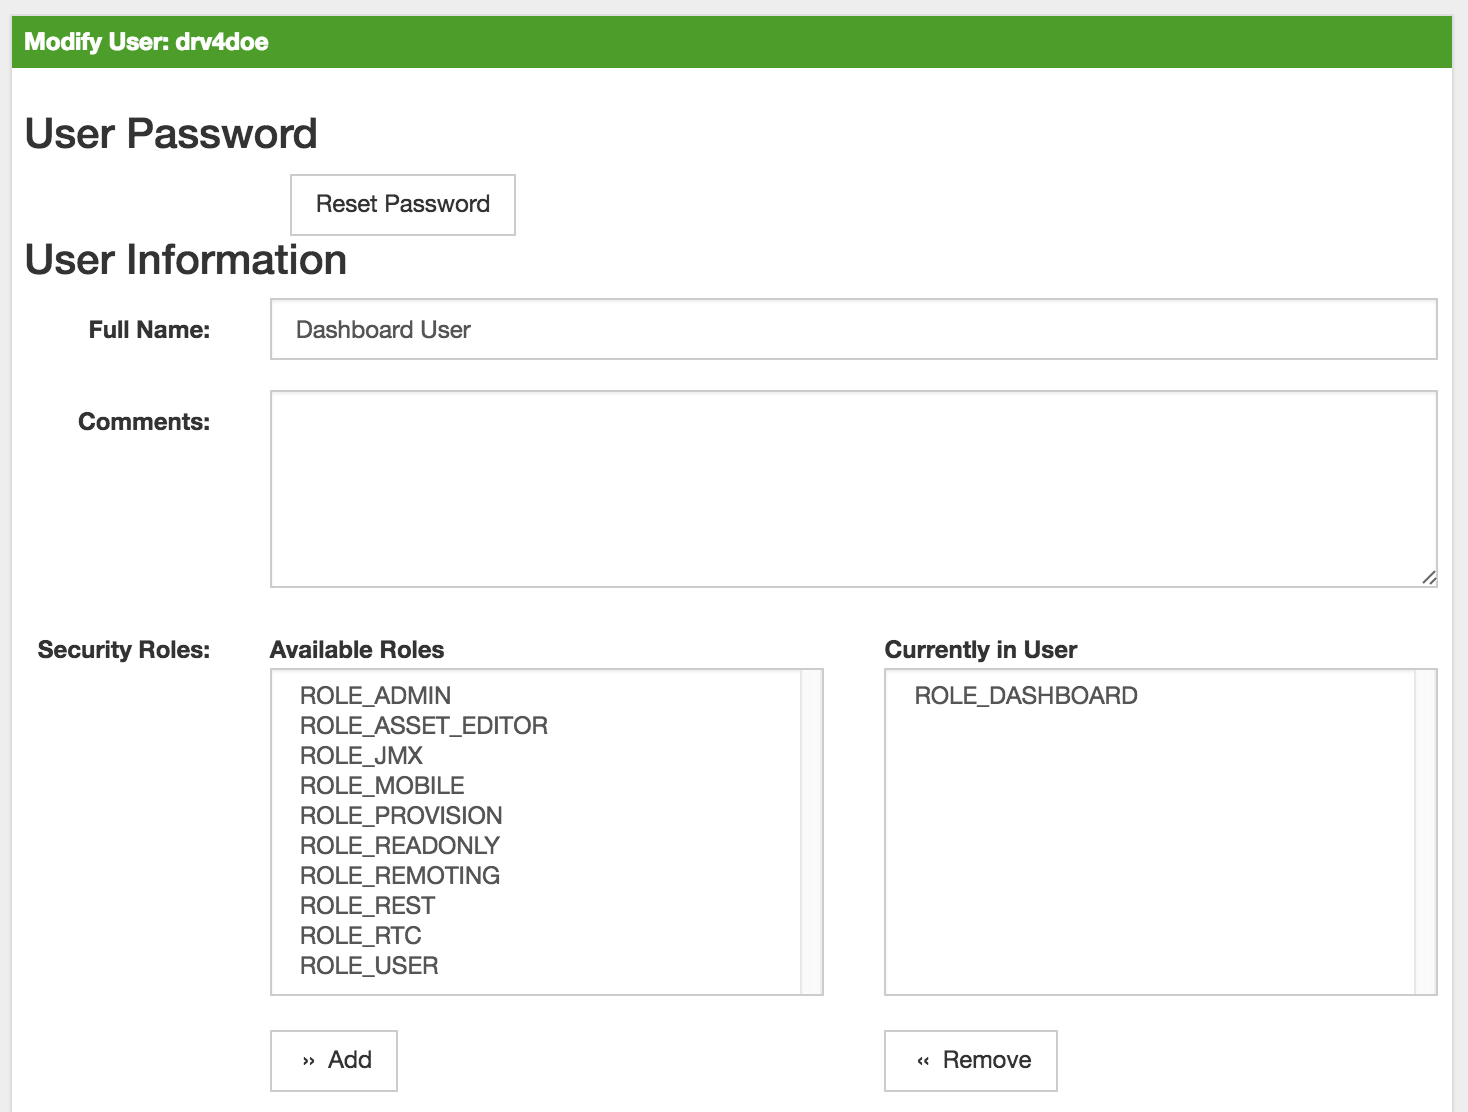
drv4doe using the OpenNMS Horizon WebUI<user>
<user-id>drv4doe</user-id>
<full-name>Dashboard User</full-name>
<password salt="true">6FOip6hgZsUwDhdzdPUVV5UhkSxdbZTlq8M5LXWG5586eDPa7BFizirjXEfV/srK</password>
<role>ROLE_DASHBOARD</role>
</user>Step 3: Define Surveillance View
Edit the $OPENNMS_HOME/etc/surveilliance-view.xml file to add a definition for the user drv4doe, which you created in step 1.
<?xml version="1.0" encoding="UTF-8"?>
<surveillance-view-configuration
  xmlns:this="http://www.opennms.org/xsd/config/surveillance-views"
  xmlns:xsi="http://www.w3.org/2001/XMLSchema-instance"
  xsi:schemaLocation="http://www.opennms.org/xsd/config/surveillance-views http://www.opennms.org/xsd/config/surveillance-views.xsd"
  default-view="default" >
  <views >
    <view name="drv4doe" refresh-seconds="300" >
      <rows>
        <row-def label="Servers" >
          <category name="Servers"/>
        </row-def>
      </rows>
      <columns>
        <column-def label="PROD" >
          <category name="Production" />
        </column-def>
        <column-def label="TEST" >
          <category name="Test" />
        </column-def>
      </columns>
    </view>
   <!-- default view here -->
    <view name="default" refresh-seconds="300" >
      <rows>
        <row-def label="Routers" >
          <category name="Routers"/>
        </row-def>
        <row-def label="Switches" >
          <category name="Switches" />
        </row-def>
        <row-def label="Servers" >
          <category name="Servers" />
        </row-def>
      </rows>
      <columns>
        <column-def label="PROD" >
          <category name="Production" />
        </column-def>
        <column-def label="TEST" >
          <category name="Test" />
        </column-def>
        <column-def label="DEV" >
          <category name="Development" />
        </column-def>
      </columns>
    </view>
  </views>
</surveillance-view-configuration>
This configuration and proper assignment of node categories will produce a default Dashboard for all users, other than drv4doe.
You can hide the upper navigation on any page by specifying ?quiet=true; adding it to the end of the OpenNMS Horizon URL.
This is very handy when using the dashboard on a large monitor or tv screen for office wide viewing.
|
However, when logging in as drv4doe, the user is taking directly to the Dashboard page and is presented with a Dashboard based on the custom Surveillance View definition.
The drv4doe user is not allowed to navigate to URLs other than the dashboard.jsp URL.
Doing so will result in an Access Denied error.
|
3.2.2. Anonymous dashboards
You can modify the configuration files for the security framework to give you access to one or more dashboards without logging in.
At the end you’ll be able to point a browser at a special URL like http://…/opennms/dashboard1 or http://…/opennms/dashboard2 and see a dashboard without any authentication.
First, configure surveillance views and create dashboard users as above.
For example, make two dashboards and two users called dashboard1 and dashboard2.
Test that you can log in as each of the new users and see the correct dashboard.
Now create some aliases you can use to distinguish between dashboards.
In /opt/opennms/jetty-webapps/opennms/WEB-INF, edit web.xml.
Just before the first <servlet-mapping> tag, add the following servlet entries:
  <servlet>
       <servlet-name>dashboard1</servlet-name>
       <jsp-file>/dashboard.jsp</jsp-file>
  </servlet>

  <servlet>
       <servlet-name>dashboard2</servlet-name>
       <jsp-file>/dashboard.jsp</jsp-file>
  </servlet>
Just before the first <error-page> tag, add the following servlet-mapping entries:
  <servlet-mapping>
       <servlet-name>dashboard1</servlet-name>
       <url-pattern>/dashboard1</url-pattern>
  </servlet-mapping>

  <servlet-mapping>
       <servlet-name>dashboard2</servlet-name>
       <url-pattern>/dashboard2</url-pattern>
  </servlet-mapping>
After the last <filter-mapping> tag, add the following filter-mapping entries:
  <filter-mapping>
    <filter-name>AddRefreshHeader-120</filter-name>
    <url-pattern>/dashboard.jsp</url-pattern>
  </filter-mapping>
  <filter-mapping>
    <filter-name>AddRefreshHeader-120</filter-name>
    <url-pattern>/dashboard1</url-pattern>
  </filter-mapping>
  <filter-mapping>
    <filter-name>AddRefreshHeader-120</filter-name>
    <url-pattern>/dashboard2</url-pattern>
  </filter-mapping>
Next edit applicationContext-acegi-security.xml to enable anonymous authentication for the /dashboard1 and /dashboard2 aliases.
Near the top of the file, find <bean id="filterChainProxy" …>.
Below the entry for /rss.jsp*, add an entry for each of the dashboard aliases:
  <bean id="filterChainProxy" class="org.acegisecurity.util.FilterChainProxy">
    <property name="filterInvocationDefinitionSource">
      <value>
        CONVERT_URL_TO_LOWERCASE_BEFORE_COMPARISON
        PATTERN_TYPE_APACHE_ANT
        /rss.jsp*=httpSessionContextIntegrationFilter,logoutFilter,authenticationProcessingFilter,basicProcessingFilter,securityContextHolderAwareRequestFilter,anonymousProcessingFilter,basicExceptionTranslationFilter,filterInvocationInterceptor
        /dashboard1*=httpSessionContextIntegrationFilter,logoutFilter,securityContextHolderAwareRequestFilter,dash1AnonymousProcessingFilter,filterInvocationInterceptor
        /dashboard2*=httpSessionContextIntegrationFilter,logoutFilter,securityContextHolderAwareRequestFilter,dash2AnonymousProcessingFilter,filterInvocationInterceptor
        /**=httpSessionContextIntegrationFilter,logoutFilter,authenticationProcessingFilter,basicProcessingFilter,securityContextHolderAwareRequestFilter,anonymousProcessingFilter,exceptionTranslationFilter,filterInvocationInterceptor

...
About halfway through the file, look for <bean id="filterInvocationInterceptor" …>.
Below the entry for /dashboard.jsp, add an entry for each of the aliases:
  <bean id="filterInvocationInterceptor" class="org.acegisecurity.intercept.web.FilterSecurityInterceptor">

...

        /frontpage.htm=ROLE_USER,ROLE_DASHBOARD
        /dashboard.jsp=ROLE_USER,ROLE_DASHBOARD
        /dashboard1=ROLE_USER,ROLE_DASHBOARD
        /dashboard2=ROLE_USER,ROLE_DASHBOARD
        /gwt.js=ROLE_USER,ROLE_DASHBOARD

...
Finally, near the bottom of the page, add a new instance of AnonymousProcessingFilter for each alias.
  <!-- Set the anonymous username to dashboard1 so the dashboard page
       can match it to a surveillance view of the same name. -->
  <bean id="dash1AnonymousProcessingFilter" class="org.acegisecurity.providers.anonymous.AnonymousProcessingFilter">
    <property name="key"><value>foobar</value></property>
    <property name="userAttribute"><value>dashboard1,ROLE_DASHBOARD</value></property>
  </bean>

  <bean id="dash2AnonymousProcessingFilter" class="org.acegisecurity.providers.anonymous.AnonymousProcessingFilter">
    <property name="key"><value>foobar</value></property>
    <property name="userAttribute"><value>dashboard2,ROLE_DASHBOARD</value></property>
  </bean>
Restart OpenNMS Horizon and you should bring up a dashboard at http://…/opennms/dashboard1 without logging in.
| There’s no way to switch dashboards without closing the browser (or deleting the JSESSIONID session cookie). |
If you accidentally click a link that requires full user privileges (e.g. Node List), you’ll be given a login form.
Once you get to the login form, there’s no going back to the dashboard without restarting the browser.
If this problem bothers you, you can set ROLE_USER in addition to ROLE_DASHBOARD in your userAttribute property.
However this will give full user access to anonymous browsers.
|
4. Business Service Monitoring
While OpenNMS detects issues in your network by device, interface or service, the Business Service Monitoring (BSM) takes it one step further. The BSM components allows you to monitor and model high level Business Services (BS) and helps quickly identify the most critical problems affecting these. With the BSM feature it is possible to model a high level BS context around the technical Service Monitors provided in OpenNMS. To indicate which BS is effected an Operational Status is calculated.
As an example, let’s assume a company runs an online store. Customers enter through a login system, select items, place them in the shopping cart and checkout using a payment system. The whole service is provided by a few web servers and access data from databases. To monitor the status of the databases, a SQL service monitor on each database server is configured. For testing the web servers a HTTP service monitor is used for each of them. Covering the overall functionality a Page Sequence Monitor (PSM) is used to test the login, shop and payment workflow through the provided web portal. A possible representation of the whole system hierarchy is shown in figure Example scenario for a web shop.
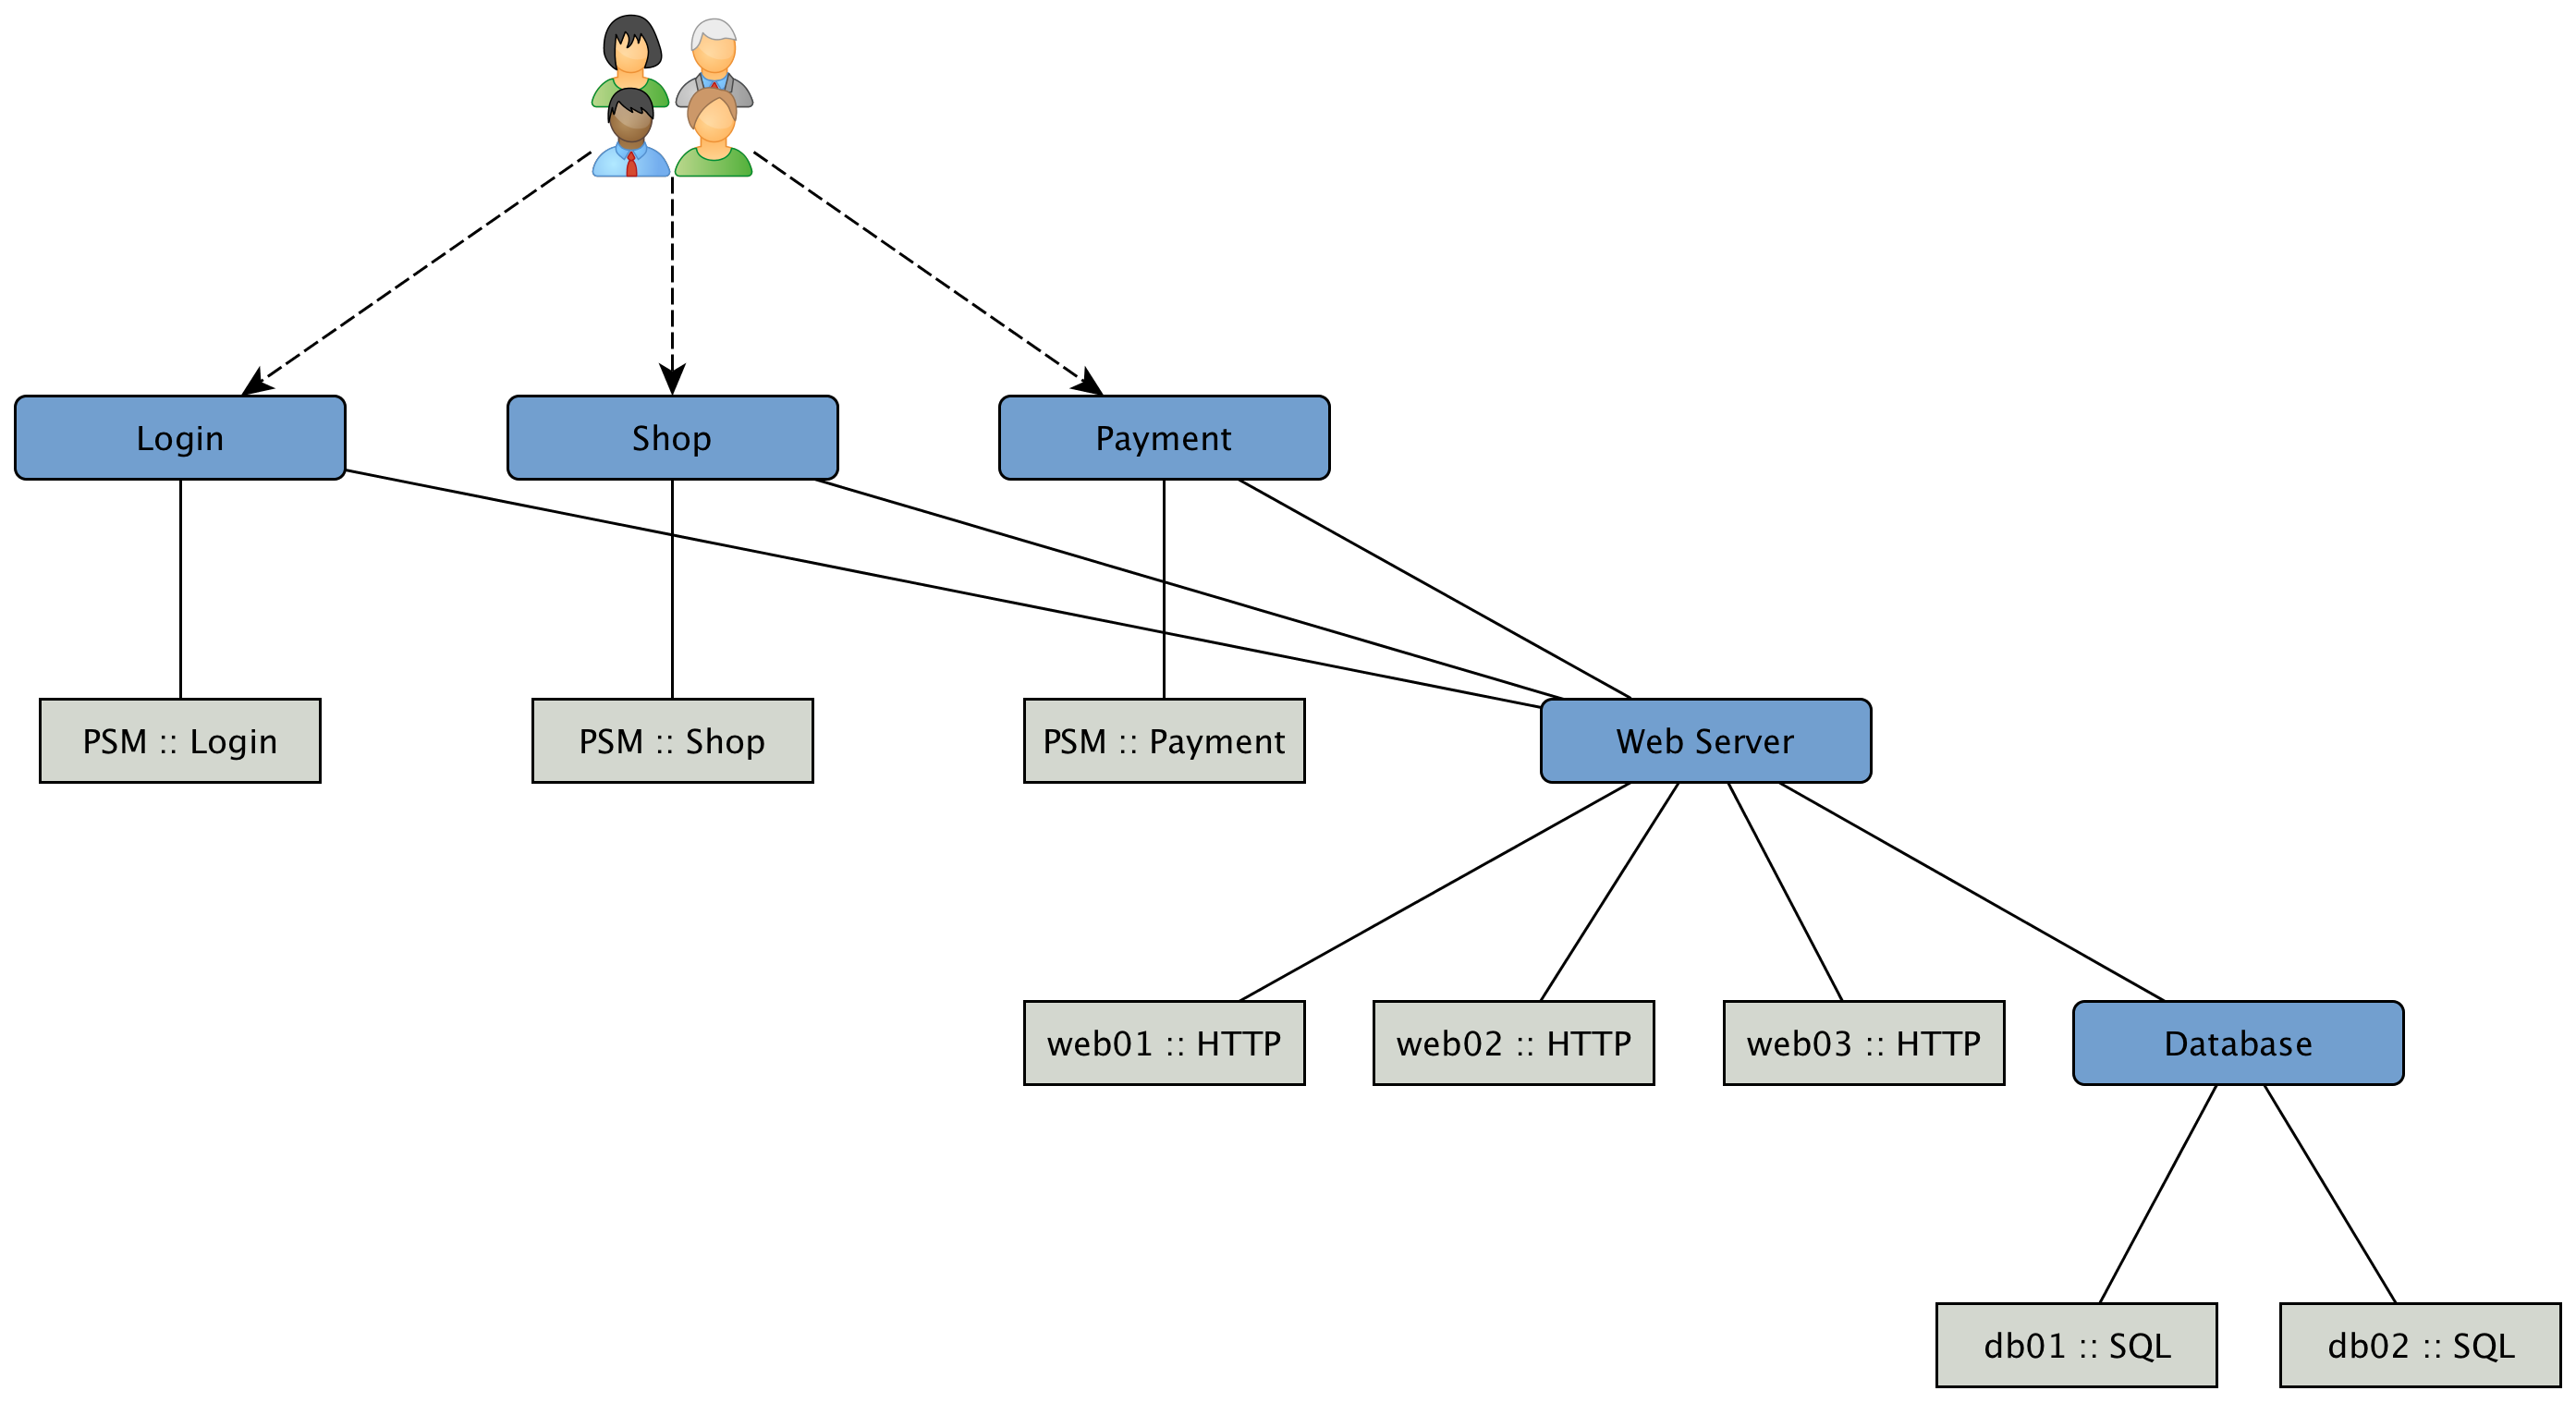
To be able to model this scenarios the BSM functions can be used. The following section describes the components, concepts and functions. For configuration and changing the behavior please go to the section Business Service Monitoring in the Administration Guide.
4.1. Business Service Hierarchy
BS can depend on each other and build together a Business Service Hierarchy. It can be visualized using the Topology User Interface with the Business Services View. The Operational Status of a BS is ultimately calculated from Alarms and their Severity. To define the class of Alarms a Reduction Key is used and is represented as an Edge of a BS. Giving more granularity than just Up or Down, the Operational Status uses the Severities, i.e. Normal, Warning, Minor, Major, Critical.
Based on the hierarchy, the Operational Status is calculated with Map and Reduce Functions. A Map Function influences which Severity from the Edge is used as an input to the BS. A Reduce Function is used to consolidate the Severities from all Edges of a BS and uses them as inputs and reduces them into a single Severity, which is the Operational Status.
The Topology User Interface allows users to traverse Business Service Hierarchies using the Semantic Zoom Level (SZL). The Semantic Zoom Level (SZL, pronounced as 'sizzle') defines how many Neighbors are shown related to the elements which are in Focus. The number can be interpreted as how many Hops from the Focus should be shown on the Topology User Interface.
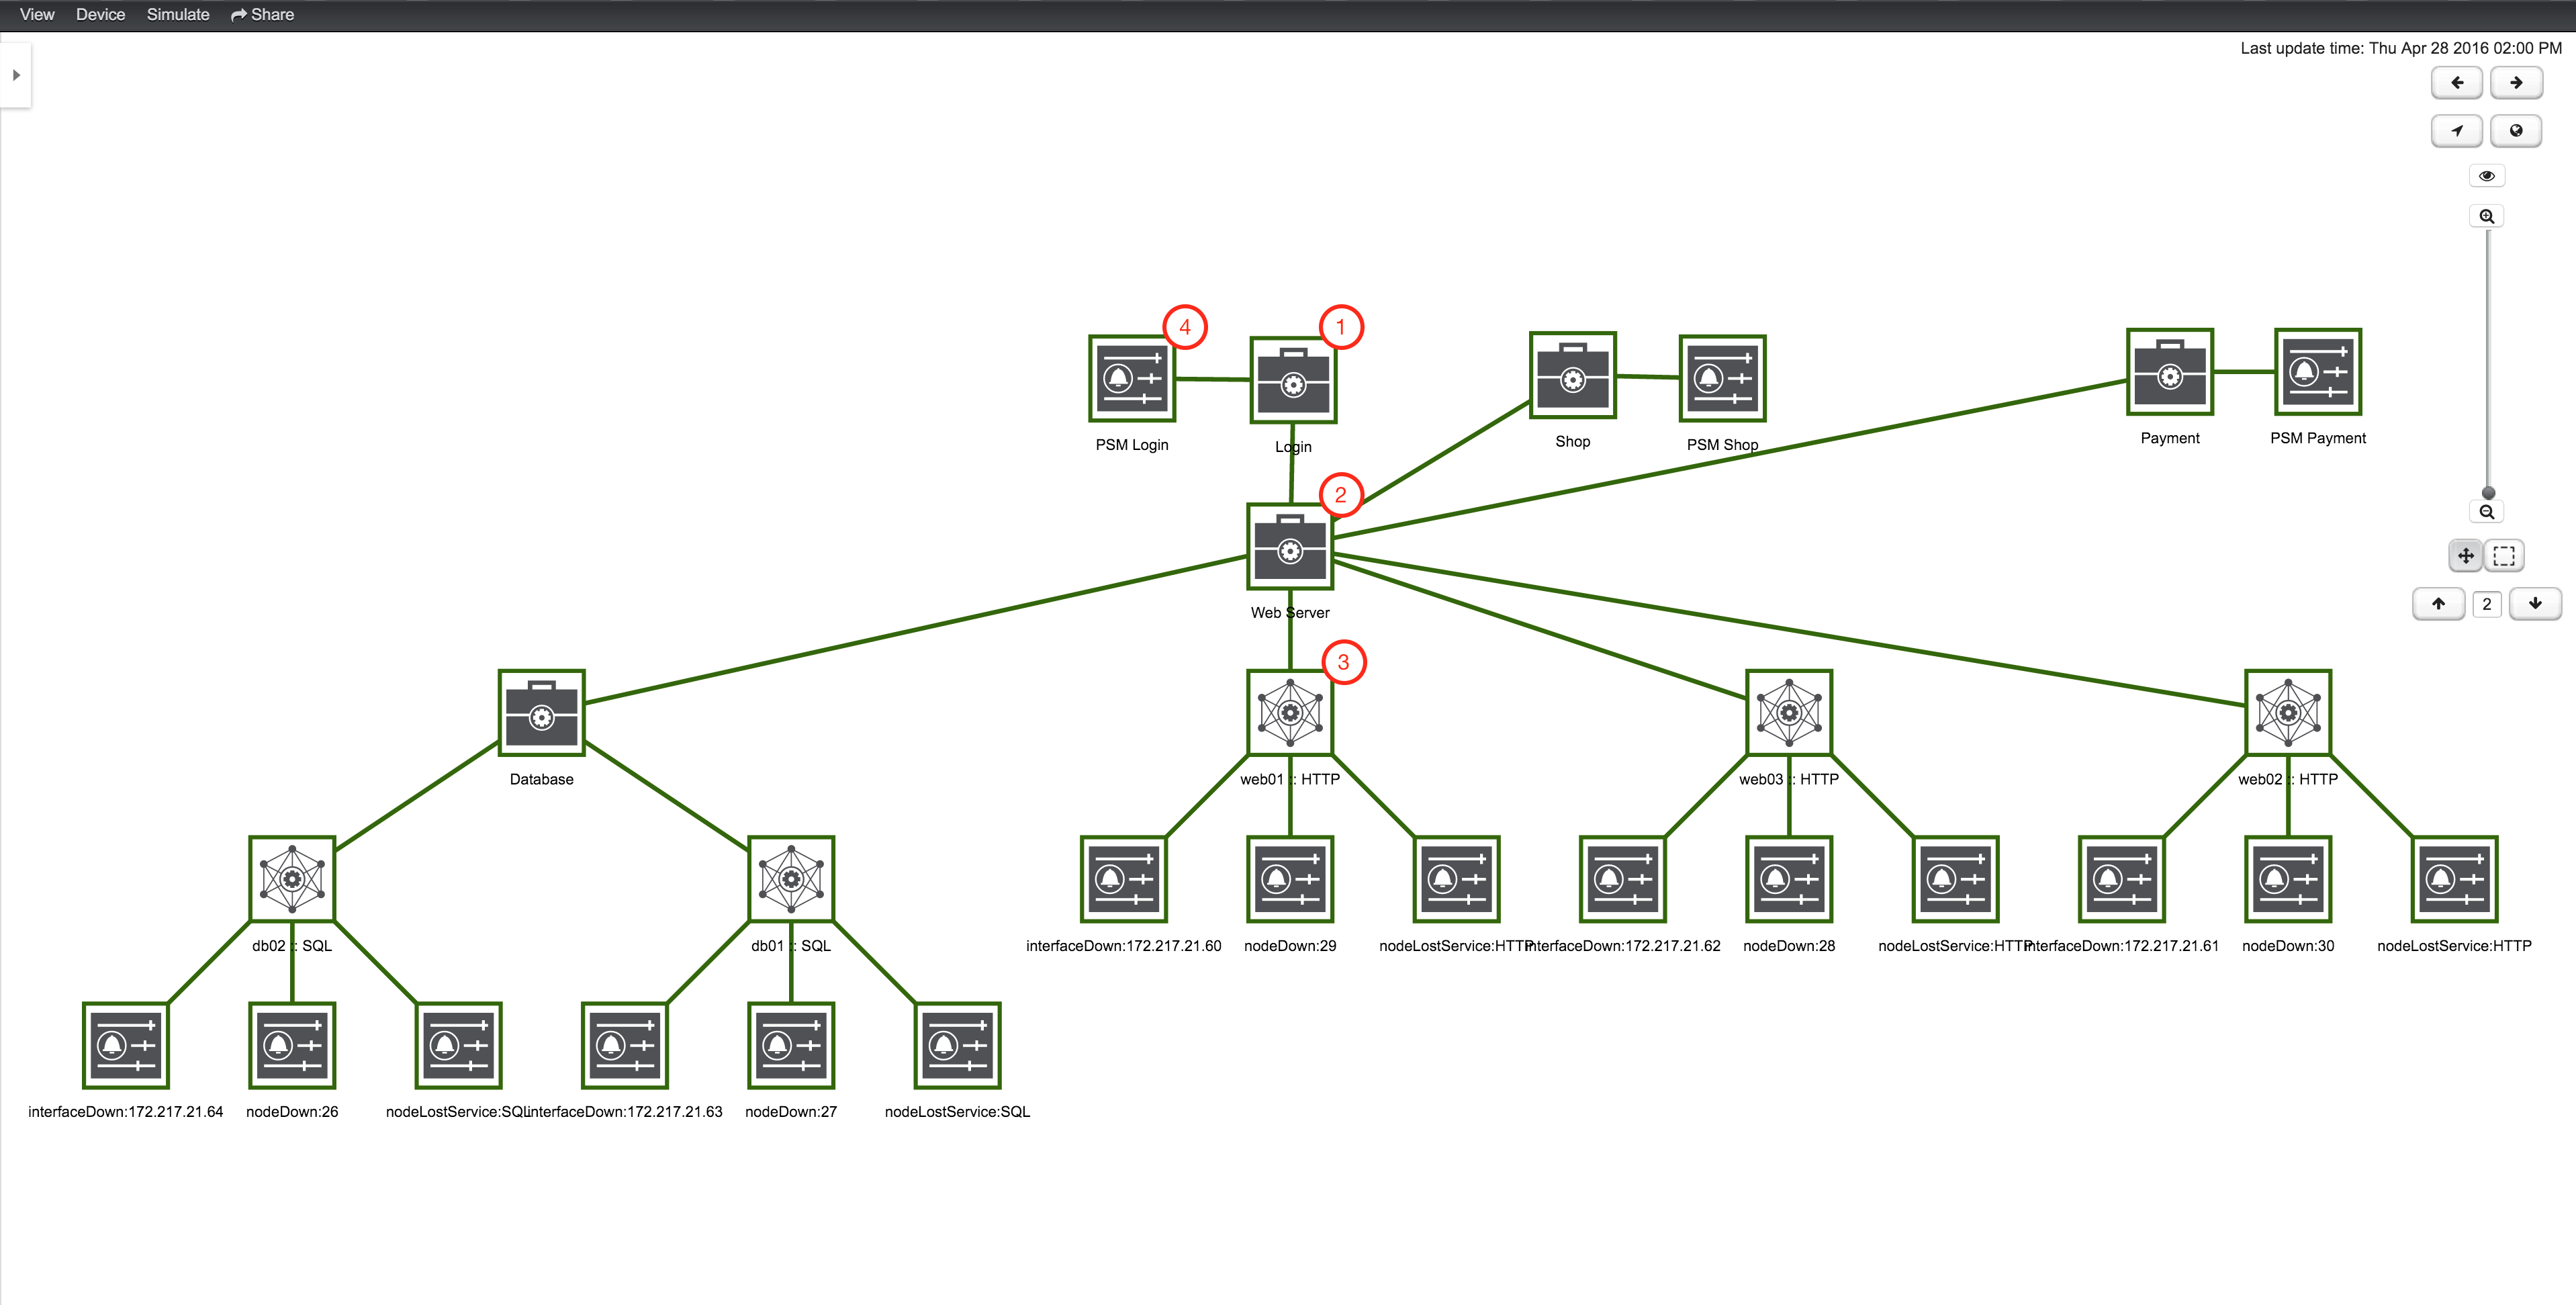
| 1 | A top-level Business Service which depends on other Business Services, Monitored Services and Alarms (referenced by Reduction Key) |
| 2 | Business Service as child an the Operational Status is used as input for the top-level Business Service |
| 3 | IP Service Edge used as an input with auto generated Reduction Keys for node down, interface down and node lost service |
| 4 | Reduction Key Edge used as an input to the top-level BS, which references just a node lost service of a Page Sequence Monitor for the user login |
To add or remove an additional selected BS or Edge to Focus use in the context menu Add To Focus or Remove From Focus. If you want to have a specific _BS or Edge as a single focus use Set as Focal Point. The Eye icon highlights all elements in the Topology UI which are set to Focus.
4.2. Operational status
Every Business Service maintains an Operational Status that represents the overall status calculated by the Map and Reduce Functions from the Edges. The Operational Status uses the Severities known from Events and Alarms.
| Name | Numerical code | Color / Code | Description |
|---|---|---|---|
|
7 |
Purple / |
This event means that a severe service affecting event has occurred. |
|
6 |
Red / |
Indicates serious disruption or malfunction of a service or system. |
|
5 |
Orange / |
Used for troubles that have not immediate effect on service or system performance. |
|
4 |
Yellow / |
An event has occurred that may require action. This severity can also be used to indicate a condition that should be noted (logged) but does not require immediate action. |
|
3 |
Dark green / |
Informational message. No action required. |
|
2 |
Grey / |
This severity is reserved for use in alarms to indicate that an alarm describes a self-clearing error condition has been corrected and service is restored. This severity should never be used in event definitions. Please use "Normal" severity for events that clear an alarm. |
|
1 |
Light green / |
No Severity could be associated with this event. |
If a Business Service changes its Operational Status an OpenNMS event of the type uei.opennms.org/bsm/serviceOperationalStatusChanged is generated and sent to the OpenNMS Event Bus.
In case the Operational Status changed from Normal to a higher Severity an Event of the type uei.opennms.org/bsm/serviceProblem is generated and has the Severity of the BS.
When the BS goes back to normal a Event of the type uei.opennms.org/bsm/serviceProblemResolved is generated.
| The Service Problem and Service Problem Resolved events can be used for notifications or ticketing integration. |
The log message of the events have the following information:
-
Business Service Name:
businessServiceName -
Business Service Identifier:
id -
Previous Severity Identifier:
prevSeverityId -
Previous Severity Label:
prevSeverityLabel -
New Severity Identifier:
newSeverityId -
New Severity Label:
newSeverityLabel
| The BSM events are not associated to a Node, Interface or Service. |
4.3. Root Cause and Impact Analysis
The Root Cause operation can be used to quickly identify the underlying Reduction Keys as Edges that contribute to the current Operational Status of an element. The Impact Analysis operation, converse to the Root Cause operation, can be used to identify all of the BS affected by a given element. Both of these options are available in the context menu of the Topology User Interface when visualizing BS.
The following example shows how to identify the Root Cause of the critical status of the Shop service. Use the Context Menu on the BS to investigate the Root Cause shown in figure View before performing Root Cause Analysis.
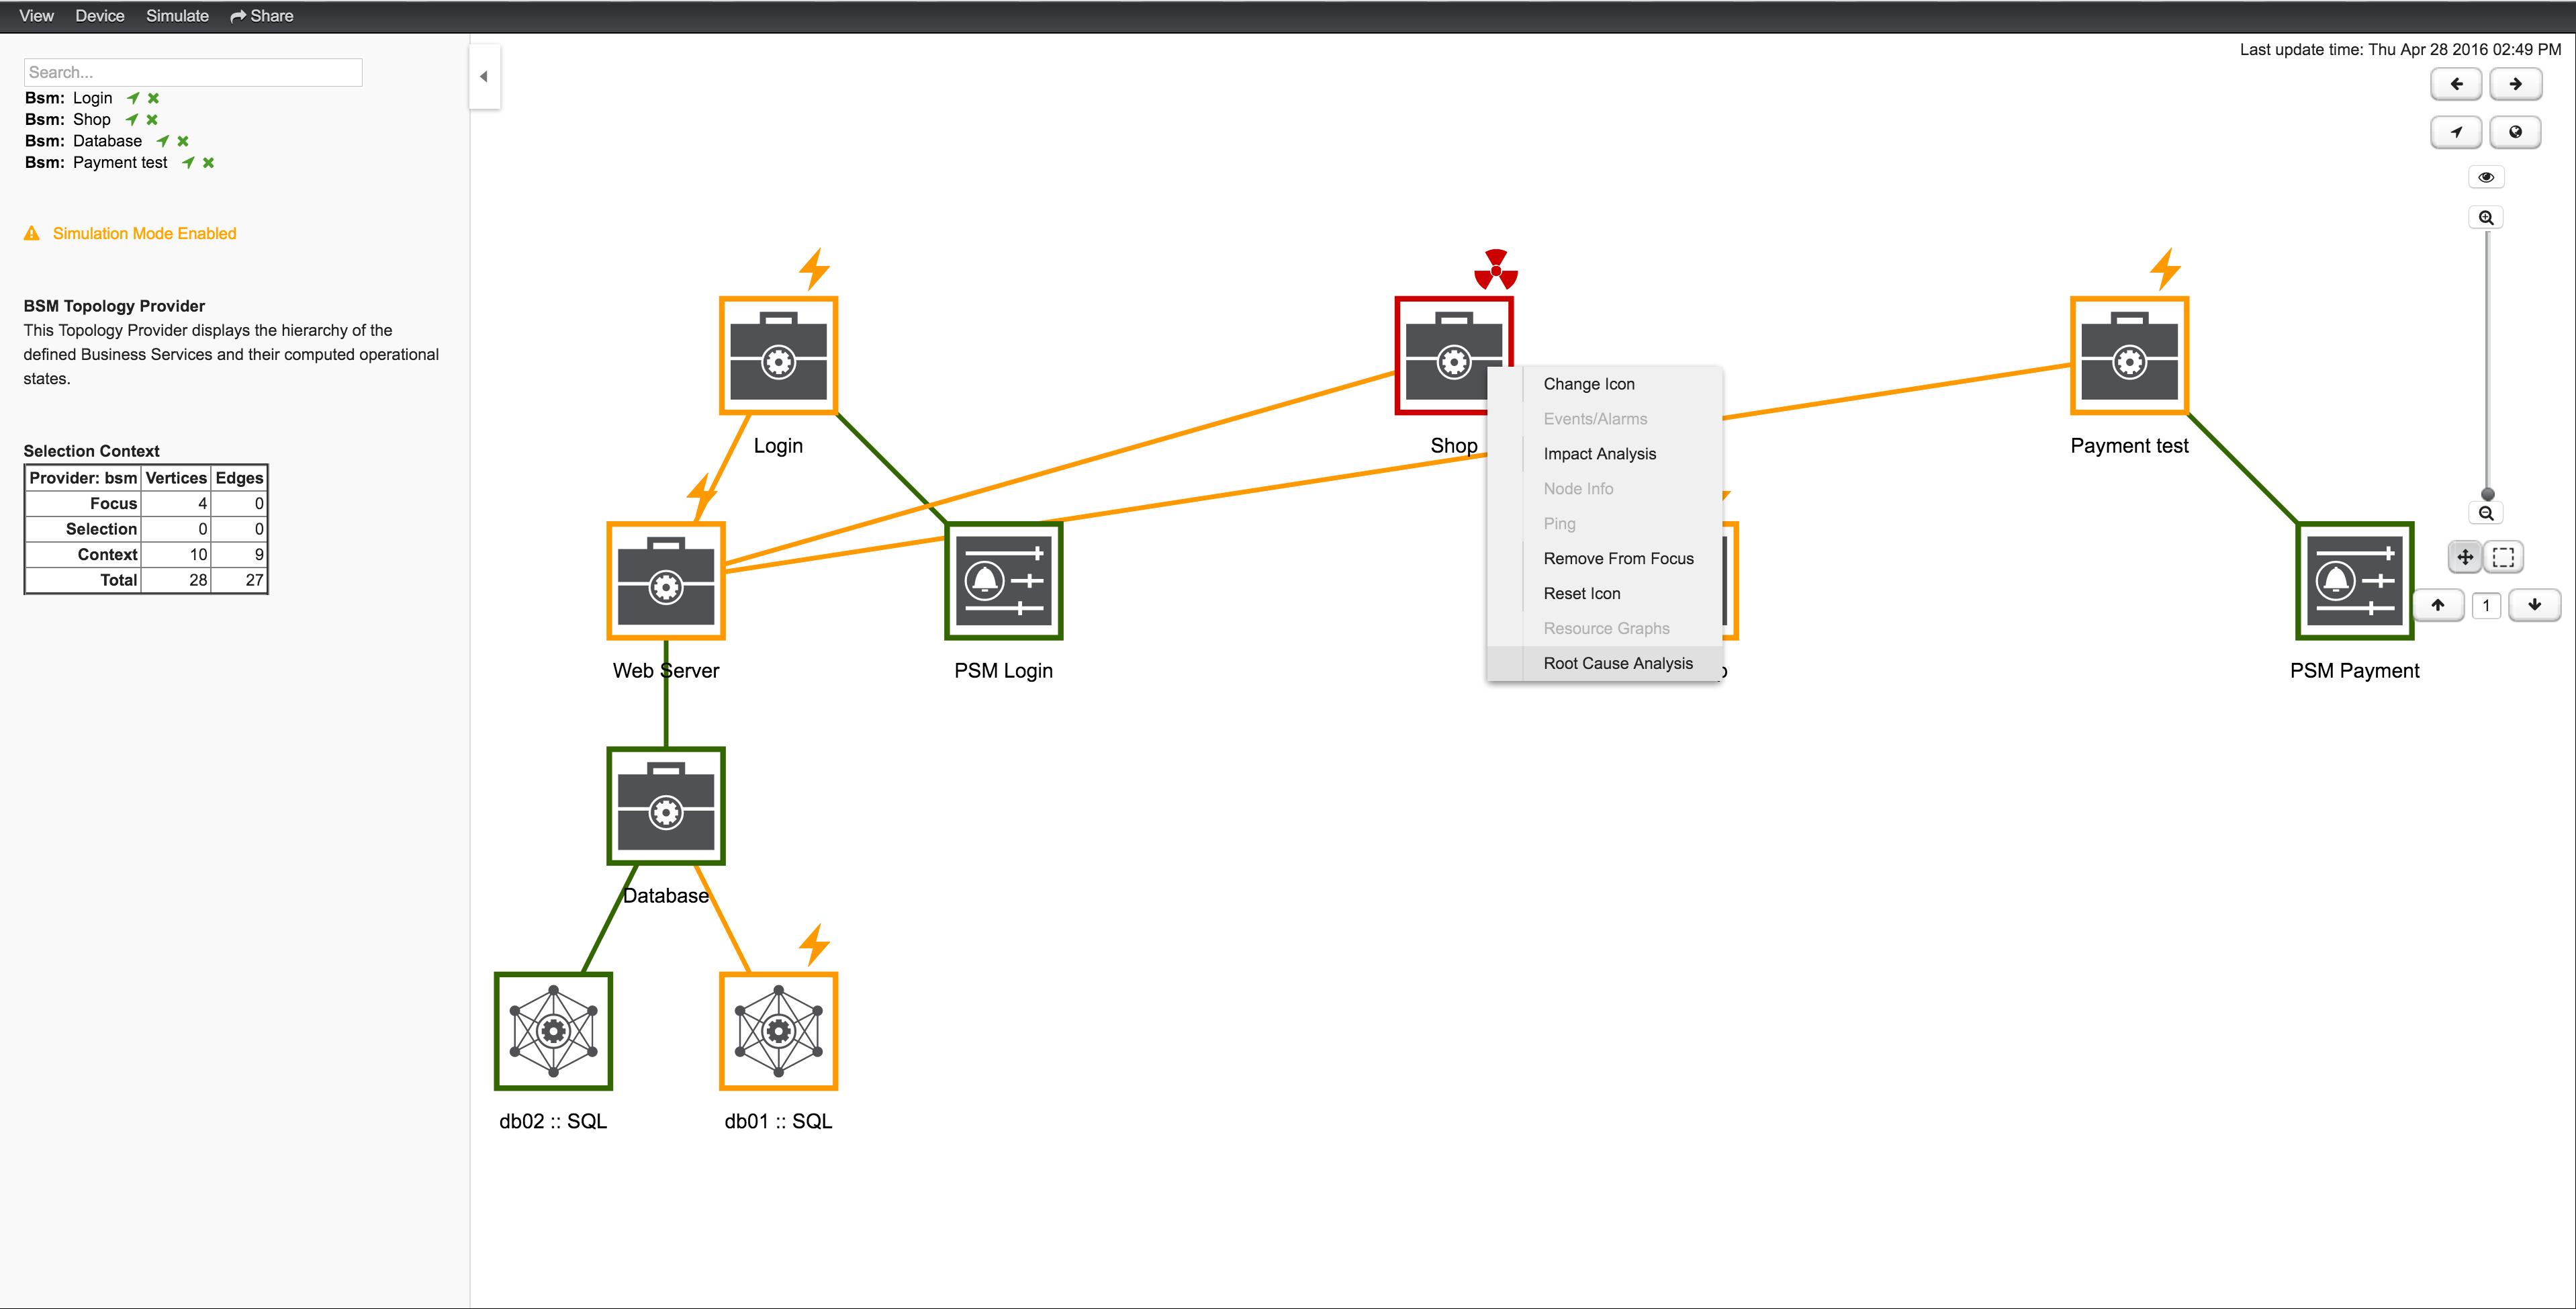
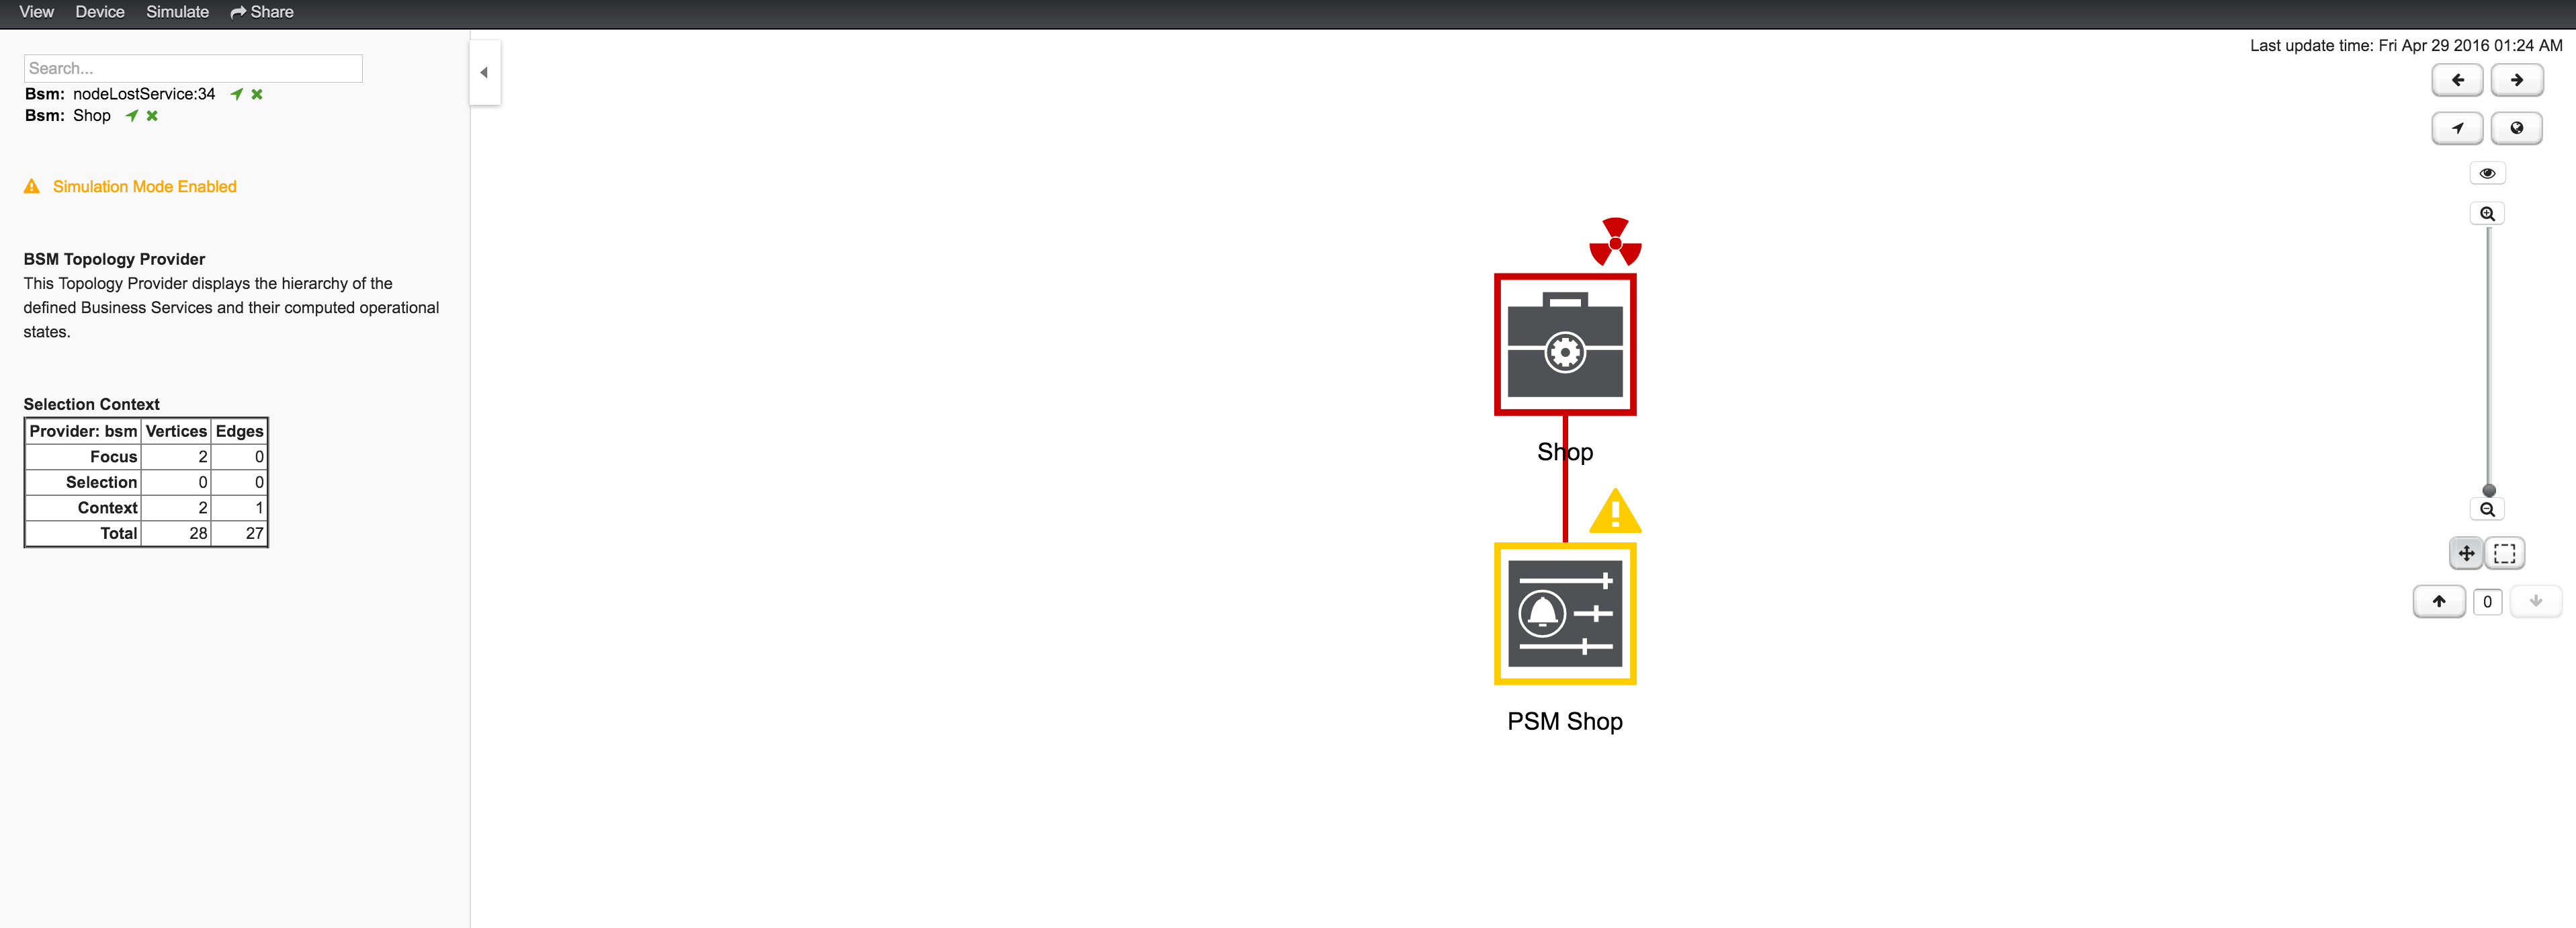
The Topology UI sets only elements to Focus which are the reason for the Operational Status of the selected BS. In figure View after performing Root Cause Analysis the Page Sequence Monitor which tests the user login is down and has set the BS to a critical status.
Similar to identifying a root cause for a BS it is also possible to identfy which Business Services from a specific Edge are affected. Use the Context Menu on a specific Edge element and select Impact Analysis shown in figure View before performing Impact Analysis.
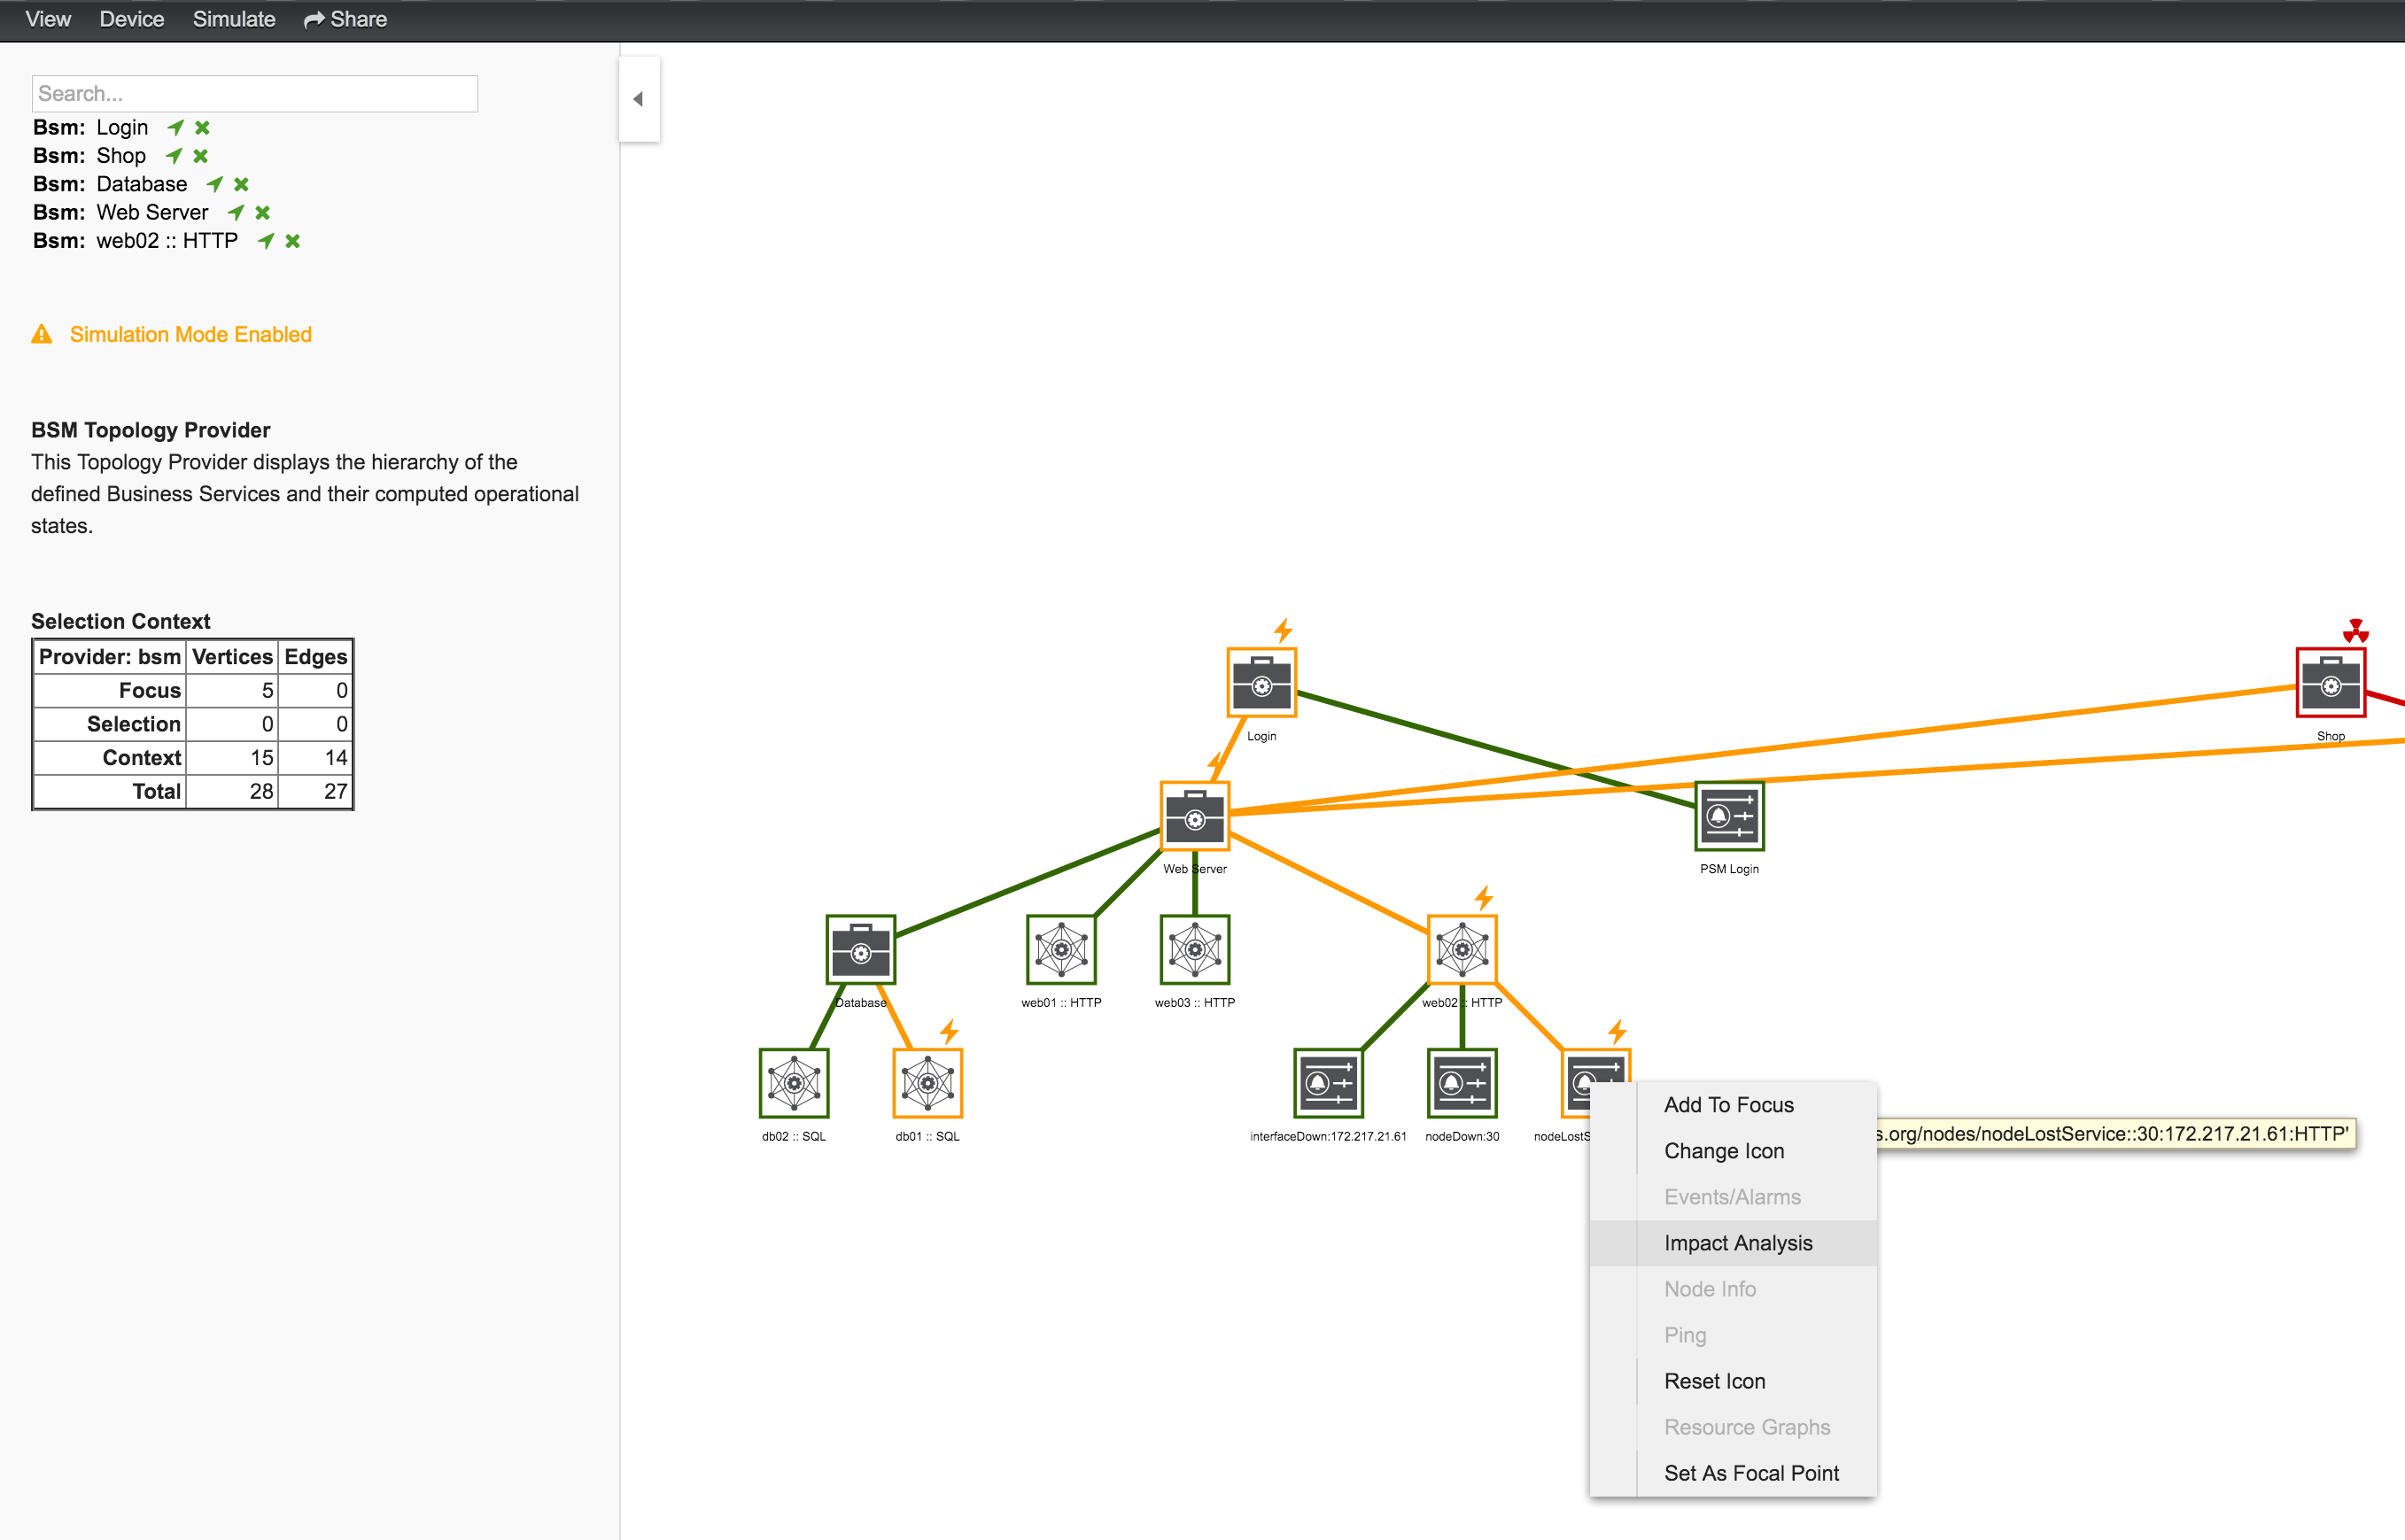
In figure View after performing Impact Analysis the Business Services for Login, Shop and Payment are affected if this HTTP service is unavailable.
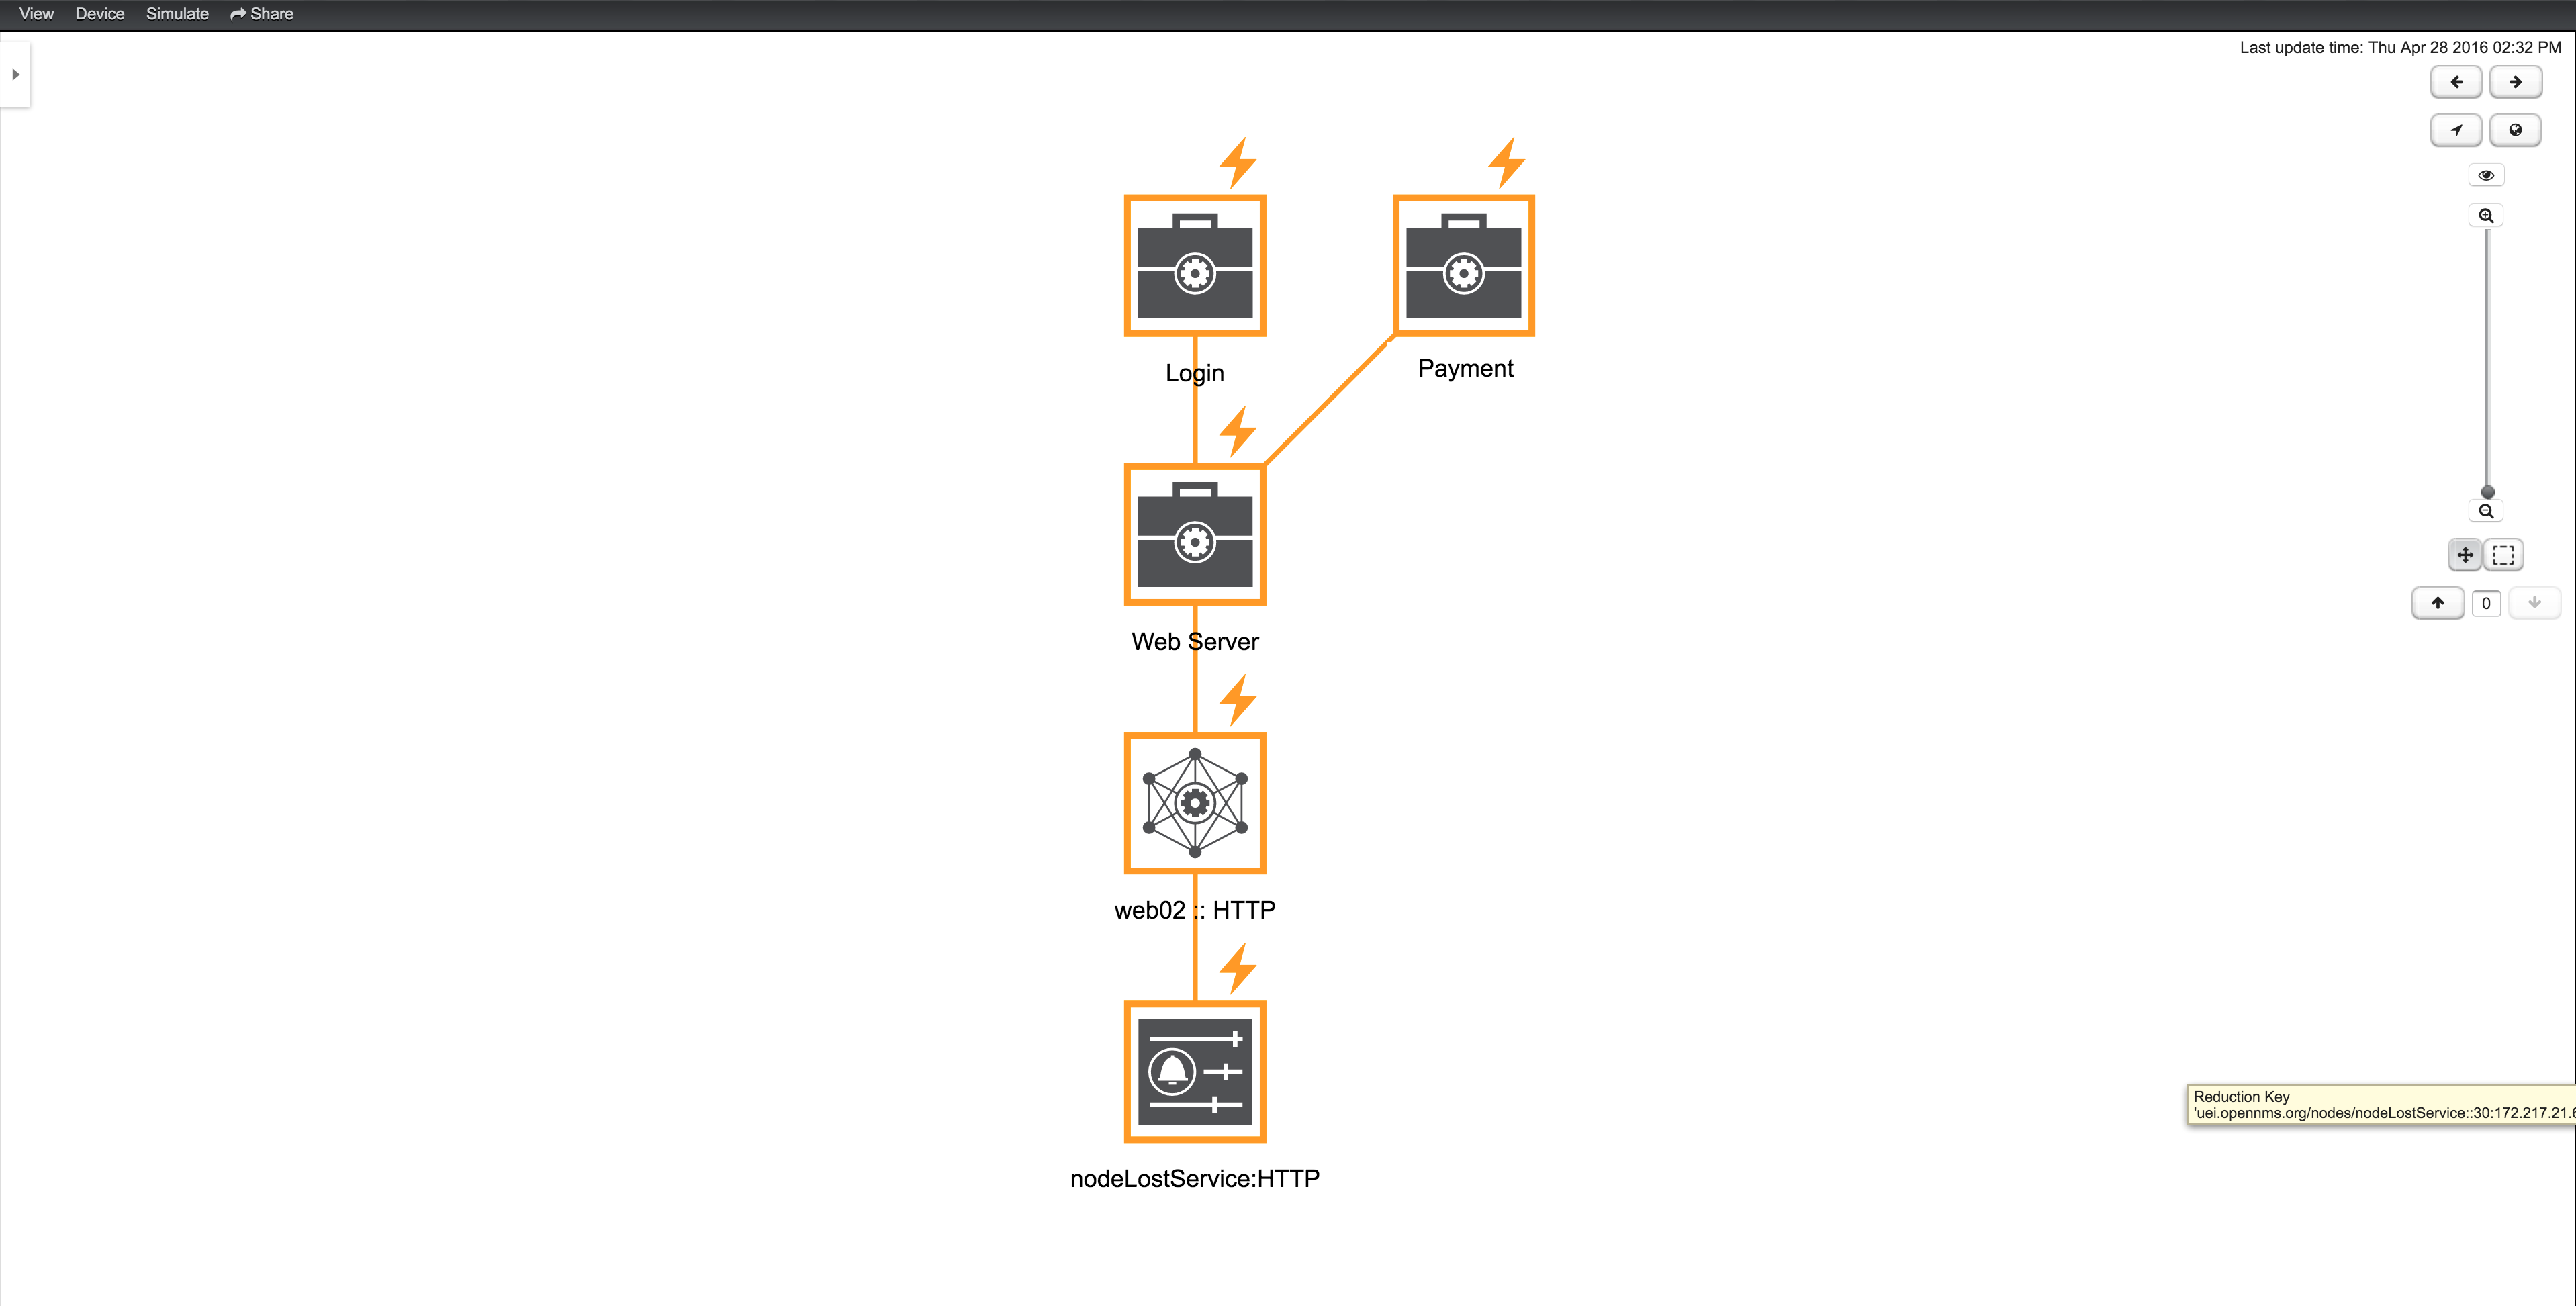
| For the reason the service PSM Shop is introducing the critical status for the Business Service Shop, the HTTP service has no impact on the Operational Status of the PSM Shop and is not shown. |
4.4. Simulation Mode
To visualize if the configured behavior works as expected, the Simulation Mode can be used to manually set an Alarm status of an Edge element. The Operational Status is calculated with the given Map and Reduce Functions. This allows users to validate and tune their Business Service Hierarchies until the desired status propagation is achieved.
In order to enter Simulation Mode, open the Business Service View in the Topology User Interface and toggle the Simulation Mode option in the Simulate menu at the top of the screen. The Info Panel on the left hand side allows to set the Severity of the selected Edge element. In figure BSM Simulation Mode the Menu and Severity setting is shown.
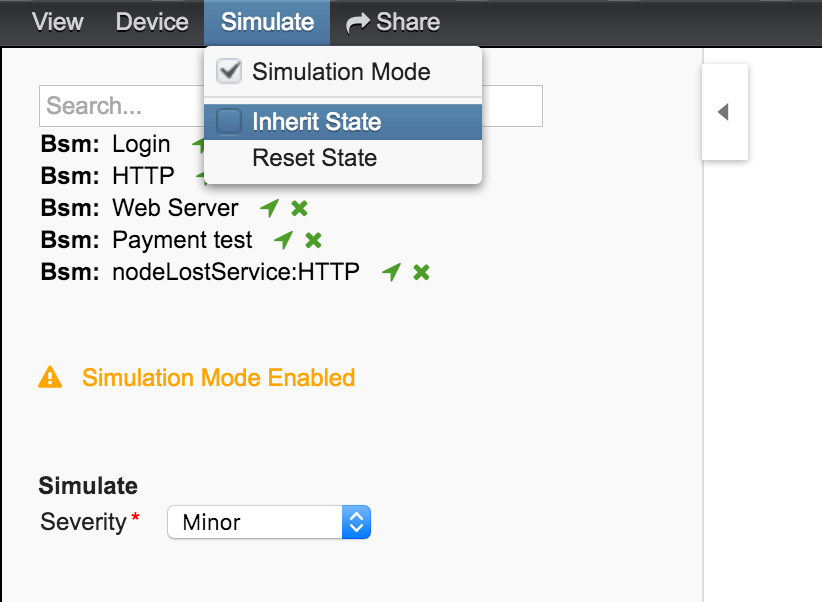
| The Info Panel can be hidden with the Arrow button in the top left corner. |
In the Simulate menu there are Inherite State and Reset State as options available. With Inherite State the current Severities and Operational Status from monitoring is used for the Simulation Mode. By selecting Reset State all states will be set to Normal for simulation.
4.5. Share View
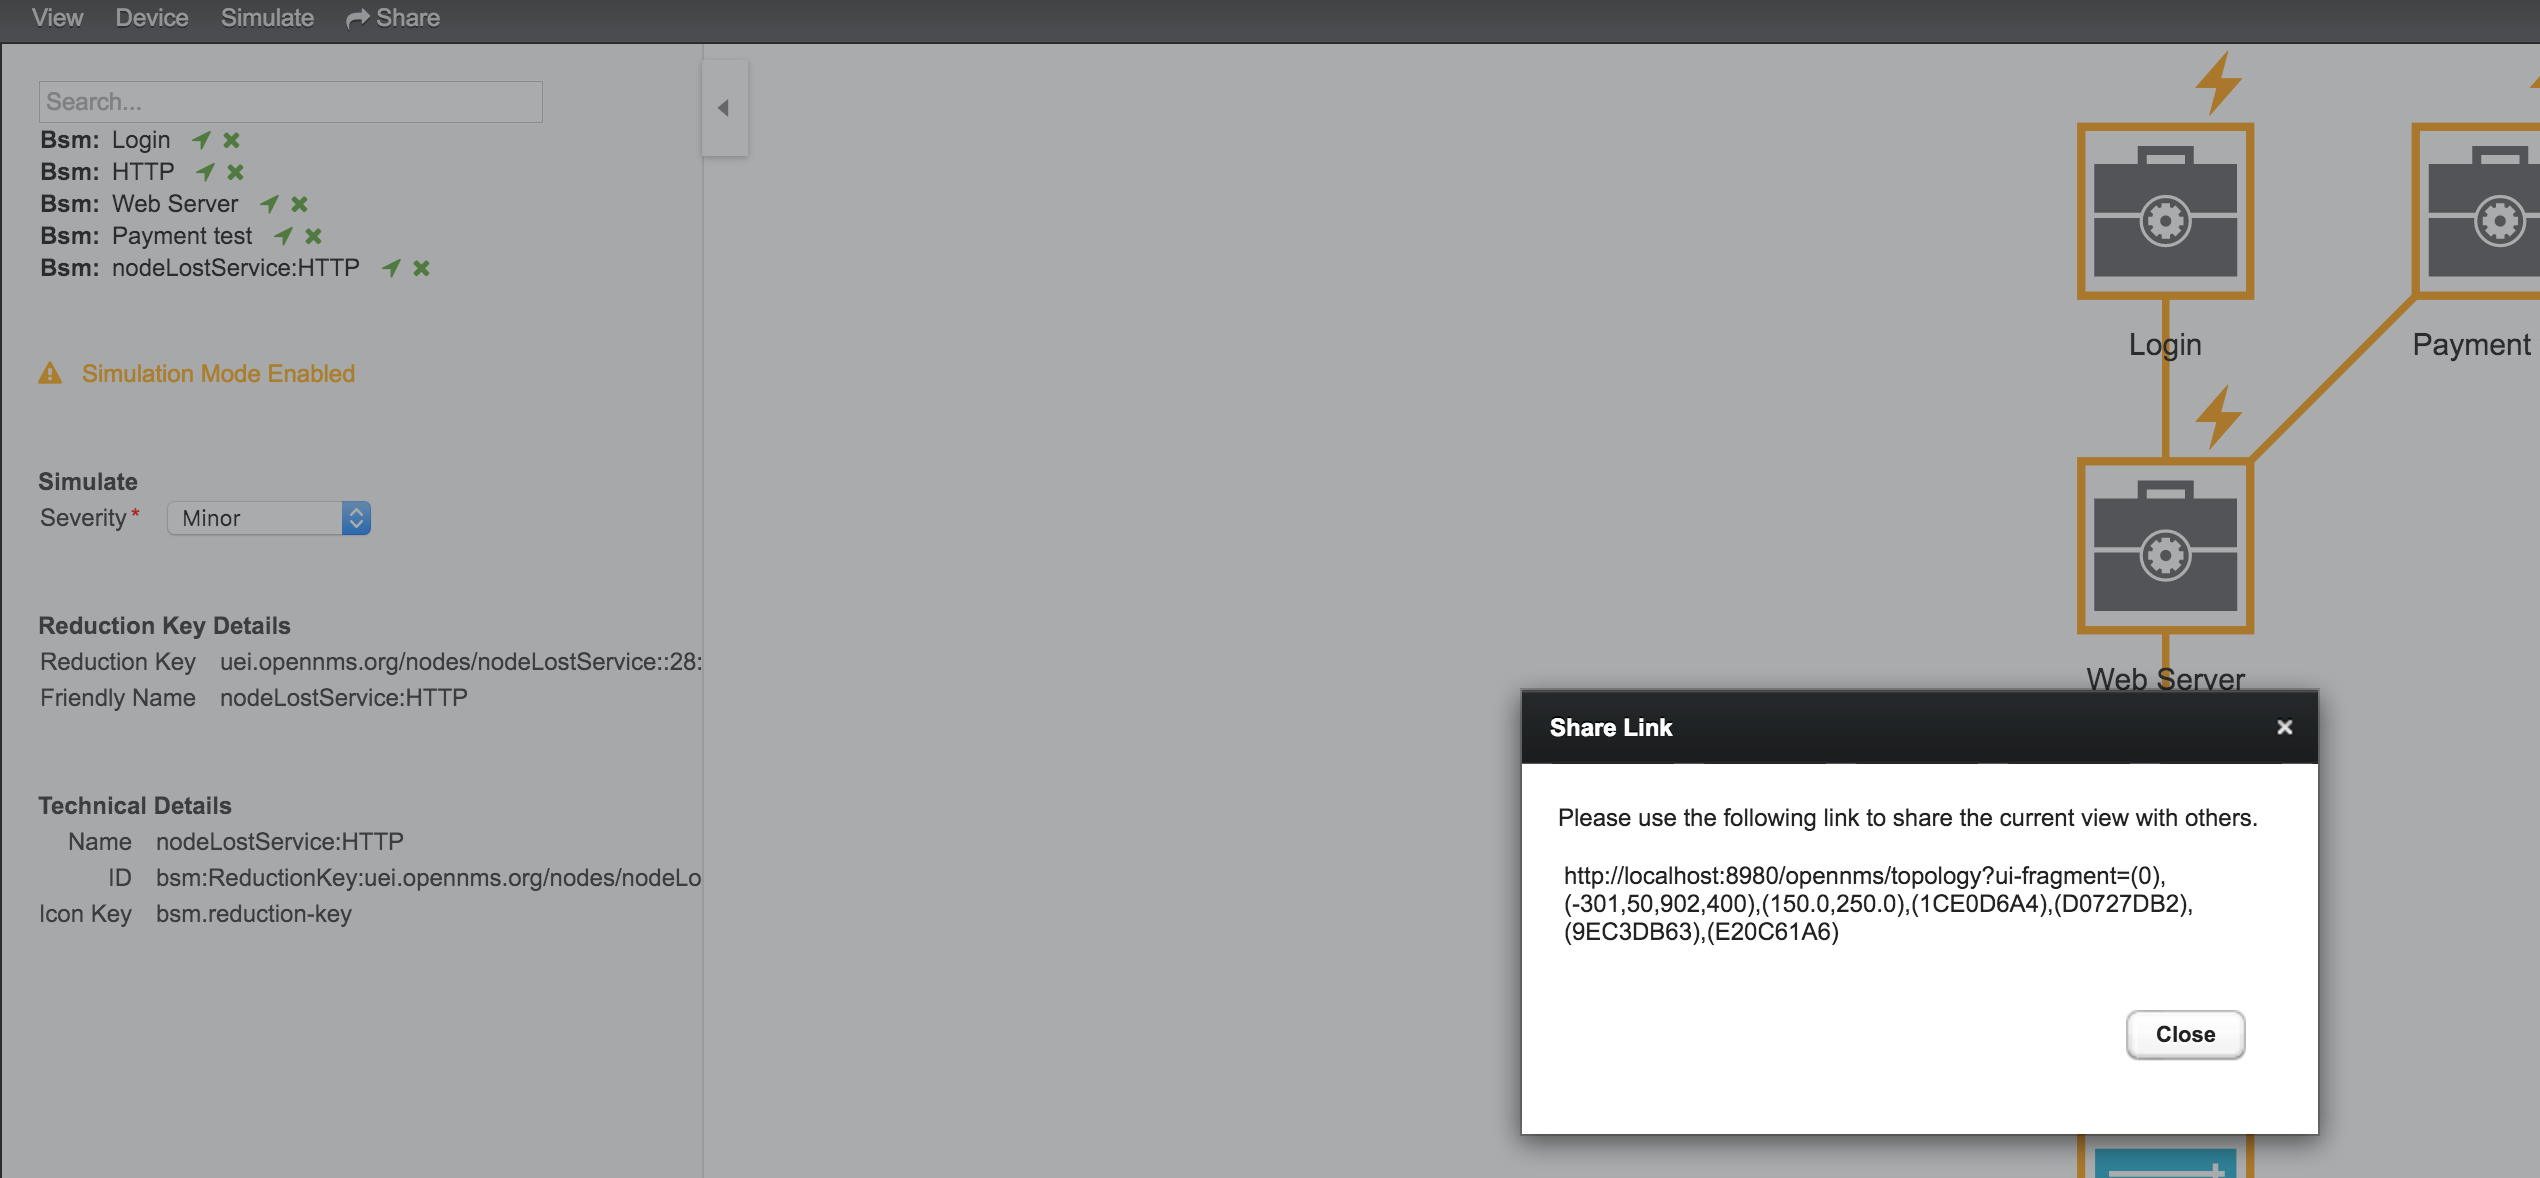
In some cases it is useful to share a specific view on a Business Service Hierarchy. For this reason the menu function Share can be used and generates a link for the current view and can be copied and sent to another user. In figure Share Business Service View the Share menu item was used and a link is generated. The link can be used with Copy & Paste and sent to another user to have access to exactly the same configured _Business Service View.
| The user receiving the link needs an account in OpenNMS to be able to see the Business Service View. |
4.6. Change Icons
Each element in the Business Service View has an icon which is assigned to a BS or an Edge. To be able to customize the Business Service View the icons for each element can be changed. Select the element in the Business Service View and choose Change Icon from the Context Menu. As shown in figure Change Icon for Business Service or Edges select the the new icon for the selected element and click Ok to permanently assign the new icon to the element.
![]()
It is also possible create custom Icon Sets which is described in the Business Service Monitoring section of the Developer Guide.
5. Alarms
5.1. Alarm Notes
OpenNMS Horizon creates an Alarm for issues in the network. Working with a few people in a team, it is helpful to share information about a current Alarm. Alarm Notes can be used to assign comments to a specific Alarm or a whole class of Alarms. . The figure Alarm Detail View shows the component to add these information in Memos to the Alarm.
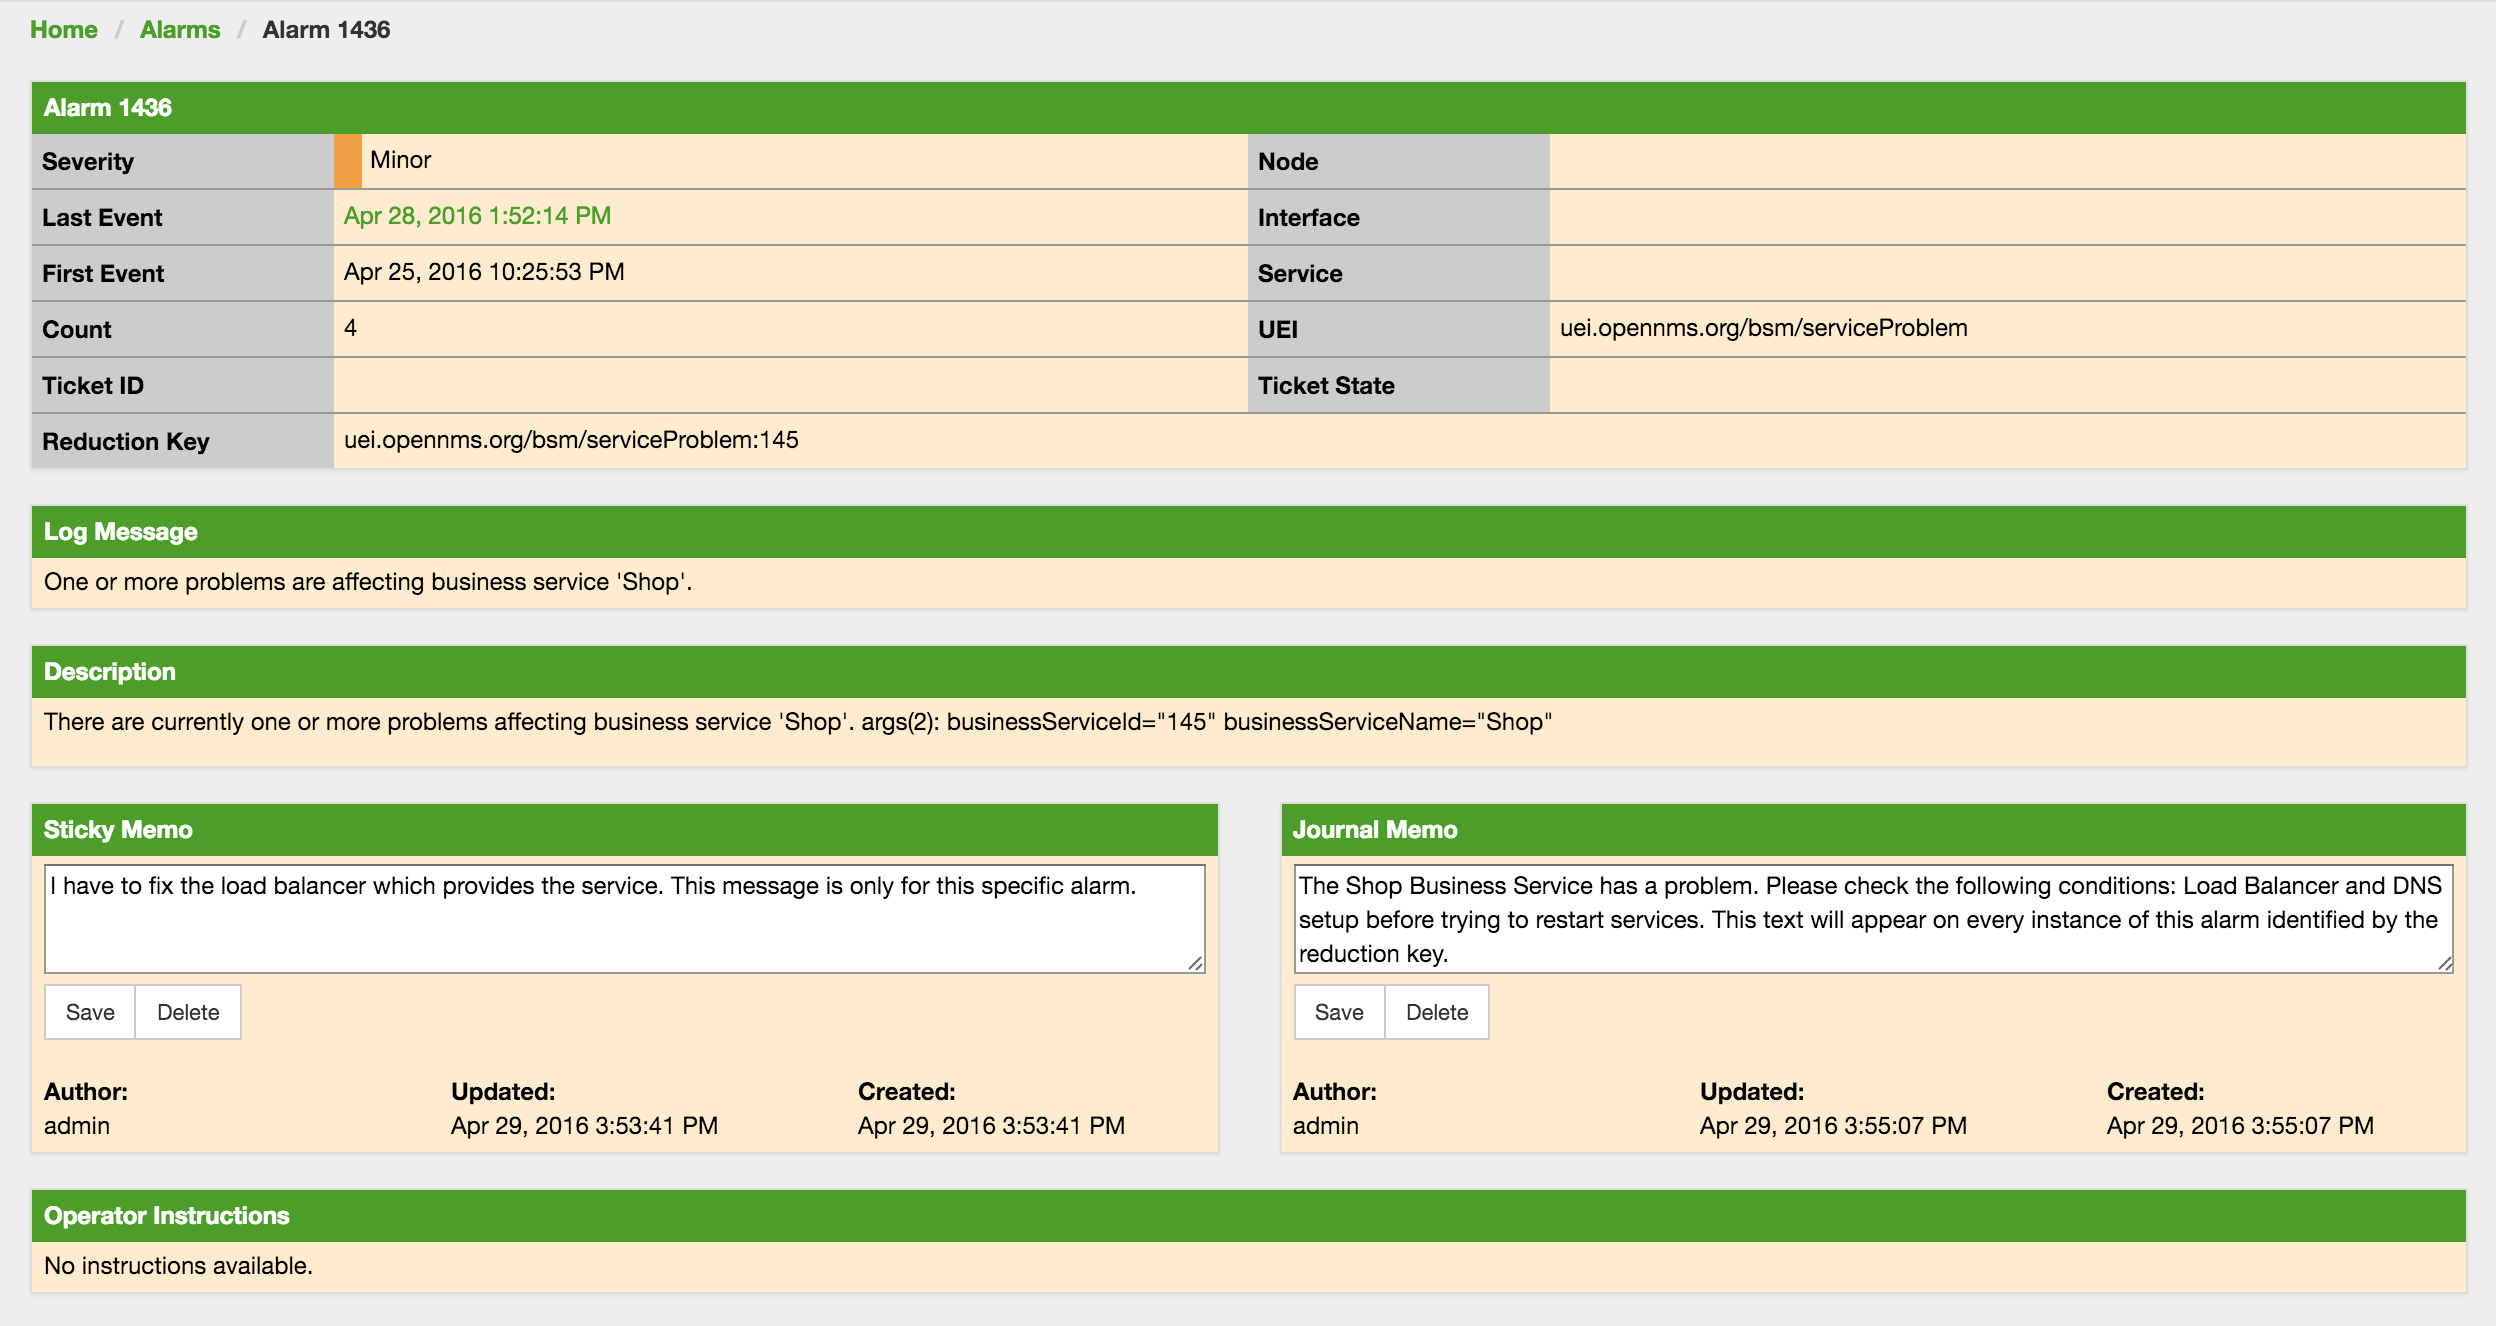
The Alarm Notes allows to add two types of notes on an existing Alarm or Alarm Class:
-
Sticky Memo: A user defined note for a specific instance of an Alarm. Deleting the Alarm will also delete the sticky memo.
-
Journal Memo: A user defined note for a whole class of alarms based on the resolved reduction key. The Journal Memo will be shown for all Alarms matching a specific reduction key. Deleting an Alarm doesn’t remove the Journal Memo, they can be removed by pressing the "Clear" button on an Alarm with the existing Journal Memo.
If an Alarm has a sticky and/or a Journal Memo it is indicated with two icons on the "Alarm list Summary" and "Alarm List Detail".
