Administrative Webinterface
1. Operator Board
1.1. Introduction
In a network operation center (NOC) the Ops Board can be used to visualize monitoring information. The monitoring information for various use-cases are arranged in configurable Dashlets. To address different user groups it is possible to create multiple Ops Boards.
There are two visualisation components to display Dashlets:
-
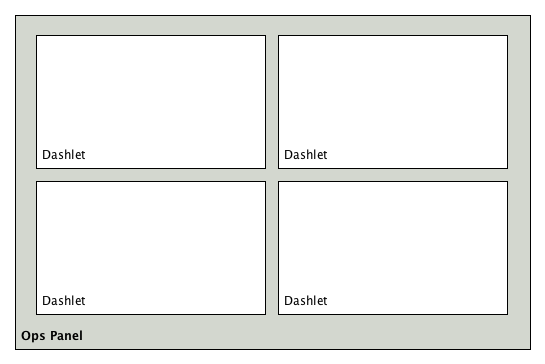
Ops Panel: Shows multiple Dashlets on one screen, e.g. on a NOC operators workstation
-
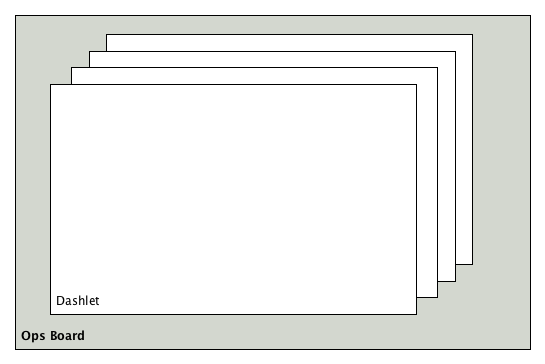
Ops Board: Shows one Dashlet at a time in rotation, e.g. for a screen wall in a NOC
1.2. Configuration
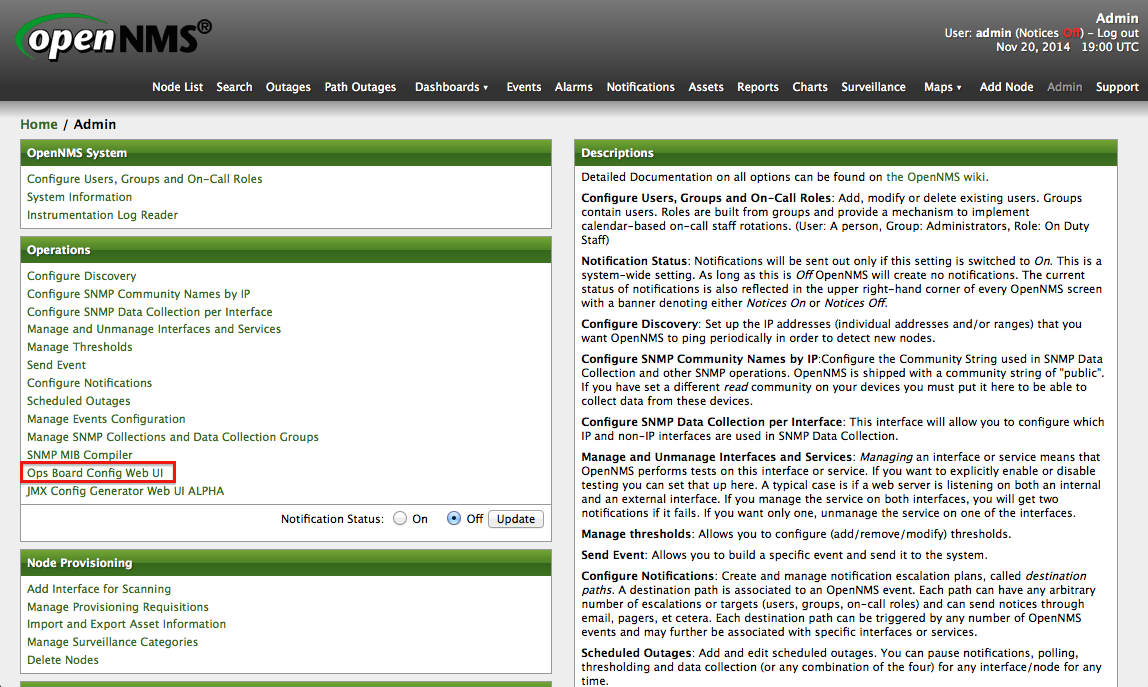
To create and configure Ops Boards administration permissions are required. The configuration section is in admin area of OpenNMS and named 'Ops Board Config Web Ui'.
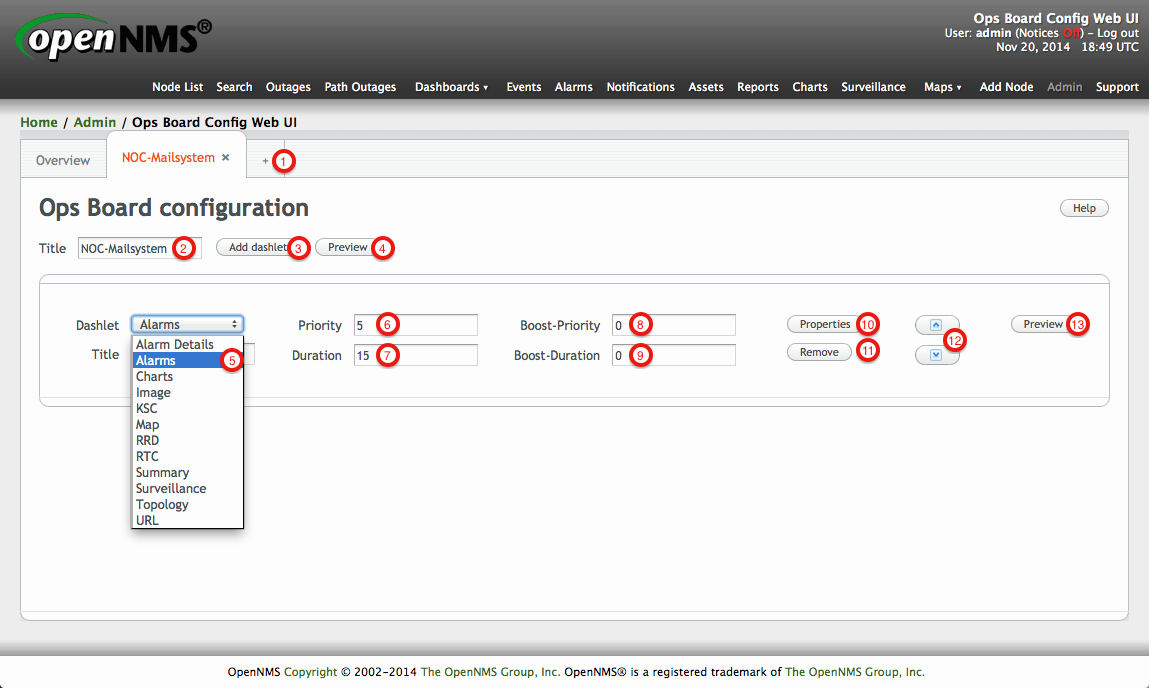
Create or modify Ops Boards is described in the following screenshot.
-
Create a new Ops Board to organize and arrange different Dashlets
-
The name to identify the Ops Board
-
Add a Dashlet to show OpenNMS monitoring information
-
Show a preview of the whole Ops Board
-
List of available Dashlets
-
'Priority' for this Dashlet in Ops Board rotation, lower priority means it will be displayed more often
-
'Duration' in seconds for this Dashlet in the Ops Board rotation
-
Change 'Priority' if the Dashlet is in alert state, this is optional and maybe not available in all Dashlets
-
Change 'Duration' if the Dashlet is in alert state, it is optional and maybe not available in all Dashlets
-
Configuration properties for this Dashlet
-
Remove this Dashlet from the Ops Board
-
Order Dashlets for the rotation on the Ops Board and the tile view in the Ops Panel
-
Show a preview for the whole Ops Board
The configured Ops Board can be used by navigating in the main menu to 'Dashboard → Ops Board'.
1.3. Dashlets
Visualization of information is implemented in Dashlets. The different Dashlets are described in this section with all available configuration parameter.
To allow filter information the Dashlet can be configured with a generic Criteria Builder.
1.3.1. Alarm Details
This Alarm-Details Dashlet shows a table with alarms and some detailed information.
| Field | Description |
|---|---|
'Alarm ID' |
OpenNMS ID for the alarm |
'Severity' |
Alarm severity (Cleared, Indeterminate, Normal, Warning, Minor, Major, Critical) |
'Node label' |
Node label of the node where the alarm occurred |
'Alarm count' |
Alarm count based on reduction key for deduplication |
'Last Event Time' |
Last time the alarm occurred |
'Log Message' |
Reason and detailed log message of the alarm |
The Alarm Details Dashlet can be configured with the following parameters.
Boost support |
|
Configuration |
1.3.2. Alarms
This Alarms Dashlet shows a table with a short alarm description.
| Field | Description |
|---|---|
'Time' |
Absolute time since the alarm appeared |
'Node label' |
Node label of the node where the alarm occurred |
'UEI' |
OpenNMS Unique Event Identifier for this alarm |
The Alarms Dashlet can be configured with the following parameters.
Boost support |
|
Configuration |
1.3.3. Charts
This Dashlet displays an existing Chart.
Boost support |
false |
|
Name of the existing chart to display |
|
Rescale the image to fill display width |
|
Rescale the image to fill display height |
1.3.4. Image
This Dashlet displays an image by a given URL.
Boost support |
false |
|
URL with the location of the image to show in this Dashlet |
|
Rescale the image to fill display width |
|
Rescale the image to fill display height |
1.3.5. KSC
This Dashlet shows an existing KSC report. The view is exact the same as the KSC report is build regarding order, columns and time spans.
Boost support |
false |
|
Name of the KSC report to show in this Dashlet |
1.3.6. Map
This Dashlet displays the geographical map.
Boost support |
false |
|
Predefined search for a subset of nodes shown in the geographical map in this Dashlet |
1.3.7. RRD
This Dashlet shows one or multiple RRD graphs. It is possible to arrange and order the RRD graphs in multiple columns and rows. All RRD graphs are normalized with a given width and height.
Boost support |
false |
|
Number of columns within the Dashlet |
|
Number of rows with the Dashlet |
|
Import RRD graphs from an existing KSC report and re-arrange them. |
|
Generic width for all RRD graphs in this Dashlet |
|
Generic height for all RRD graphs in this Dashlet |
|
Number of the given |
|
Minute, Hour, Day, Week, Month and Year for all RRD graphs |
1.3.8. RTC
This Dashlet shows the configured SLA categories from the OpenNMS start page.
Boost support |
false |
|
- |
1.3.9. Summary
This Dashlet shows a trend of incoming alarms in given time frame.
Boost support |
|
|
Time slot in seconds to evaluate the trend for alarms by severity and UEI. |
1.3.10. Surveillance
This Dashlet shows a given Surveillance View.
Boost support |
false |
|
Name of the configured Surveillance View |
1.3.11. Topology
This Dashlet shows a Topology Map. The Topology Map can be configured with the following parameter.
Boost support |
false |
|
Which node(s) is in focus for the topology |
|
Which topology should be displayed, e.g. Linkd, VMware |
|
Set the zoom level for the topology |
1.3.12. URL
This Dashlet shows the content of a web page or other web application, e.g. other monitoring systems by a given URL.
Boost support |
false |
|
Optional password if a basic authentication is required |
|
URL to the web application or web page |
|
Optional username if a basic authentication is required |
1.4. Boosting Dashlet
The behavior to boost a Dashlet describes the behavior of a Dashlet showing critical monitoring information. It can raise the priority in the Ops Board rotation to indicate a problem. This behavior can be configured with the configuration parameter Boost Priority and Boost Duration. These to configuration parameter effect the behavior on the Ops Board in rotation.
-
Boost Priority: Absolute priority of the Dashlet with critical monitoring information.
-
Boost Duration: Absolute duration in seconds of the Dashlet with critical monitoring information.
1.5. Criteria Builder
The Criteria Builder is a generic component to filter information of a Dashlet. Some Dashlets use this component to filter the shown information on a Dashlet for certain use case. It is possible to combine multiple Criteria to display just a subset of information in a given Dashlet.
| Restriction | Property | Value 1 | Value 2 | Description |
|---|---|---|---|---|
|
- |
- |
- |
ascending order |
|
- |
- |
- |
descending order |
|
database attribute |
'String' |
'String' |
Subset of data between value 1 and value 2 |
|
database attribute |
'String' |
- |
Select all data which contains a given text string in a given database attribute |
|
database attribute |
- |
- |
Select a single instance |
|
database attribute |
'String' |
- |
Select data where attribute equals ( |
|
database attribute |
'String' |
- |
Select data where attribute is greater equals than ( |
|
database attribute |
'String' |
- |
Select data where attribute is greater than ( |
|
database attribute |
'String' |
- |
'unknown' |
|
database attribute |
'String' |
- |
'unknown' |
|
database attribute |
'String' |
- |
Select data where attribute matches an given IPLIKE expression |
|
database attribute |
- |
- |
Select data where attribute is null |
|
database attribute |
- |
- |
Select data where attribute is not null |
|
database attribute |
- |
- |
Select data where attribute is not null |
|
database attribute |
'String' |
- |
Select data where attribute is less equals than ( |
|
database attribute |
'String' |
- |
Select data where attribute is less than ( |
|
database attribute |
'String' |
- |
Select data where attribute is less equals than ( |
|
database attribute |
'String' |
- |
Select data where attribute is like a given text value similar to SQL |
|
- |
'Integer' |
- |
Limit the result set by a given number |
|
database attribute |
'String' |
- |
Select data where attribute is not equals ( |
|
database attribute |
'String' |
- |
'unknown difference between `Ne’ |
|
database attribute |
- |
- |
Order the result set by a given attribute |
2. Service Assurance
2.1. Service monitors
2.1.1. AvailabilityMonitor
This monitor tests reachability of a node by using the isReachable method of the InetAddress java class. The service is considered available if isReachable returns true. See Oracle’s documentation for more details.
| This monitor is deprecated in favour of the IcmpMonitor monitor. You should only use this monitor on remote pollers running on unusual configurations (See below for more details). |
Monitor facts
Class Name |
|
Remote Enabled |
true |
Configuration and Usage
| Parameter | Description | Required | Default value |
|---|---|---|---|
|
Number of attempts to have the isReachable method return true. |
optional |
|
|
Timeout for the isReachable method, in milliseconds. |
optional |
|
Examples
<service name="AVAIL" interval="300000" user-defined="false" status="on">
  <parameter key="retry" value="2"/>
  <parameter key="timeout" value="5000"/>
</service>

<monitor service="AVAIL" class-name="org.opennms.netmgt.poller.monitors.AvailabilityMonitor"/>
IcmpMonitor vs AvailabilityMonitor
This monitor has been developped in a time when the IcmpMonitor monitor wasn’t remote enabled, to circumvent this limitation. Now, with the JNA ICMP implementation, the IcmpMonitor monitor is remote enabled under most configurations and this monitor shouldn’t be needed -unless you’re running your remote poller on such an unusual configuration (See also issue NMS-6735 for more information)-.
2.1.2. BgpSessionMonitor
This monitor checks if a BGP-Session to a peering partner (peer-ip) is functional. To monitor the BGP-Session the RFC1269 SNMP MIB is used and test the status of the session using the following OIDs is used:
BGP_PEER_STATE_OID = .1.3.6.1.2.1.15.3.1.2.<peer-ip>
BGP_PEER_ADMIN_STATE_OID = .1.3.6.1.2.1.15.3.1.3.<peer-ip>
BGP_PEER_REMOTEAS_OID = .1.3.6.1.2.1.15.3.1.9.<peer-ip>
BGP_PEER_LAST_ERROR_OID = .1.3.6.1.2.1.15.3.1.14.<peer-ip>
BGP_PEER_FSM_EST_TIME_OID = .1.3.6.1.2.1.15.3.1.16.<peer-ip>
The <peer-ip> is the far end IP address of the BGP session end point.
A SNMP get request for BGP_PEER_STATE_OID returns a result between 1 to 6.
The servicestates for OpenNMS are mapped as follows:
| Result | State description | Monitor state in OpenNMS |
|---|---|---|
|
Idle |
DOWN |
|
Connect |
DOWN |
|
Active |
DOWN |
|
OpenSent |
DOWN |
|
OpenConfirm |
DOWN |
|
Established |
UP |
Monitor facts
Class Name |
|
Remote Enabled |
false |
To define the mapping I used the description from RFC1771 BGP Finite State Machine.
Configuration and Usage
| Parameter | Description | Required | Default value |
|---|---|---|---|
|
IP address of the far end BGP peer session |
required |
|
|
Amount of attempts to get the BGP peer state with SNMP |
required |
|
|
Time to wait for the SNMP agents response before trying a next attempt. |
required |
|
Examples
To monitor the session state Established it is necessary to add a service to your poller configuration in '$OPENNMS_HOME/etc/poller-configuration.xml', for example:
<!-- Example configuration poller-configuration.xml -->
<service name="BGP-Peer-99.99.99.99-AS65423" interval="300000"
         user-defined="false" status="on">
    <parameter key="retry" value="2" />
    <parameter key="timeout" value="3000" />
    <parameter key="port" value="161" />
    <parameter key="bgpPeerIp" value="99.99.99.99" />
</service>

<monitor service="BGP-Peer-99.99.99.99-AS65423" class-name="org.opennms.netmgt.poller.monitors.BgpSessionMonitor" />
Error code mapping
The BGP_PEER_LAST_ERROR_OID gives an error in HEX-code. To make it human readable a codemapping table is implemented:
| Error code | Error Message |
|---|---|
|
Message Header Error |
|
Message Header Error - Connection Not Synchronized |
|
Message Header Error - Bad Message Length |
|
Message Header Error - Bad Message Type |
|
OPEN Message Error |
|
OPEN Message Error - Unsupported Version Number |
|
OPEN Message Error - Bad Peer AS |
|
OPEN Message Error - Bad BGP Identifier |
|
OPEN Message Error - Unsupported Optional Parameter |
|
OPEN Message Error (deprecated) |
|
OPEN Message Error - Unacceptable Hold Time |
|
UPDATE Message Error |
|
UPDATE Message Error - Malformed Attribute List |
|
UPDATE Message Error - Unrecognized Well-known Attribute |
|
UPDATE Message Error - Missing Well-known Attribute |
|
UPDATE Message Error - Attribute Flags Error |
|
UPDATE Message Error - Attribute Length Error |
|
UPDATE Message Error - Invalid ORIGIN Attribute |
|
UPDATE Message Error (deprecated) |
|
UPDATE Message Error - Invalid NEXT_HOP Attribute |
|
UPDATE Message Error - Optional Attribute Error |
|
UPDATE Message Error - Invalid Network Field |
|
UPDATE Message Error - Malformed AS_PATH |
|
Hold Timer Expired |
|
Finite State Machine Error |
|
Cease |
|
Cease - Maximum Number of Prefixes Reached |
|
Cease - Administrative Shutdown |
|
Cease - Peer De-configured |
|
Cease - Administrative Reset |
|
Cease - Connection Rejected |
|
Cease - Other Configuration Change |
|
Cease - Connection Collision Resolution |
|
Cease - Out of Resources |
Instead of HEX-Code the error message will be displayed in the service down logmessage. To give some additional informations the logmessage contains also
BGP-Peer Adminstate
BGP-Peer Remote AS
BGP-Peer established time in seconds
Debugging
If you have problems to detect or monitor the BGP Session you can use the following command to figure out where the problem come from.
snmpwalk -v 2c -c <myCommunity> <myRouter2Monitor> .1.3.6.1.2.1.15.3.1.2.99.99.99.99Replace 99.99.99.99 with your BGP-Peer IP.
The result should be an Integer between 1 and 6.
2.1.3. BSFMonitor
This monitor runs a Bean Scripting Framework BSF compatible script to determine the status of a service. Users can write scripts to perform highly custom service checks. This monitor is not optimised for scale. It’s intended for a small number of custom checks or prototyping of monitors.
BSFMonitor vs SystemExecuteMonitor
The BSFMonitor avoids the overhead of fork(2) that is used by the SystemExecuteMonitor. BSFMonitor also grants access to a selection of OpenNMS internal methods and classes that can be used in the script.
Monitor facts
Class Name |
|
Remote Enabled |
false |
Configuration and Usage
| Parameter | Description | Required | Default value |
|---|---|---|---|
|
Path to the script file. |
required |
|
|
The BSF Engine to run the script in different languages like |
required |
|
|
one of |
optional |
|
|
The BSF language class, like |
optional |
file-name extension is interpreted by default |
|
comma-separated list |
optional |
|
| Variable | Type | Description |
|---|---|---|
|
Map<String, Object> |
The map contains all various parameters passed to the monitor from the service definition it the 'poller-configuration.xml' file. |
|
String |
The IP address that is currently being polled. |
|
int |
The Node ID of the node the |
|
String |
The Node Label of the node the |
|
String |
The name of the service that is being polled. |
|
BSFMonitor |
The instance of the BSFMonitor object calling the script. Useful for logging via its log(String sev, String fmt, Object... args) method. |
|
HashMap<String, String> |
The script is expected to put its results into this object.
The status indication should be set into the entry with key |
|
LinkedHashMap<String, Number> |
The script is expected to put one or more response times into this object. |
Additionally every parameter added to the service definition in 'poller-configuration.xml' is available as a String object in the script. The key attribute of the parameter represents the name of the String object and the value attribute represents the value of the String object.
| Please keep in mind, that these parameters are also accessible via the map bean. |
| Avoid non-character names for parameters to avoid problems in the script languages. |
Response Codes
The script has to provide a status code that represents the status of the associated service. The following status codes are defined:
| Code | Description |
|---|---|
|
Service is available |
|
Service status unknown |
|
Service is unresponsive |
|
Service is unavailable |
Response time tracking
By default the BSFMonitor tracks the whole time the script file consumes as the response time. If the response time should be persisted the response time add the following parameters:
<!-- where in the filesystem response times are stored -->
<parameter key="rrd-repository" value="/opt/opennms/share/rrd/response" />

<!-- name of the rrd file -->
<parameter key="rrd-base-name" value="minimalbshbase" />

<!-- name of the data source in the rrd file -->
<!-- by default "response-time" is used as ds-name -->
<parameter key="ds-name" value="myResponseTime" />
It is also possible to return one or many response times directly from the script.
To add custom response times or override the default one, add entries to the times object.
The entries are keyed with a String that names the datasource and have as values a number that represents the response time.
To override the default response time datasource add an entry into times named response-time.
Timeout and Retry
The BSFMonitor does not perform any timeout or retry processing on its own. If retry and or timeout behaviour is required, it has to be implemented in the script itself.
Requirements for the script (run-types)
Depending on the run-type the script has to provide its results in different ways.
For minimal scripts with very simple logic run-type eval is the simple option.
Scripts running in eval mode have to return a String matching one of the status codes.
If your script is more than a one-liner, run-type exec is essentially required.
Scripts running in exec mode need not return anything, but they have to add a status entry with a status code to the results object.
Additionally, the results object can also carry a "reason":"message" entry that is used in non OK states.
Commonly used language settings
The BSF supports many languages, the following table provides the required setup for commonly used languages.
| Language | lang-class | bsf-engine | required library |
|---|---|---|---|
beanshell |
|
supported by default |
|
groovy |
|
groovy-all-[version].jar |
|
jython |
|
jython-[version].jar |
Example Bean Shell
<service name="MinimalBeanShell" interval="300000" user-defined="true" status="on">
  <parameter key="file-name"  value="/tmp/MinimalBeanShell.bsh"/>
  <parameter key="bsf-engine" value="bsh.util.BeanShellBSFEngine"/>
</service>

<monitor service="MinimalBeanShell" class-name="org.opennms.netmgt.poller.monitors.BSFMonitor" />bsf_monitor.log("ERROR", "Starting MinimalBeanShell.bsf", null);
File testFile = new File("/tmp/TestFile");
if (testFile.exists()) {
return "OK";
} else {
results.put("reason", "file does not exist");
return "NOK";
}Example Groovy
To use the Groovy language an additional library is required. Copy a compatible groovy-all.jar into to 'opennms/lib' folder and restart OpenNMS. That makes Groovy available for the BSFMonitor.
run-type set to eval<service name="MinimalGroovy" interval="300000" user-defined="true" status="on">
<parameter key="file-name" value="/tmp/MinimalGroovy.groovy"/>
<parameter key="bsf-engine" value="org.codehaus.groovy.bsf.GroovyEngine"/>
</service>
<monitor service="MinimalGroovy" class-name="org.opennms.netmgt.poller.monitors.BSFMonitor" />run-type evalbsf_monitor.log("ERROR", "Starting MinimalGroovy.groovy", null);
File testFile = new File("/tmp/TestFile");
if (testFile.exists()) {
return "OK";
} else {
results.put("reason", "file does not exist");
return "NOK";
}run-type set to exec<service name="MinimalGroovy" interval="300000" user-defined="true" status="on">
<parameter key="file-name" value="/tmp/MinimalGroovy.groovy"/>
<parameter key="bsf-engine" value="org.codehaus.groovy.bsf.GroovyEngine"/>
<parameter key="run-type" value="exec"/>
</service>
<monitor service="MinimalGroovy" class-name="org.opennms.netmgt.poller.monitors.BSFMonitor" />run-type set to execbsf_monitor.log("ERROR", "Starting MinimalGroovy", null);
def testFile = new File("/tmp/TestFile");
if (testFile.exists()) {
results.put("status", "OK")
} else {
results.put("reason", "file does not exist");
results.put("status", "NOK");
}Example Jython
To use the Jython (Java implementation of Python) language an additional library is required.
Copy a compatible jython-x.y.z.jar into the 'opennms/lib' folder and restart OpenNMS.
That makes Jython available for the BSFMonitor.
run-type exec<service name="MinimalJython" interval="300000" user-defined="true" status="on">
<parameter key="file-name" value="/tmp/MinimalJython.py"/>
<parameter key="bsf-engine" value="org.apache.bsf.engines.jython.JythonEngine"/>
<parameter key="run-type" value="exec"/>
</service>
<monitor service="MinimalJython" class-name="org.opennms.netmgt.poller.monitors.BSFMonitor" />run-type set to execfrom java.io import File
bsf_monitor.log("ERROR", "Starting MinimalJython.py", None);
if (File("/tmp/TestFile").exists()):
results.put("status", "OK")
else:
results.put("reason", "file does not exist")
results.put("status", "NOK")
We have to use run-type exec here because Jython chokes on the import keyword in eval mode.
|
| As profit that this is really Python, notice the substitution of Python’s None value for Java’s null in the log call. |
Advanced examples
The following example references all beans that are exposed to the script, including a custom parameter.
<service name="MinimalGroovy" interval="30000" user-defined="true" status="on">
  <parameter key="file-name"  value="/tmp/MinimalGroovy.groovy"/>
  <parameter key="bsf-engine" value="org.codehaus.groovy.bsf.GroovyEngine"/>

  <!-- custom parameters (passed to the script) -->
  <parameter key="myParameter" value="Hello Groovy" />

  <!-- optional for response time tracking -->
  <parameter key="rrd-repository" value="/opt/opennms/share/rrd/response" />
  <parameter key="rrd-base-name" value="minimalgroovybase" />
  <parameter key="ds-name" value="minimalgroovyds" />
</service>

<monitor service="MinimalGroovy" class-name="org.opennms.netmgt.poller.monitors.BSFMonitor" />bsf_monitor.log("ERROR", "Starting MinimalGroovy", null);
//list of all available objects from the BSFMonitor
Map<String, Object> map = map;
bsf_monitor.log("ERROR", "---- map ----", null);
bsf_monitor.log("ERROR", map.toString(), null);
String ip_addr = ip_addr;
bsf_monitor.log("ERROR", "---- ip_addr ----", null);
bsf_monitor.log("ERROR", ip_addr, null);
int node_id = node_id;
bsf_monitor.log("ERROR", "---- node_id ----", null);
bsf_monitor.log("ERROR", node_id.toString(), null);
String node_label = node_label;
bsf_monitor.log("ERROR", "---- node_label ----", null);
bsf_monitor.log("ERROR", node_label, null);
String svc_name = svc_name;
bsf_monitor.log("ERROR", "---- svc_name ----", null);
bsf_monitor.log("ERROR", svc_name, null);
org.opennms.netmgt.poller.monitors.BSFMonitor bsf_monitor = bsf_monitor;
bsf_monitor.log("ERROR", "---- bsf_monitor ----", null);
bsf_monitor.log("ERROR", bsf_monitor.toString(), null);
HashMap<String, String> results = results;
bsf_monitor.log("ERROR", "---- results ----", null);
bsf_monitor.log("ERROR", results.toString(), null);
LinkedHashMap<String, Number> times = times;
bsf_monitor.log("ERROR", "---- times ----", null);
bsf_monitor.log("ERROR", times.toString(), null);
// reading a parameter from the service definition
String myParameter = myParameter;
bsf_monitor.log("ERROR", "---- myParameter ----", null);
bsf_monitor.log("ERROR", myParameter, null);
// minimal example
def testFile = new File("/tmp/TestFile");
if (testFile.exists()) {
bsf_monitor.log("ERROR", "Done MinimalGroovy ---- OK ----", null);
return "OK";
} else {
results.put("reason", "file does not exist");
bsf_monitor.log("ERROR", "Done MinimalGroovy ---- NOK ----", null);
return "NOK";
}2.1.4. CiscoIpSlaMonitor
This monitor can be used to monitor IP SLA configurations on your Cisco devices. This monitor supports the following SNMP OIDS from CISCO-RTT-MON-MIB:
RTT_ADMIN_TAG_OID = .1.3.6.1.4.1.9.9.42.1.2.1.1.3
RTT_OPER_STATE_OID = .1.3.6.1.4.1.9.9.42.1.2.9.1.10
RTT_LATEST_OPERSENSE_OID = .1.3.6.1.4.1.9.9.42.1.2.10.1.2
RTT_ADMIN_THRESH_OID = .1.3.6.1.4.1.9.9.42.1.2.1.1.5
RTT_ADMIN_TYPE_OID = .1.3.6.1.4.1.9.9.42.1.2.1.1.4
RTT_LATEST_OID = .1.3.6.1.4.1.9.9.42.1.2.10.1.1
The monitor can be run in two scenarios. The first one tests the RTT_LATEST_OPERSENSE which is a sense code for the completion status of the latest RTT operation. If the RTT_LATEST_OPERSENSE returns ok(1) the service is marked as up.
The second scenario is to monitor the configured threshold in the IP SLA config. If the RTT_LATEST_OPERSENSE returns with overThreshold(3) the service is marked down.
Monitor facts
Class Name |
|
Remote Enabled |
false |
Configuration and Usage
| Parameter | Description | Required | Default value |
|---|---|---|---|
|
Number of retries to get the information from the SNMP agent before the service is marked as down. |
optional |
from 'snmp-config.xml' |
|
Time in milliseconds to wait for the result from the SNMP agent before making the next attempt. |
optional |
from 'snmp-config.xml' |
|
The |
required |
|
|
Boolean indicates if just the status or configured threshold should be monitored. |
required |
`` |
Example for HTTP and ICMP echo reply
In this example we configure an IP SLA entry to monitor Google’s website with HTTP GET from the Cisco device.
We use 8.8.8.8 as our DNS resolver.
In our example our SLA says we should reach Google’s website within 200ms.
To advise co-workers that this monitor entry is used for monitoring, I set the owner to OpenNMS.
The tag is used to identify the entry later in the SNMP table for monitoring.
ip sla monitor 1
 type http operation get url http://www.google.de name-server 8.8.8.8
 timeout 3000
 threshold 200
 owner OpenNMS
 tag Google Website
ip sla monitor schedule 3 life forever start-time now
In the second example we configure a IP SLA to test if the IP address from www.opennms.org is reachable with ICMP from the perspective of the Cisco device. Like the example above we have a threshold and a timeout.
ip sla 1
 icmp-echo 64.146.64.212
 timeout 3000
 threshold 150
 owner OpenNMS
 tag OpenNMS Host
ip sla schedule 1 life forever start-time now| It´s not possible to reconfigure an IP SLA entry. If you want to change parameters, you have to delete the whole configuration and reconfigure it with your new parameters. Backup your Cisco configuration manually or take a look at RANCID. |
To monitor both of the entries the configuration in 'poller-configuration.xml' requires two service definition entries:
<service name="IP-SLA-WEB-Google" interval="300000"
  user-defined="false" status="on">
    <parameter key="retry" value="2" />
    <parameter key="timeout" value="3000" />
    <parameter key="admin-tag" value="Google Website" />
    <parameter key="ignore-thresh" value="false" />(1)
</service>
<service name="IP-SLA-PING-OpenNMS" interval="300000"
  user-defined="false" status="on">
    <parameter key="retry" value="2" />
    <parameter key="timeout" value="3000" />
    <parameter key="admin-tag" value="OpenNMS Host" />
    <parameter key="ignore-thresh" value="true" />(2)
</service>

<monitor service="IP-SLA-WEB-Google" class-name="org.opennms.netmgt.poller.monitors.CiscoIpSlaMonitor" />
<monitor service="IP-SLA-PING-OpenNMS" class-name="org.opennms.netmgt.poller.monitors.CiscoIpSlaMonitor" />| 1 | Service is up if the IP SLA state is ok(1) |
| 2 | Service is down if the IP SLA state is overThreshold(3) |
2.1.5. CiscoPingMibMonitor
This poller monitor’s purpose is to create conceptual rows (entries) in the ciscoPingTable on Cisco IOS devices that support the CISCO-PING-MIB. These entries direct the remote IOS device to ping an IPv4 or IPv6 address with a configurable set of parameters. After the IOS device has completed the requested ping operations, the poller monitor queries the IOS device to determine the results. If the results indicate success according to the configured parameters in the service configuration, then the monitored service is reported as available and the results are available for optional time-series (RRD) storage. If the results indicate failure, the monitored service is reported unavailable with a descriptive reason code. If something goes wrong during the setup of the entry or the subsequent querying of its status, the monitored service is reported to be in an unknown state.
Unlike most poller monitors, the CiscoPingMibMonitor does not interpret the timeout and retries parameters to determine when a poll attempt has timed out or whether it should be attempted again.
The packet-count and packet-timeout parameters instead service this purpose from the perspective of the remote IOS device.
|
 ciscoPingEntry             1.3.6.1.4.1.9.9.16.1.1.1
 ciscoPingSerialNumber      1.3.6.1.4.1.9.9.16.1.1.1.1
 ciscoPingProtocol          1.3.6.1.4.1.9.9.16.1.1.1.2
 ciscoPingAddress           1.3.6.1.4.1.9.9.16.1.1.1.3
 ciscoPingPacketCount       1.3.6.1.4.1.9.9.16.1.1.1.4
 ciscoPingPacketSize        1.3.6.1.4.1.9.9.16.1.1.1.5
 ciscoPingPacketTimeout     1.3.6.1.4.1.9.9.16.1.1.1.6
 ciscoPingDelay             1.3.6.1.4.1.9.9.16.1.1.1.7
 ciscoPingTrapOnCompletion  1.3.6.1.4.1.9.9.16.1.1.1.8
 ciscoPingSentPackets       1.3.6.1.4.1.9.9.16.1.1.1.9
 ciscoPingReceivedPackets   1.3.6.1.4.1.9.9.16.1.1.1.10
 ciscoPingMinRtt            1.3.6.1.4.1.9.9.16.1.1.1.11
 ciscoPingAvgRtt            1.3.6.1.4.1.9.9.16.1.1.1.12
 ciscoPingMaxRtt            1.3.6.1.4.1.9.9.16.1.1.1.13
 ciscoPingCompleted         1.3.6.1.4.1.9.9.16.1.1.1.14
 ciscoPingEntryOwner        1.3.6.1.4.1.9.9.16.1.1.1.15
 ciscoPingEntryStatus       1.3.6.1.4.1.9.9.16.1.1.1.16
 ciscoPingVrfName           1.3.6.1.4.1.9.9.16.1.1.1.17
Prerequisites
-
One or more Cisco devices running an IOS image of recent vintage; any 12.2 or later image is probably fine. Even very low-end devices appear to support the CISCO-PING-MIB.
-
The IOS devices that will perform the remote pings must be configured with an SNMP write community string whose source address access-list includes the address of the OpenNMS server and whose MIB view (if any) includes the OID of the ciscoPingTable.
-
The corresponding SNMP write community string must be specified in the
write-communityattribute of either the top-level<snmp-config>element of 'snmp-config.xml' or a<definition>child element that applies to the SNMP-primary interface of the IOS device(s) that will perform the remote pings.
Scalability concerns
This monitor spends a fair amount of time sleeping while it waits for the remote IOS device to complete the requested ping operations.
The monitor is pessimistic in calculating the delay between creation of the ciscoPingTable entry and its first attempt to retrieve the results of that entry’s ping operations — it will always wait at least (packet-count * (packet-timeout + packet-delay)) milliseconds before even checking whether the remote pings have completed.
It’s therefore prone to hogging poller threads if used with large values for the packet-count, packet-timeout, and/or packet-delay parameters.
Keep these values as small as practical to avoid tying up poller threads unnecessarily.
This monitor always uses the current time in whole seconds since the UNIX epoch as the instance identifier of the ciscoPingTable entries that it creates. The object that holds this identifier is a signed 32-bit integer type, precluding a finer resolution. It’s probably a good idea to mix in the least-significant byte of the millisecond-accurate time as a substitute for that of the whole-second-accurate value to avoid collisions. IOS seems to clean up entries in this table within a manner of minutes after their ping operations have completed.
Monitor facts
Class Name |
|
Remote Enabled |
false |
Configuration and Usage
| Parameter | Description | Required | Default value |
|---|---|---|---|
|
A timeout, in milliseconds, that should override the SNMP timeout specified in 'snmp-config.xml'. Do not use without a very good reason to do so. |
optional |
from 'snmp-config.xml' |
|
Number of retries to attempt if the initial attempt times out. Overrides the equivalent value from 'snmp-config.xml'. Do not use unless really needed. |
optional |
from 'snmp-config.xml' |
|
SNMP protocol version (1, 2c, or 3) to use for operations performed by this service monitor. Do not use with out a very good reason to do so. |
optional |
from 'snmp-config.xml' |
|
Number of ping packets that the remote IOS device should send. |
optional |
|
|
Size, in bytes, of each ping packet that the remote IOS device should send. |
optional |
|
|
Timeout, in milliseconds, of each ping packet sent by the remote IOS device. |
optional |
|
|
Delay, in milliseconds, between ping packets sent by the remote IOS device. |
optional |
|
|
String value to set as the value of ciscoPingEntryOwner of entries created for this service. |
optional |
|
|
String value to set as the VRF (VLAN) name in whose context the remote IOS device should perform the pings for this service. |
optional |
empty String |
|
Numeric database identifier of the node whose primary SNMP interface should be used
as the proxy for this service. If specified along with the related
|
optional |
|
|
|
optional |
|
|
IP address of the interface that should be used as the proxy for this service.
Effective only if none of |
optional |
|
|
IP address that the remote IOS device should ping. A value of |
optional |
|
|
A whole-number percentage of pings that must succeed (from the perspective of the
remote IOS device) in order for this service to be considered available. As an
example, if |
optional |
|
|
Base directory of an RRD repository in which to store this service monitor’s response-time samples |
optional |
|
|
Name of the RRD datasource (DS) name in which to store this service monitor’s
response-time samples; rrd-base-name Base name of the RRD file (minus the |
optional |
|
This is optional just if you can use variables in the configuration
| Variable | Description |
|---|---|
|
This value will be substituted with the IP address of the interface on which the monitored service appears. |
Example: Ping the same non-routable address from all routers of customer Foo
A service provider’s client, Foo Corporation, has network service at multiple locations. At each Foo location, a point-of-sale system is statically configured at IPv4 address 192.168.255.1. Foo wants to be notified any time a point-of-sale system becomes unreachable. Using an OpenNMS remote location monitor is not feasible. All of Foo Corporation’s CPE routers must be Cisco IOS devices in order to achieve full coverage in this scenario.
One approach to this requirement is to configure all of Foo Corporation’s premise routers to be in the surveillance categories Customer_Foo, CPE, and Routers, and to use a filter to create a poller package that applies only to those routers.
We will use the special value ${ipaddr} for the proxy-ip-addr parameter so that the remote pings will be provisioned on each Foo CPE router.
Since we want each Foo CPE router to ping the same IP address 192.168.255.1, we statically list that value for the target-ip-addr address.
<package name="ciscoping-foo-pos">
  <filter>catincCustomer_Foo & catincCPE & catincRouters & nodeSysOID LIKE '.1.3.6.1.4.1.9.%'</filter>
  <include-range begin="0.0.0.0" end="254.254.254.254" />
  <rrd step="300">
    <rra>RRA:AVERAGE:0.5:1:2016</rra>
    <rra>RRA:AVERAGE:0.5:12:1488</rra>
    <rra>RRA:AVERAGE:0.5:288:366</rra>
    <rra>RRA:MAX:0.5:288:366</rra>
    <rra>RRA:MIN:0.5:288:366</rra>
  </rrd>
  <service name="FooPOS" interval="300000" user-defined="false" status="on">
    <parameter key="rrd-repository" value="/opt/opennms/share/rrd/response" />
    <parameter key="rrd-base-name" value="ciscoping" />
    <parameter key="ds-name" value="ciscoping" />
    <parameter key="proxy-ip-addr" value="${ipaddr}" />
    <parameter key="target-ip-addr" value="192.168.255.1" />
  </service>
  <downtime interval="30000" begin="0" end="300000" /><!-- 30s, 0, 5m -->
  <downtime interval="300000" begin="300000" end="43200000" /><!-- 5m, 5m, 12h -->
  <downtime interval="600000" begin="43200000" end="432000000" /><!-- 10m, 12h, 5d -->
  <downtime begin="432000000" delete="true" /><!-- anything after 5 days delete -->
</package>

<monitor service="FooPOS" class-name="org.opennms.netmgt.poller.monitors.CiscoPingMibMonitor" />
Example: Ping from a single IOS device routable address of each router of customer Bar
A service provider’s client, Bar Limited, has network service at multiple locations. While OpenNMS' world-class service assurance is generally sufficient, Bar also wants to be notified any time a premise router at one of their locations unreachable from the perspective of an IOS device in Bar’s main data center. Some or all of the Bar Limited CPE routers may be non-Cisco devices in this scenario.
To meet this requirement, our approach is to configure Bar Limited’s premise routers to be in the surveillance categories Customer_Bar, CPE, and Routers, and to use a filter to create a poller package that applies only to those routers.
This time, though, we will use the special value ${ipaddr} not in the proxy-ip-addr parameter but in the target-ip-addr parameter so that the remote pings will be performed for each Bar CPE router.
Since we want the same IOS device 20.11.5.11 to ping the CPE routers, we statically list that value for the proxy-ip-addr address.
Example 'poller-configuration.xml' additions
<package name="ciscoping-bar-cpe">
  <filter>catincCustomer_Bar & catincCPE & catincRouters</filter>
  <include-range begin="0.0.0.0" end="254.254.254.254" />
  <rrd step="300">
    <rra>RRA:AVERAGE:0.5:1:2016</rra>
    <rra>RRA:AVERAGE:0.5:12:1488</rra>
    <rra>RRA:AVERAGE:0.5:288:366</rra>
    <rra>RRA:MAX:0.5:288:366</rra>
    <rra>RRA:MIN:0.5:288:366</rra>
  </rrd>
  <service name="BarCentral" interval="300000" user-defined="false" status="on">
    <parameter key="rrd-repository" value="/opt/opennms/share/rrd/response" />
    <parameter key="rrd-base-name" value="ciscoping" />
    <parameter key="ds-name" value="ciscoping" />
    <parameter key="proxy-ip-addr" value="20.11.5.11" />
    <parameter key="target-ip-addr" value="${ipaddr}" />
  </service>
  <downtime interval="30000" begin="0" end="300000" /><!-- 30s, 0, 5m -->
  <downtime interval="300000" begin="300000" end="43200000" /><!-- 5m, 5m, 12h -->
  <downtime interval="600000" begin="43200000" end="432000000" /><!-- 10m, 12h, 5d -->
  <downtime begin="432000000" delete="true" /><!-- anything after 5 days delete -->
</package>

<monitor service="BarCentral" class-name="org.opennms.netmgt.poller.monitors.CiscoPingMibMonitor" />
2.1.6. CitrixMonitor
This monitor is used to test if a Citrix® Server or XenApp Server® is providing the ICA protocol on TCP 1494.
The monitor opens a TCP socket and tests the greeting banner returns with ICA, otherwise the service is unavailable.
Monitor facts
Class Name |
|
Remote Enabled |
true |
Configuration and Usage
| Parameter | Description | Required | Default value |
|---|---|---|---|
|
Amount of attempts opening a connection and try to get the greeting banner before the service goes down |
optional |
|
|
Time to wait retrieving the greeting banner |
optional |
|
|
TCP port where ICA is listening. |
optional |
|
If you have configure the Metaframe Presentation Server Client using Session Reliability, the TCP port is 2598 instead of 1494.
You can find additional information on CTX104147.
It is not verified if the monitor works in this case.
|
Examples
The following example configures OpenNMS to monitor the ICA protocol on TCP 1494 with 2 retries and waiting 5 seconds for each retry.
<service name="Citrix-TCP-ICA" interval="300000" user-defined="false" status="on">
    <parameter key="retry" value="2" />
    <parameter key="timeout" value="5000" />
</service>

<monitor service="Citrix-TCP-ICA" class-name="org.opennms.netmgt.poller.monitors.CitrixMonitor" />
2.1.7. DhcpMonitor
This monitor is used to monitor the availability and functionality of DHCP servers.
This monitor has two parts, the first one is the monitor class DhcpMonitor executed by Pollerd and the second part is a background daemon Dhcpd running inside the OpenNMS JVM and listening for DHCP responses.
A DHCP server is tested by sending a DISCOVER message.
If the DHCP server responds with an OFFER the service is marked as up.
The Dhcpd background daemon is disabled by default and has to be activated in 'service-configuration.xml' in OpenNMS by setting service enabled="true".
The behavior for testing the DHCP server can be modified in the 'dhcp-configuration.xml' configuration file.
It is required to install the opennms-plugin-protocol-dhcp before you can use this feature.
|
{apt-get,yum} install opennms-plugin-protocol-dhcp
If you try to start OpenNMS without the opennms-plugin-protocol-dhcp you will see the following error message in 'output.log':
An error occurred while attempting to start the "OpenNMS:Name=Dhcpd" service (class org.opennms.netmgt.dhcpd.jmx.Dhcpd).  Shutting down and exiting.
java.lang.ClassNotFoundException: org.opennms.netmgt.dhcpd.jmx.Dhcpd
Make sure no DHCP client is running on the OpenNMS server and using port UDP/68.
If UDP/68 is already in use, you will find an error message in the manager.log.
You can test if a process is listening on udp/68 with sudo ss -lnpu sport = :68.
|
Monitor facts
Class Name |
|
Remote Enabled |
false |
| Parameter | Description | Required | Default value |
|---|---|---|---|
|
Number of retries before the service is marked as down |
optional |
|
|
Time in milliseconds to wait for the DHCP response from the server |
optional |
|
|
The location to write RRD data. Generally, you will not want to change this from default |
optional |
|
|
The name of the RRD file to write (minus the extension, .rrd or .jrb) |
optional |
|
|
This is the name as reference for this particular data source in the RRD file |
optional |
|
Dhcpd configuration
Parameter |
Description |
Required |
Default value |
|
Defines the port your dhcp server is using |
required |
|
|
The MAC address which OpenNMS uses for a dhcp request |
required |
|
|
This parameter will usually be set to the IP address of the OpenNMS server,
which puts the DHCP poller in |
required |
|
|
When extendedMode is false, the DHCP poller will send a DISCOVER and expect an
OFFER in return. When extendedMode is true, the DHCP poller will first send a
DISCOVER. If no valid response is received it will send an INFORM. If no valid
response is received it will then send a REQUEST. OFFER, ACK, and NAK are all
considered valid responses in extendedMode.
Usage: |
required |
|
|
This parameter only applies to REQUEST queries sent to the DHCP server when
extendedMode is true. If an IP address is specified, that IP address will be
requested in the query. If |
required |
|
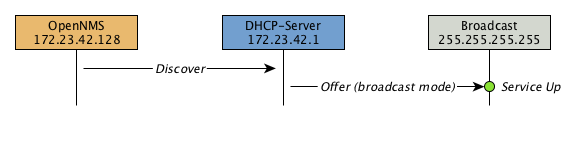
Example testing DHCP server in the same subnet
Example configuration how to configure the monitor in the 'poller-configuration.xml'. The monitor will try to send in maximum 3 DISCOVER messages and waits 3 seconds for the DHCP server OFFER message.
<service name="DHCP" interval="300000" user-defined="false" status="on">
 <parameter key="retry" value="2" />
 <parameter key="timeout" value="3000" />
 <parameter key="rrd-repository" value="/opt/opennms/share/rrd/response" />
 <parameter key="rrd-base-name" value="dhcp" />
 <parameter key="ds-name" value="dhcp" />
</service>

<monitor service="DHCP" class-name="org.opennms.protocols.dhcp.monitor.DhcpMonitor"/><service enabled="true">
<name>OpenNMS:Name=Dhcpd</name>
<class-name>org.opennms.netmgt.dhcpd.jmx.Dhcpd</class-name>
<invoke method="start" pass="1" at="start"/>
<invoke method="status" pass="0" at="status"/>
<invoke method="stop" pass="0" at="stop"/>
</service><DhcpdConfiguration
port="5818"
macAddress="00:06:0D:BE:9C:B2"
myIpAddress="broadcast
extendedMode="false"
requestIpAddress="127.0.0.1">
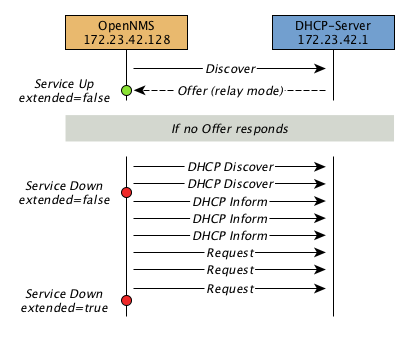
</DhcpdConfiguration>Example testing DHCP server in a different subnet in extended mode
You can use the same monitor in 'poller-configuration.xml' as in the example above.
myIpAddress.<DhcpdConfiguration
port="5818"
macAddress="00:06:0D:BE:9C:B2"
myIpAddress="10.4.1.234"
extendedMode="true"
requestIpAddress="targetSubnet">
</DhcpdConfiguration>
If in extendedMode, the time required to complete the poll for an unresponsive node is increased by a factor of 3.
Thus it is a good idea to limit the number of retries to a small number.
|
2.1.8. DiskUsageMonitor
The DiskUsageMonitor monitor can be used to test the amount of free space available on certain storages of a node.
The monitor gets information about the available free storage spaces available by inspecting the hrStorageTable of the HOST-RESOURCES-MIB.
A storage’s description (as found in the corresponding hrStorageDescr object) must match the criteria specified by the disk and match-type parameters to be monitored.
A storage’s available free space is calculated using the corresponding hrStorageSize and hrStorageUsed objects.
This monitor uses SNMP to accomplish its work. Therefore systems against which it is to be used must have an SNMP agent supporting the HOST-RESOURCES-MIB installed and configured. Most modern SNMP agents, including most distributions of the Net-SNMP agent and the SNMP service that ships with Microsoft Windows, support this MIB. Out-of-box support for HOST-RESOURCES-MIB among commercial Unix operating systems may be somewhat spotty.
Monitor facts
Class Name |
|
Remote Enabled |
false, relies on SNMP configuration. |
Configuration and Usage
| Parameter | Description | Required | Default value |
|---|---|---|---|
|
A pattern that a storage’s description (hrStorageDescr) must match to be taken into account. |
required |
|
|
The minimum amount of free space that storages matching the criteria must have available. This parameter is evaluated as a percent of the storage’s reported maximum capacity. |
optional |
|
|
The way how the pattern specified by the |
optional |
|
|
Destination port where the SNMP requests shall be sent. |
optional |
`from snmp-config.xml' |
|
Deprecated.
Same as |
optional |
|
|
Number of polls to attempt. |
optional |
|
|
Timeout in milliseconds for retrieving the values. |
optional |
|
Examples
<!-- Make sure there's at least 5% of free space available on storages ending with "/home" -->
<service name="DiskUsage-home" interval="300000" user-defined="false" status="on">
  <parameter key="timeout" value="3000" />
  <parameter key="retry" value="2" />
  <parameter key="disk" value="/home" />
  <parameter key="match-type" value="endsWith" />
  <parameter key="free" value="5" />
</service>
<monitor service="DiskUsage-home" class-name="org.opennms.netmgt.poller.monitors.DiskUsageMonitor" />
DiskUsageMonitor vs thresholds
Storages' available free space can also be monitored using thresholds if you are already collecting these data.
2.1.9. DnsMonitor
This monitor is build to test the availability of the DNS service on remote IP interfaces. The monitor tests the service availability by sending a DNS query for A resource record types against the DNS server to test.
The monitor is marked as up if the DNS Server is able to send a valid response to the monitor. For multiple records it is possible to test if the number of responses are within a given boundary.
The monitor can be simulated with the command line tool host:
~ % host -v -t a www.google.com 8.8.8.8
Trying "www.google.com"
Using domain server:
Name: 8.8.8.8
Address: 8.8.8.8#53
Aliases:

;; ->>HEADER<<- opcode: QUERY, status: NOERROR, id: 9324
;; flags: qr rd ra; QUERY: 1, ANSWER: 5, AUTHORITY: 0, ADDITIONAL: 0

;; QUESTION SECTION:
;www.google.com.			IN	A

;; ANSWER SECTION:
www.google.com.		283	IN	A	74.125.232.17
www.google.com.		283	IN	A	74.125.232.20
www.google.com.		283	IN	A	74.125.232.19
www.google.com.		283	IN	A	74.125.232.16
www.google.com.		283	IN	A	74.125.232.18

Received 112 bytes from 8.8.8.8#53 in 41 ms
TIP: This monitor is intended for testing the availability of a DNS service. If you want to monitor the DNS resolution of some of your nodes from a client’s perspective, please use the DNSResolutionMonitor.
Monitor facts
Class Name |
|
Remote Enabled |
true |
Configuration and Usage
| Parameter | Description | Required | Default value |
|---|---|---|---|
|
Number of retries before the service is marked as down |
optional |
|
|
Time in milliseconds to wait for the A Record response from the server |
optional |
|
|
UDP Port for the DNS server |
optional |
|
|
DNS A Record for lookup test |
optional |
|
|
A comma-separated list of numeric DNS response codes that will be considered fatal if
present in the server’s response. Default value is |
optional |
|
|
Minmal number of records in the DNS server respone for the given lookup |
optional |
|
|
Maximal number of records in the DNS server respone for the given lookup |
optional |
|
Examples
The given examples shows how to monitor if the IP interface from a given DNS server resolves a DNS request.
This service should be bound to a DNS server which should be able to give a valid DNS respone for DNS request www.google.com.
The service is up if the DNS server gives between 1 and 10 A record responses.
<service name="DNS-www.google.com" interval="300000" user-defined="false" status="on">
    <parameter key="lookup" value="www.google.com" />
    <parameter key="fatal-response-code" value="2" />
    <parameter key="min-answers" value="1" />
    <parameter key="max-answers" value="10" />
</service>

<monitor service="DNS-www.google.com" class-name="org.opennms.netmgt.poller.monitors.DnsMonitor" />
2.1.10. DNSResolutionMonitor
The DNS resolution monitor, tests if the node label of an OpenNMS node can be resolved. This monitor uses the name resolver configuration from the operating system where OpenNMS is running on. It can be used to test a client behavior for a given host name. For example: Create a node with the node label www.google.com and an IP interface. Assigning the DNS resolution monitor on the IP interface will test if www.google.com can be resolved using the DNS configuration of the underlying operating system. The response from the A record lookup can be any address, it is not verified with the IP address on the OpenNMS IP interface where the monitor is assigned to.
Monitor facts
Class Name |
|
Remote Enabled |
true |
Configuration and Usage
| Parameter | Description | Required | Default value |
|---|---|---|---|
|
Type of record for the node label test. |
optional |
|
|
Amount of attempts to resolve the node label before the service goes down |
required |
|
|
Time to wait for a A and/or AAAA record from the system configured DNS server before trying a next attempt. |
required |
|
Examples
The following example shows the possibilities monitoring IPv4 and/or IPv6 for the service configuration:
<!-- Assigned service test if the node label is resolved for an A record -->
<service name="DNS-Resolution-v4" interval="300000" user-defined="false" status="on">
    <parameter key="retry" value="2"/>
    <parameter key="timeout" value="2000"/>
    <parameter key="resolution-type" value="v4"/>
    <parameter key="rrd-repository" value="/opt/opennms/share/rrd/response"/>
    <parameter key="rrd-base-name" value="dns-res-v4"/>
    <parameter key="ds-name" value="dns-res-v4"/>
</service>

<!-- Assigned service test if the node label is resolved for an AAAA record -->
<service name="DNS-Resolution-v6" interval="300000" user-defined="false" status="on">
    <parameter key="retry" value="2"/>
    <parameter key="timeout" value="2000"/>
    <parameter key="resolution-type" value="v6"/>
    <parameter key="rrd-repository" value="/opt/opennms/share/rrd/response"/>
    <parameter key="rrd-base-name" value="dns-res-v6"/>
    <parameter key="ds-name" value="dns-res-v6"/>
</service>

<!-- Assigned service test if the node label is resolved for an AAAA record AND A record -->
<service name="DNS-Resolution-v4-and-v6" interval="300000" user-defined="false" status="on">
    <parameter key="retry" value="2"/>
    <parameter key="timeout" value="2000"/>
    <parameter key="resolution-type" value="both"/>
    <parameter key="rrd-repository" value="/opt/opennms/share/rrd/response"/>
    <parameter key="rrd-base-name" value="dns-res-both"/>
    <parameter key="ds-name" value="dns-res-both"/>
</service>

<!-- Assigned service test if the node label is resolved for an AAAA record OR A record -->
<service name="DNS-Resolution-v4-or-v6" interval="300000" user-defined="false" status="on">
    <parameter key="retry" value="2"/>
    <parameter key="timeout" value="2000"/>
    <parameter key="resolution-type" value="either"/>
    <parameter key="rrd-repository" value="/opt/opennms/share/rrd/response"/>
    <parameter key="rrd-base-name" value="dns-res-either"/>
    <parameter key="ds-name" value="dns-res-either"/>
</service>

<monitor service="DNS-Resolution-v4" class-name="org.opennms.netmgt.poller.monitors.DNSResolutionMonitor" />
<monitor service="DNS-Resolution-v6" class-name="org.opennms.netmgt.poller.monitors.DNSResolutionMonitor" />
<monitor service="DNS-Resolution-v4-and-v6" class-name="org.opennms.netmgt.poller.monitors.DNSResolutionMonitor" />
<monitor service="DNS-Resolution-v4-or-v6" class-name="org.opennms.netmgt.poller.monitors.DNSResolutionMonitor" />
To have response time graphs for the name resolution you have to configure RRD graphs for the given ds-names (dns-res-v4, dns-res-v6, dns-res-both, dns-res-either) in '$OPENNMS_HOME/etc/response-graph.properties'.
DNSResolutionMonitor vs DnsMonitor
The DNSResolutionMonitor is used to measure the availability and record outages of a name resolution from client perspective. The service is mainly used for websites or similar public available resources. It can be used in combination with the Page Sequence Monitor to give a hint if a website isn’t available for DNS reasons.
The DnsMonitor on the other hand is a test against a specific DNS server. In OpenNMS the DNS server is the node and the DnsMonitor will send a lookup request for a given A record to the DNS server IP address. The service goes down if the DNS server doesn’t have a valid A record in his zone database or as some other issues resolving A records.
2.1.11. FtpMonitor
The FtpMonitor is able to validate ftp connection dial-up processes. The monitor can test ftp server on multiple ports and specific login data.
The service using the FtpMonitor is up if the FTP server responds with return codes between 200 and 299. For special cases the service is also marked as up for 425 and 530.
Monitor facts
Class Name |
|
Remote Enabled |
|
Configuration and Usage
| Parameter | Description | Required | Default value |
|---|---|---|---|
|
Number of attempts to get a valid FTP response/response-text |
optional |
|
|
Timeout in milliseconds for TCP connection establishment. |
optional |
|
|
A list of TCP ports to which connection shall be tried. |
optional |
|
|
This parameter is meant to be used together with the |
optional |
|
|
This parameter is meant to be used together with the |
optional |
|
Examples
Some example configuration how to configure the monitor in the 'poller-configuration.xml'
<service name="FTP" interval="300000" user-defined="false" status="on">
 <parameter key="retry" value="1"/>
 <parameter key="timeout" value="3000"/>
 <parameter key="port" value="21"/>
 <parameter key="userid" value=""/>
 <parameter key="password" value=""/>
</service>

<service name="FTP-Customer" interval="300000" user-defined="false" status="on">
 <parameter key="retry" value="1"/>
 <parameter key="timeout" value="3000"/>
 <parameter key="port" value="21"/>
 <parameter key="userid" value="Customer"/>
 <parameter key="password" value="MySecretPassword"/>
</service>

<monitor service="FTP" class-name="org.opennms.netmgt.poller.monitors.FtpMonitor"/>
<monitor service="FTP-Customer" class-name="org.opennms.netmgt.poller.monitors.FtpMonitor"/>
Hint
Comment from FtpMonitor source
Also want to accept the following ERROR message generated by some FTP servers following a QUIT command without a previous successful login: "530 QUIT : User not logged in. Please login with USER and PASS first."
Also want to accept the following ERROR message generated by some FTP servers following a QUIT command without a previously successful login: "425 Session is disconnected."
See also: http://tools.ietf.org/html/rfc959
2.1.12. HostResourceSwRunMonitor
This monitor test the running state of one or more processes. It does this via SNMP by inspecting the hrSwRunTable of the HOST-RESOURCES-MIB. The test is done by matching a given process as hrSwRunName against the numeric value of the hrSwRunState.
This monitor uses SNMP to accomplish its work. Therefore systems against which it is to be used must have an SNMP agent installed and configured. Furthermore, the SNMP agent on the system must support the HOST-RESOURCES-MIB. Most modern SNMP agents, including most distributions of the Net-SNMP agent and the SNMP service that ships with Microsoft Windows, support this MIB. Out-of-box support for HOST-RESOURCES-MIB among commercial Unix operating systems may be somewhat spotty.
Monitor facts
Class Name |
|
Remote Enabled |
false |
Configuration and Usage
| Parameter | Description | Required | Default value |
|---|---|---|---|
|
The port of the SNMP agent of the server to test. |
optional |
|
|
Number of attempts to get a valid response before marking the service as down. |
optional |
|
|
Timeout in milliseonds wating for the SNMP response for the process run state from the agent. |
optional |
|
|
The name of the process to be monitored. This parameter’s value is case-sensitive and is evaluated as an exact match. |
required |
|
|
If the process name appears multiple times in the hrSwRunTable, and this parameter is set to
|
optional |
|
|
The maximum allowable value of hrSWRunStatus among |
optional |
|
|
The numeric object identifier (OID) from which process names are queried. Defaults to
hrSwRunName and should never be changed under normal
circumstances. That said, changing it to hrSwRunParameters ( |
optional |
|
|
The numeric object identifier (OID) from which run status is queried. Defaults to hrSwRunStatus and should never be changed under normal circumstances. |
optional |
|
Examples
The following example shows how to monitor the process called httpd running on a server using this monitor. The configuration in 'poller-configuration.xml' has to be defined as the following:
<service name="Process-httpd" interval="300000" user-defined="false" status="on">
    <parameter key="retry" value="3"/>
    <parameter key="timeout" value="3000"/>
    <parameter key="service-name" value="httpd"/>(1)
    <parameter key="run-level" value="3"/>(2)
    <parameter key="match-all" value="true"/>(3)
</service>

<monitor service="Process-httpd" class-name="org.opennms.netmgt.poller.monitors.HostResourceSwRunMonitor"/>| 1 | Name of the process on the system |
| 2 | Test the state if the process is in a valid state, i.e. have a run-level no higher than notRunnable(3) |
| 3 | If the httpd process runs multiple times the test is done for each instance of the process. |
2.1.13. HttpMonitor
The HTTP monitor tests the response of an HTTP server on a specific HTTP 'GET' command. During the poll, an attempt is made to connect on the specified port(s). The monitor can test web server on multiple ports. By default the a test is made against port 80, 8080 and 8888. If the connection request is successful, an HTTP 'GET' command is sent to the interface. The response is parsed and a return code extracted and verified.
Monitor facts
Class Name |
|
Remote Enabled |
true |
Configuration and Usage
| Parameter | Description | Required | Default value |
|---|---|---|---|
|
Authentication credentials to perform basic authentication. |
optional |
|
|
Additional headers to be sent along with the request. |
optional |
|
|
Specify the Host header’s value. |
optional |
|
|
If the |
optional |
|
|
This parameter is meant to be used together with the |
optional |
|
|
A list of TCP ports to which connection shall be tried. |
optional |
|
|
Number of attempts to get a valid HTTP response/response-text |
optional |
|
|
If the |
optional |
|
|
A comma-separated list of acceptable HTTP response code ranges.
Example: |
optional |
If the |
|
Text to look for in the response body. This will be matched against every line, and it |
optional |
|
|
Timeout in milliseconds for TCP connection establishment. |
optional |
|
|
URL to be retrieved via the HTTP 'GET' command |
optional |
|
|
This parameter is meant to be used together with the |
optional |
|
|
Allows you to set the User-Agent HTTP header (see also RFC2616 section 14.43). |
optional |
|
|
When set to true, full communication between client and the webserver will be logged |
optional |
|
Examples
<!-- Test HTTP service on port 80 only -->
<service name="HTTP" interval="300000" user-defined="false" status="on">
  <parameter key="retry" value="2"/>
  <parameter key="timeout" value="3000"/>
  <parameter key="port" value="80"/>
  <parameter key="url" value="/"/>
</service>

<!-- Test for virtual host opennms.com running -->
<service name="OpenNMSdotCom" interval="300000" user-defined="false" status="on">
  <parameter key="retry" value="1"/>
  <parameter key="timeout" value="3000"/>
  <parameter key="port" value="80"/>
  <parameter key="host-name" value="opennms.com"/>
  <parameter key="url" value="/solutions"/>
  <parameter key="response" value="200-202,299"/>
  <parameter key="response-text" value="~.*[Cc]onsulting.*"/>
</service>

<!-- Test for instance of OpenNMS 1.2.9 running -->
<service name="OpenNMS-129" interval="300000" user-defined="false" status="on">
  <parameter key="retry" value="1"/>
  <parameter key="timeout" value="3000"/>
  <parameter key="port" value="8080"/>
  <parameter key="url" value="/opennms/event/list"/>
  <parameter key="basic-authentication" value="admin:admin"/>
  <parameter key="response" value="200"/>
</service>

<monitor service="HTTP" class-name="org.opennms.netmgt.poller.monitors.HttpMonitor" />
<monitor service="OpenNMSdotCom" class-name="org.opennms.netmgt.poller.monitors.HttpMonitor" />
<monitor service="OpenNMS-129" class-name="org.opennms.netmgt.poller.monitors.HttpMonitor" />
Testing filtering proxies with HttpMonitor
If you have a filtering proxy server that is supposed to allow retrieval of some URLs but deny others, you can use the HttpMonitor to verify this behavior.
Let’s say that our proxy server is running on TCP port 3128, and that we should always be able to retrieve http://www.opennms.org/ but never http://www.myspace.com/ (hey, this is a workplace after all!). To test this behaviour, one could create the following service monitors:
<service name="HTTP-Allow-opennms.org" interval="300000" user-defined="false" status="on">
  <parameter key="retry" value="1"/>
  <parameter key="timeout" value="3000"/>
  <parameter key="port" value="3128"/>
  <parameter key="url" value="http://www.opennms.org/"/>
  <parameter key="response" value="200-399"/>
</service>

<service name="HTTP-Block-myspace.com" interval="300000" user-defined="false" status="on">
  <parameter key="retry" value="1"/>
  <parameter key="timeout" value="3000"/>
  <parameter key="port" value="3128"/>
  <parameter key="url" value="http://www.myspace.com/"/>
  <parameter key="response" value="400-599"/>
</service>

<monitor service="HTTP-Allow-opennms.org" class-name="org.opennms.netmgt.poller.monitors.HttpMonitor"/>
<monitor service="HTTP-Block-myspace.com" class-name="org.opennms.netmgt.poller.monitors.HttpMonitor"/>
2.1.14. HttpPostMonitor
If it is required to HTTP POST any arbitrary content to a remote URI, the HttpPostMonitor can be used. A use case is to HTTP POST to a SOAP endpoint.
Monitor facts
Class Name |
|
Remote Enabled |
|
Configuration and Usage
| Parameter | Description | Required | Default value |
|---|---|---|---|
|
The body of the POST, for example properly escaped XML. |
required |
|
|
The password to use for HTTP BASIC auth. |
optional |
|
|
The username to use for HTTP BASIC auth. |
optional |
|
|
A string that is matched against the response of the HTTP POST.
If the output contains the banner, the service is determined as up.
Specify a regex by starting with |
optional |
|
|
Set the character set for the POST. |
optional |
|
|
Set the mimetype for the POST. |
optional |
|
|
The port for the web server where the POST is send to. |
optional |
|
|
The connection scheme to use. |
optional |
|
|
Enables or disables the SSL ceritificate validation. |
optional |
|
|
The uri to use during the POST. |
optional |
|
Examples
The following example would create a POST that contains the payload Word.
<service name="MyServlet" interval="300000" user-defined="false" status="on">
  <parameter key="banner" value="Hello"/>
  <parameter key="port" value="8080"/>
  <parameter key="uri" value="/MyServlet">
  <parameter key="payload" value="World"/>
  <parameter key="retry" value="1"/>
  <parameter key="timeout" value="30000"/>
</service>
<monitor service="MyServlet" class-name="org.opennms.netmgt.poller.monitors.HttpPostMonitor"/>
The resulting POST looks like this:
POST /MyServlet HTTP/1.1
Content-Type: text/xml; charset=utf-8
Host: <ip_addr_of_interface>:8080
Connection: Keep-Alive

World
2.1.15. HttpsMonitor
The HTTPS monitor tests the response of an SSL-enabled HTTP server. The HTTPS monitor is an SSL-enabled extension of the HTTP monitor with a default TCP port value of 443. All HttpMonitor parameters apply, so please refer to HttpMonitor’s documentation for more information.
Monitor facts
Class Name |
|
Remote Enabled |
true |
Configuration and Usage
| Parameter | Description | Required | Default value |
|---|---|---|---|
|
A list of TCP ports to which connection shall be tried. |
optional |
|
Examples
<!-- Test HTTPS service on port 8443 -->
<service name="HTTPS" interval="300000" user-defined="false" status="on">
  <parameter key="retry" value="2"/>
  <parameter key="timeout" value="3000"/>
  <parameter key="port" value="8443"/>
  <parameter key="url" value="/"/>
</service>

<monitor service="HTTPS" class-name="org.opennms.netmgt.poller.monitors.HttpsMonitor" />
2.1.16. IcmpMonitor
The ICMP monitor tests for ICMP service availability by sending echo request ICMP messages. The service is considered available when the node sends back an echo reply ICMP message within the specified amount of time.
Monitor facts
Class Name |
|
Remote Enabled |
true with some restrictions (see below) |
Configuration and Usage
| Parameter | Description | Required | Default value |
|---|---|---|---|
|
Number of bytes of the ICMP packet to send. |
optional |
|
|
Number of attempts to get a response. |
optional |
|
|
Time in milliseconds to wait for a response. |
optional |
|
Examples
<service name="ICMP" interval="300000" user-defined="false" status="on">
  <parameter key="retry" value="2"/>
  <parameter key="timeout" value="3000"/>
  <parameter key="rrd-repository" value="/var/lib/opennms/rrd/response"/>
  <parameter key="rrd-base-name" value="icmp"/>
  <parameter key="ds-name" value="icmp"/>
</service>
<monitor service="ICMP" class-name="org.opennms.netmgt.poller.monitors.IcmpMonitor"/>
Note on Remote Poller
The IcmpMonitor needs the JNA ICMP implementation to function on remote poller. Though, corner cases exist where the IcmpMonitor monitor won’t work on remote poller. Examples of such corner cases are: Windows when the remote poller isn’t running has administrator, and Linux on ARM / Rasperry Pi. JNA is the default ICMP implementation used in the remote poller.
2.1.17. ImapMonitor
This monitor checks if an IMAP server is functional. The test is done by initializing a very simple IMAP conversation. The ImapMonitor establishes a TCP connection, sends a logout command and test the IMAP server responses.
The behavior can be simulated with telnet:
telnet mail.myserver.de 143
Trying 62.108.41.197...
Connected to mail.myserver.de.
Escape character is '^]'.
* OK [CAPABILITY IMAP4rev1 LITERAL+ SASL-IR LOGIN-REFERRALS ID ENABLE IDLE STARTTLS LOGINDISABLED] Dovecot ready. (1)
ONMSPOLLER LOGOUT (2)
* BYE Logging out (3)
ONMSPOLLER OK Logout completed.
Connection closed by foreign host.
| 1 | Test IMAP server banner, it has to start * OK to be up |
| 2 | Sending a ONMSPOLLER LOGOUT |
| 3 | Test server responds with, it has to start with * BYE to be up |
If one of the tests in the sample above fails the service is marked down.
Monitor facts
Class Name |
|
Remote Enabled |
false |
Configuration and Usage
| Parameter | Description | Required | Default value |
|---|---|---|---|
|
Number of attempts to get a valid IMAP response |
optional |
|
|
Time in milliseconds to wait retrieving the banner from TCP connection before trying a next attempt. |
optional |
|
|
The port of the IMAP server. |
optional |
|
Examples
Some example configuration how to configure the monitor in the poller-configuration.xml
<!-- Test IMAP service on port 143 only -->
<service name="IMAP" interval="300000" user-defined="false" status="on">
  <parameter key="retry" value="1"/>
  <parameter key="port" value="143"/>
  <parameter key="timeout" value="3000"/>
</service>

<monitor service="IMAP" class-name="org.opennms.netmgt.poller.monitors.ImapMonitor" />
2.1.18. JCifsMonitor
This monitor allows to test a file sharing service based on the CIFS/SMB protocol.
This monitor is not installed by default.
You have to install opennmms-plugin-protocol-cifs from your OpenNMS installation repository.
|
With the JCIFS monitor you have different possibilities to test the availability of the JCIFS service:
With the JCifsMonitor it is possible to run tests for the following use cases:
-
share is available in the network
-
a given file exists in the share
-
a given folder exists in the share
-
a given folder should contain at least one (1) file
-
a given folder folder should contain no (0) files
-
by testing on files and folders, you can use a regular expression to ignore specific file and folder names from the test
A network resource in SMB like a file or folder is addressed as a UNC Path.
\\server\share\folder\file.txt
The Java implementation jCIFS, which implements the CIFS/SMB network protocol, uses SMB URLs to access the network resource. The same resource as in our example would look like this as an SMB URL:
smb://workgroup;user:password@server/share/folder/file.txt
The JCifsMonitor can not test:
-
file contains specific content
-
a specific number of files in a folder, for example folder should contain exactly / more or less than x files
-
Age or modification time stamps of files or folders
-
Permissions or other attributes of files or folders
Monitor facts
Class Name |
|
Remote Enabled |
false |
Configuration and Usage
| Parameter | Description | Required | Default value |
|---|---|---|---|
|
Number of retries before the service is marked as down. |
optional |
|
|
Time in milliseconds to wait for the SMB service. |
optional |
|
|
Windows domain where the user is located. You don’t have to use the domain parameter if you use local user accounts. |
optional |
empty String |
|
Username to access the resource over a network |
optional |
empty String |
|
Password for the user |
optional |
empty String |
|
Path to the resource you want to test |
required |
empty String |
|
The test mode which has the following options |
optional |
|
|
Override the IP address of the SMB url to check shares on different file servers. |
optional |
empty String |
|
Ignore specific files in folder with regular expression. This parameter will just be applied on
|
optional |
|
It makes little sense to have retries higher than 1.
It is a waste of resources during the monitoring.
|
Please consider, if you are accessing shares with Mac OSX you have some side effects with the hidden file '.DS_Store.'
It could give you false positives in monitoring, you can use then the folderIgnoreFiles parameter.
|
Example test existence of a file
This example shows how to configure the JCifsMonitor to test if a file share is available over a network. For this example we have access to a share for error logs and we want to get an outage if we have any error log files in our folder. The share is named 'log'. The service should go back to normal if the error log file is deleted and the folder is empty.
<service name="CIFS-ErrorLog" interval="30000" user-defined="true" status="on">
    <parameter key="retry" value="1" />
    <parameter key="timeout" value="3000" />
    <parameter key="domain" value="contoso" />(1)
    <parameter key="username" value="MonitoringUser" />(2)
    <parameter key="password" value="MonitoringPassword" />(3)
    <parameter key="path" value="/fileshare/log/" />(4)
    <parameter key="mode" value="folder_empty" />(5)
</service>

<monitor service="CIFS-ErrorLog" class-name="org.opennms.netmgt.poller.monitors.JCifsMonitor" />| 1 | Name of the SMB or Microsoft Windows Domain |
| 2 | User for accessing the share |
| 3 | Password for accessing the share |
| 4 | Path to the folder inside of the share as part of the SMB URL |
| 5 | Mode is set to folder_empty |
2.1.19. JDBCMonitor
The JDBCMonitor checks that it is able to connect to a database and checks if it is able to get the database catalog from that database management system (DBMS). It is based on the JDBC technology to connect and communicate with the database.
Monitor facts
Class Name |
|
Remote Enabled |
true |
Configuration and Usage
| Parameter | Description | Required | Default value |
|---|---|---|---|
|
JDBC driver class to use |
required |
|
|
JDBC Url to connect to. |
required |
|
|
Database user |
required |
|
|
Database password |
required |
|
|
Timeout in ms for the database connection |
optional |
|
|
How many retries should be performed before failing the test |
optional |
|
| The OPENNMS_JDBC_HOSTNAME is replaced in the url parameter the IP or resolved hostname of the interface the monitored service is assigned to. |
Provide the database driver
The JDBCMonitor is based on JDBC and requires a JDBC driver to communicate with any database.
Due to the fact that OpenNMS itself uses a PostgreSQL database, the PostgreSQL JDBC driver is available out of the box.
For all other database systems a compatible JDBC driver has to be provided to OpenNMS as a jar-file.
To provide a JDBC driver place the driver-jar in the opennms/lib folder of your OpenNMS.
To use the JDBCMonitor from a remote poller, the driver-jar has to be provided to the Remote Poller too.
This may be tricky or impossible when using the Java Webstart Remote Poller, because of code signing requirements.
Examples
The following example checks if the PostgreSQL database used by OpenNMS is available.
<service name="OpenNMS-DBMS" interval="30000" user-defined="true" status="on">
  <parameter key="driver" value="org.postgresql.Driver"/>
  <parameter key="url" value="jdbc:postgresql://OPENNMS_JDBC_HOSTNAME:5432/opennms"/>
  <parameter key="user" value="opennms"/>
  <parameter key="password" value="opennms"/>
</service>

<monitor service="OpenNMS-DBMS" class-name="org.opennms.netmgt.poller.monitors.JDBCMonitor" />
2.1.20. JDBCStoredProcedureMonitor
The JDBCStoredProcedureMonitor checks the result of a stored procedure in a remote database. The result of the stored procedure has to be a boolean value (representing true or false). The service associated with this monitor is marked as up if the stored procedure returns true and it is marked as down in all other cases. It is based on the JDBC technology to connect and communicate with the database.
Monitor facts
Class Name |
|
Remote Enabled |
false |
Configuration and Usage
| Parameter | Description | Required | Default value |
|---|---|---|---|
|
JDBC driver class to use |
required |
|
|
JDBC Url to connect to. |
required |
|
|
Database user |
required |
|
|
Database password |
required |
|
|
Timeout in ms for the database connection |
optional |
|
|
How many retries should be performed before failing the test |
optional |
|
|
Name of the database stored procedure to call |
required |
|
|
Name of the database schema in which the stored procedure is |
optional |
|
| The OPENNMS_JDBC_HOSTNAME is replaced in the url parameter the IP or resolved hostname of the interface the monitored service is assigned to. |
Provide the database driver
The JDBCStoredProcedureMonitor is based on JDBC and requires a JDBC driver to communicate with any database.
Due to the fact that OpenNMS itself uses a PostgreSQL database, the PostgreSQL JDBC driver is available out of the box.
For all other database systems a compatible JDBC driver has to be provided to OpenNMS as a jar-file.
To provide a JDBC driver place the driver-jar in the opennms/lib folder of your OpenNMS.
To use the JDBCStoredProcedureMonitor from a remote poller, the driver-jar has to be provided to the Remote Poller too.
This may be tricky or impossible when using the Java Webstart Remote Poller, because of code signing requirements.
Examples
The following example checks a stored procedure added to the PostgreSQL database used by OpenNMS. The stored procedure returns true as long as less than 250000 events are in the events table of OpenNMS.
Stored procedure
CREATE OR REPLACE FUNCTION eventlimit_sp() RETURNS boolean AS
$BODY$DECLARE
num_events integer;
BEGIN
	SELECT COUNT(*) into num_events from events;
	RETURN num_events > 250000;
END;$BODY$
LANGUAGE plpgsql VOLATILE NOT LEAKPROOF
COST 100;
<service name="OpenNMS-DB-SP-Event-Limit" interval="300000" user-defined="true" status="on">
<parameter key="driver" value="org.postgresql.Driver"/>
<parameter key="url" value="jdbc:postgresql://OPENNMS_JDBC_HOSTNAME:5432/opennms"/>
<parameter key="user" value="opennms"/>
<parameter key="password" value="opennms"/>
<parameter key="stored-procedure" value="eventlimit_sp"/>
<parameter key="schema" value="public"/>
</service>
<monitor service="OpenNMS-DB-SP-Event-Limit" class-name="org.opennms.netmgt.poller.monitors.JDBCStoredProcedureMonitor"/>2.1.21. JDBCQueryMonitor
The JDBCQueryMonitor runs an SQL query against a database and is able to verify the result of the query. A read-only connection is used to run the SQL query, so the data in the database is not altered. It is based on the JDBC technology to connect and communicate with the database.
Monitor facts
Class Name |
|
Remote Enabled |
false |
Configuration and Usage
| Parameter | Description | Required | Default value |
|---|---|---|---|
|
JDBC driver class to use |
required |
|
|
JDBC URL to connect to. |
required |
|
|
Database user |
required |
|
|
Database password |
required |
|
|
The SQL query to run |
required |
|
|
What evaluation action to perform |
required |
|
|
The result column to evaluate against |
optional |
|
|
Operator to use for the evaluation |
required |
|
|
The operand to compare against the SQL query result |
required |
depends on the action |
|
The message to use if the service is down. Both operands and the operator are added to the message too. |
optional |
generic message depending on the action |
|
Timeout in ms for the database connection |
optional |
|
|
How many retries should be performed before failing the test |
optional |
|
| The OPENNMS_JDBC_HOSTNAME is replaced in the url parameter with the IP or resolved hostname of the interface the monitored service is assigned to. |
| Parameter | Description | Default operand |
|---|---|---|
|
The number of returned rows is compared, not a value of the resulting rows |
|
|
Strings are always checked for equality with the operand |
|
|
An integer from a column of the first result row is compared |
|
| Parameter | XML entity to use in XML configs |
|---|---|
|
|
|
|
|
|
|
|
|
|
|
|
Evaluating the action - operator - operand
Only the first result row returned by the SQL query is evaluated. The evaluation can be against the value of one column or the number of rows returned by the SQL query.
Provide the database driver
The JDBCQueryMonitor is based on JDBC and requires a JDBC driver to communicate with any database.
Due to the fact that OpenNMS itself uses a PostgreSQL database, the PostgreSQL JDBC driver is available out of the box.
For all other database systems a compatible JDBC driver has to be provided to OpenNMS as a jar-file.
To provide a JDBC driver place the driver-jar in the opennms/lib folder of your OpenNMS.
To use the JDBCQueryMonitor from a remote poller, the driver-jar has to be provided to the Remote Poller too.
This may be tricky or impossible when using the Java Webstart Remote Poller, because of code signing requirements.
Examples
The following example checks if the number of events in the OpenNMS database is fewer than 250000.
<service name="OpenNMS-DB-Event-Limit" interval="30000" user-defined="true" status="on">
<parameter key="driver" value="org.postgresql.Driver"/>
<parameter key="url" value="jdbc:postgresql://OPENNMS_JDBC_HOSTNAME:5432/opennms"/>
<parameter key="user" value="opennms"/>
<parameter key="password" value="opennms"/>
<parameter key="query" value="select eventid from events" />
<parameter key="action" value="row_count" />
<parameter key="operand" value="250000" />
<parameter key="operator" value="<" />
<parameter key="message" value="too many events in OpenNMS database" />
</service>
<monitor service="OpenNMS-DB-Event-Limit" class-name="org.opennms.netmgt.poller.monitors.JDBCQueryMonitor" />2.1.22. JolokiaBeanMonitor
The JolokiaBeanMonitor is a JMX monitor specialized for the use with the Jolokia framework. If it is required to execute a method via JMX or poll an attribute via JMX, the JolokiaBeanMonitor can be used. It requires a fully installed and configured Jolokia agent to be deployed in the JVM container. If required it allows attribute names, paths, and method parameters to be provided additional arguments to the call. To determine the status of the service the JolokiaBeanMonitor relies on the output to be matched against a banner. If the banner is part of the output the status is interpreted as up. If the banner is not available in the output the status is determined as down. Banner matching supports regular expression and substring match.
Monitor facts
Class Name |
|
Remote Enabled |
false |
Configuration and Usage
| Parameter | Description | Required | Default value |
|---|---|---|---|
|
The bean name to query against. |
required |
|
|
The name of the JMX attribute to scrape. |
optional ( |
|
|
The attribute path. |
optional |
|
|
The username to use for HTTP BASIC auth. |
optional |
|
|
The password to use for HTTP BASIC auth. |
optional |
|
|
A string that is match against the output of the system-call. If the output contains the banner, |
optional |
|
|
Method input |
optional |
|
|
Method input |
optional |
|
|
The name of the bean method to execute, output will be compared to banner. |
optional ( |
|
|
The port of the jolokia agent. |
optional |
|
|
The jolokia agent url. Defaults to "http://<ipaddr>:<port>/jolokia" |
optional |
|
| Variable | Description |
|---|---|
|
IP-address of the interface the service is bound to. |
|
Port the service it bound to. |
Examples
Some example configuration how to configure the monitor in the poller-configuration.xml
<parameter key="url" value="http://${ipaddr}:${port}/jolokia"/>
<parameter key="url" value="https://${ipaddr}:${port}/jolokia"/>
AttrName vs MethodName
The JolokiaBeanMonitor has two modes of operation. It can either scrape an attribute from a bean, or execute a method and compare output to a banner. The method execute is useful when your application has it’s own test methods that you would like to trigger via OpenNMS.
The args to execute a test method called "superTest" that take in a string as input would look like this:
<parameter key="beanname" value="MyBean" />
<parameter key="methodname" value="superTest" />
<parameter key="input1" value="someString"/>
The args to scrape an attribute from the same bean would look like this:
<parameter key="beanname" value="MyBean" />
<parameter key="attrname" value="upTime" />
2.1.23. LdapMonitor
The LDAP monitor tests for LDAP service availability. The LDAP monitor first tries to establish a TCP connection on the specified port. Then, if it succeeds, it will attempt to establish an LDAP connection and do a simple search. If the search returns a result within the specified timeout and attempts, the service will be considered available. The scope of the LDAP search is limited to the immediate subordinates of the base object. The LDAP search is anonymous by default. The LDAP monitor makes use of the com.novell.ldap.LDAPConnection class.
Monitor facts
Class Name |
|
Remote Enabled |
true |
Configuration and Usage
| Parameter | Description | Required | Default value |
|---|---|---|---|
|
The distinguished name to use if authenticated search is needed. |
optional |
|
|
The password to use if authenticated search is needed. |
optional |
|
|
The destination port where connection shall be attempted. |
optional |
|
|
Number of attempts to get a search result. |
optional |
|
|
The base distinguished name to search from. |
optional |
|
|
The LDAP search’s filter. |
optional |
|
|
Time in milliseconds to wait for a result from the search. |
optional |
|
|
The version of the LDAP protocol to use, specified as an integer. Note: Only LDAPv3 is supported at the moment. |
optional |
|
Examples
<--! OpenNMS.org -->
<service name="LDAP" interval="300000" user-defined="false" status="on">
  <parameter key="port" value="389"/>
  <parameter key="version" value="3"/>
  <parameter key="searchbase" value="dc=opennms,dc=org"/>
  <parameter key="searchfilter" value="uid=ulf"/>
  <parameter key="retry" value="2"/>
  <parameter key="timeout" value="3000"/>
  <parameter key="rrd-repository" value="/var/lib/opennms/rrd/response"/>
  <parameter key="rrd-base-name" value="ldap"/>
  <parameter key="ds-name" value="ldap"/>
</service>
<monitor service="LDAP" class-name="org.opennms.netmgt.poller.monitors.LdapMonitor"/>
2.1.24. LdapsMonitor
The LDAPS monitor tests the response of an SSL-enabled LDAP server. The LDAPS monitor is an SSL-enabled extension of the LDAP monitor with a default TCP port value of 636. All LdapMonitor parameters apply, so please refer to LdapMonitor’s documentation for more information.
Monitor facts
Class Name |
|
Remote Enabled |
true |
Configuration and Usage
| Parameter | Description | Required | Default value |
|---|---|---|---|
|
The destination port where connections shall be attempted. |
optional |
|
Examples
<!-- LDAPS service at OpenNMS.org is on port 6636 -->
<service name="LDAPS" interval="300000" user-defined="false" status="on">
  <parameter key="port" value="6636"/>
  <parameter key="version" value="3"/>
  <parameter key="searchbase" value="dc=opennms,dc=org"/>
  <parameter key="searchfilter" value="uid=ulf"/>
  <parameter key="retry" value="2"/>
  <parameter key="timeout" value="3000"/>
  <parameter key="rrd-repository" value="/var/lib/opennms/rrd/response"/>
  <parameter key="rrd-base-name" value="ldap"/>
  <parameter key="ds-name" value="ldap"/>
</service>

<monitor service="LDAPS" class-name="org.opennms.netmgt.poller.monitors.LdapsMonitor" />
2.1.25. MemcachedMonitor
This monitor allows to monitor Memcached, a distributed memory object caching system. To monitor the service availability the monitor tests if the Memcached statistics can be requested. The statistics are processed and stored in RRD files. The following metrics are collected:
| Metric | Description |
|---|---|
uptime |
Seconds the Memcached server has been running since last restart. |
rusageuser |
User time seconds for the server process. |
rusagesystem |
System time seconds for the server process. |
curritems |
Number of items in this servers cache. |
totalitems |
Number of items stored on this server. |
bytes |
Number of bytes currently used for caching items. |
limitmaxbytes |
Maximum configured cache size. |
currconnections |
Number of open connections to this Memcached. |
totalconnections |
Number of successful connect attempts to this server since start. |
connectionstructure |
Number of internal connection handles currently held by the server. |
cmdget |
Number of GET commands received since server startup. |
cmdset |
Number of SET commands received since server startup. |
gethits |
Number of successful GET commands (cache hits) since startup. |
getmisses |
Number of failed GET requests, because nothing was cached. |
evictions |
Number of objects removed from the cache to free up memory. |
bytesread |
Number of bytes received from the network. |
byteswritten |
Number of bytes send to the network. |
threads |
Number of threads used by this server. |
Monitor facts
Class Name |
|
Remote Enabled |
true |
Configuration and Usage
| Parameter | Description | Required | Default value |
|---|---|---|---|
|
Timeout in milliseconds for Memcached connection establishment. |
optional |
|
|
Number of attempts to establish the Memcached connnection. |
optional |
|
|
TCP port connecting to Memcached. |
optional |
|
Examples
The following example shows a configuration in the 'poller-configuration.xml'.
<service name="Memcached" interval="300000" user-defined="false" status="on">
  <parameter key="port" value="11211" />
  <parameter key="retry" value="2" />
  <parameter key="timeout" value="3000" />
  <parameter key="rrd-repository" value="/opt/opennms/share/rrd/response" />
  <parameter key="ds-name" value="memcached" />
  <parameter key="rrd-base-name" value="memcached" />
</service>

<monitor service="Memcached" class-name="org.opennms.netmgt.poller.monitors.MemcachedMonitor" />
2.1.26. NetScalerGroupHealthMonitor
This monitor is designed for Citrix® NetScaler® loadbalancing checks. It checks if more than x percent of the servers assigned to a specific group on a loadbalanced service are active. The required data is gathered via SNMP from the NetScaler®. The status of the servers is determined by the NetScaler®. The provided service it self is not part of the check. The basis of this monitor is the SnmpMonitorStrategy. A valid SNMP configuration in OpenNMS for the NetScaler® is required.
| A NetScaler® can manage several groups of servers per application. This monitor just covers one group at a time. If there are multiple groups to check, define one monitor per group. |
| This monitor is not checking the loadbalanced service it self. |
Monitor facts
Class Name |
|
Remote Enabled |
false |
Configuration and Usage
| Parameter | Description | Required | Default value |
|---|---|---|---|
|
The name of the server group to check |
required |
|
|
The percentage of active servers vs total server of the group as an integer |
optional |
|
Examples
The following example checks a server group called central_webfront_http. If at least 70% of the servers are active, the service is up. If less then 70% of the servers are active the service is down. A configuration like the following can be used for the example in the 'poller-configuration.xml'.
<service name="NetScaler_Health" interval="300000" user-defined="false" status="on">
   <parameter key="group-name" value="central_webfront_http" />
   <parameter key="group-health" value="70" />
</service>

<monitor service="NetScaler_Health" class-name="org.opennms.netmgt.poller.monitors.NetScalerGroupHealthMonitor” />
Details about the used SNMP checks
The monitor checks the status of the server group based on the NS-ROOT-MIB using the svcGrpMemberState.
svcGrpMemberState is part of the serviceGroupMemberTable.
The serviceGroupMemberTable is indexed by svcGrpMemberGroupName and svcGrpMemberName.
A initial lookup for the group-name is performed.
Based on the lookup the serviceGroupMemberTable is walked with the numeric representation of the server group.
The monitor interprets just the server status code 7-up as active server.
Other status codes like 2-unknown or 3-busy are counted for total amount of servers.
2.1.27. NtpMonitor
The NTP monitor tests for NTP service availability. During the poll an NTP request query packet is generated. If a response is received, it is parsed and validated. If the response is a valid NTP response, the service is considered available.
Monitor facts
Class Name |
|
Remote Enabled |
true |
Configuration and Usage
| Parameter | Description | Required | Default value |
|---|---|---|---|
|
The destination port where the NTP request shall be sent. |
optional |
|
|
Number of attempts to get a response. |
optional |
|
|
Time in milliseconds to wait for a response. |
optional |
|
Examples
<--! Fast NTP server -->
<service name="NTP" interval="300000" user-defined="false" status="on">
  <parameter key="retry" value="2"/>
  <parameter key="timeout" value="1000"/>
  <parameter key="rrd-repository" value="/var/lib/opennms/rrd/response"/>
  <parameter key="rrd-base-name" value="ntp"/>
  <parameter key="ds-name" value="ntp"/>
</service>
<monitor service="NTP" class-name="org.opennms.netmgt.poller.monitors.NtpMonitor"/>
2.1.28. OmsaStorageMonitor
With OmsaStorageMonitor you are able to monitor your Dell OpenManaged servers RAID array status. The following OIDS from the STORAGEMANAGEMENT-MIB are supported by this monitor:
virtualDiskRollUpStatus                     .1.3.6.1.4.1.674.10893.1.20.140.1.1.19
arrayDiskLogicalConnectionVirtualDiskNumber .1.3.6.1.4.1.674.10893.1.20.140.3.1.5
arrayDiskNexusID                            .1.3.6.1.4.1.674.10893.1.20.130.4.1.26
arrayDiskLogicalConnectionArrayDiskNumber   .1.3.6.1.4.1.674.10893.1.20.140.3.1.3
arrayDiskState                              .1.3.6.1.4.1.674.10893.1.20.130.4.1.4
To test the status of the disk array the virtualDiskRollUpStatus is used.
If the result of the virtualDiskRollUpStatus is not 3 the monitors is marked as down.
| Result | State description | Monitor state in OpenNMS |
|---|---|---|
|
other |
DOWN |
|
unknown |
DOWN |
|
ok |
UP |
|
non-critical |
DOWN |
|
critical |
DOWN |
|
non-recoverable |
DOWN |
| You’ll need to know the maximum number of possible logical disks you have in your environment. For example: If you have 3 RAID arrays, you need for each logical disk array a service poller. |
To give more detailed information in case of an disk array error, the monitor tries to identify the problem using the other OIDs. This values are used to enrich the error reason in the service down event. The disk array state is resolved to a human readable value by the following status table.
| Value | Status |
|---|---|
|
Ready |
|
Failed |
|
Online |
|
Offline |
|
Degraded |
|
Recovering |
|
Removed |
|
Resynching |
|
Rebuilding |
|
noMedia |
|
Formating |
|
Running Diagnostics |
|
Initializing |
Monitor facts
Class Name |
|
Remote Enabled |
|
Configuration and Usage
Monitor specific parameters for the OmsaStorageMonitor
| Parameter | Description | Required | Default value |
|---|---|---|---|
|
The disk index of your RAID array |
optional |
|
|
Amount of attempts opening a connection and try to get the greeting banner before the service goes down. |
optional |
|
|
Time in milliseconds to wait before receiving the SNMP response. |
optional |
|
|
The TCP port OpenManage is listening |
optional |
|
Examples
Some example configuration how to configure the monitor in the 'poller-configuration.xml'.
The RAID array monitor for your first array is configured with virtualDiskNumber = 1 and can look like this:
<service name="OMSA-Disk-Array-1" interval="300000" user-defined="false" status="on">
 <parameter key="retry" value="3"/>
 <parameter key="timeout" value="6000"/>
 <parameter key="virtualDiskNumber" value="1"/>
</service>

<monitor service="OMSA-Disk-Array-1" class-name="org.opennms.netmgt.poller.monitors.OmsaStorageMonitor"/>
If there is more than one RAID array to monitor you need an additional configuration. In this case virtualDiskNumber = 2. And so on…
<service name="OMSA-Disk-Array-2" interval="300000" user-defined="false" status="on">
 <parameter key="retry" value="3"/>
 <parameter key="timeout" value="6000"/>
 <parameter key="virtualDiskNumber" value="2"/>
</service>

<monitor service="OMSA-Disk-Array-2" class-name="org.opennms.netmgt.poller.monitors.OmsaStorageMonitor"/>
2.1.29. OpenManageChassisMonitor
The OpenManageChassis monitor tests the status of a Dell chassis by querying its SNMP agent. The monitor polls the value of the node’s SNMP OID .1.3.6.1.4.1.674.10892.1.300.10.1.4.1 (MIB-Dell-10892::chassisStatus). If the value is OK (3), the service is considered available.
As this monitor uses SNMP, the queried nodes must have proper SNMP configuration in snmp-config.xml.
Monitor facts
Class Name |
|
Remote Enabled |
false |
Configuration and Usage
| Parameter | Description | Required | Default value |
|---|---|---|---|
|
The port to which connection shall be tried. |
optional |
|
|
Number of polls to attempt. |
optional |
|
|
Time (in milliseconds) to wait before receiving the SNMP response. |
optional |
|
Examples
<!-- Overriding default SNMP config -->
<service name="OMA-Chassis" interval="300000" user-defined="false" status="on">
  <parameter key="retry" value="3"/>
  <parameter key="timeout" value="5000"/>
</service>

<monitor service="OMA-Chassis" class-name="org.opennms.netmgt.poller.monitors.OpenManageChassisMonitor" />
Dell MIBs
Dell MIBs can be found here. Download the DCMIB<version>.zip or DCMIB<version>.exe file corresponding to the version of your OpenManage agents. The latest one should be good enough for all previous version though.
2.1.30. Pop3Monitor
The POP3 monitor tests for POP3 service availability on a node. The monitor first tries to establish a TCP connection on the specified port. If a connection is established, a service banner should have been received. The monitor makes sure the service banner is a valid POP3 banner (ie: starts with "+OK"). If the banner is valid, the monitor sends a QUIT POP3 command and makes sure the service answers with a valid response (ie: a response that starts with "+OK"). The service is considered available if the service’s answer to the QUIT command is valid.
The behaviour can be simulated with telnet:
$ telnet mail.opennms.org 110
Trying 192.168.0.100
Connected to mail.opennms.org.
Escape character is '^]'.
+OK <21860.1076718099@mail.opennms.org>
quit
+OK
Connection closed by foreign host.
Monitor facts
Class Name |
|
Remote Enabled |
true |
Configuration and Usage
| Parameter | Description | Required | Default value |
|---|---|---|---|
|
TCP port to connect to. |
optional |
|
|
Number of attempts to find the service available. |
optional |
|
|
Boolean
If set to |
optional |
|
|
Timeout in milliseconds for the underlying socket’s connect and read operations. |
optional |
|
Examples
<service name="POP3" interval="300000" user-defined="false" status="on">
  <parameter key="retry" value="2"/>
  <parameter key="timeout" value="3000"/>
  <parameter key="rrd-repository" value="/var/lib/opennms/rrd/response"/>
  <parameter key="rrd-base-name" value="pop3"/>
  <parameter key="ds-name" value="pop3"/>
</service>
<monitor service="POP3" class-name="org.opennms.netmgt.poller.monitors.Pop3Monitor"/>
2.1.31. PrTableMonitor
The PrTableMonitor monitor tests the prTable of a net-snmp SNMP agent.
A table containing information on running programs/daemons configured for monitoring in the snmpd.conf file of the agent. Processes violating the number of running processes required by the agent’s configuration file are flagged with numerical and textual errors.
The monitor looks up the prErrorFlag entries of this table. If the value of a prErrorFlag entry in this table is set to "1" the service is considered unavailable.
A Error flag to indicate trouble with a process. It goes to 1 if there is an error, 0 if no error.
Monitor facts
Class Name |
|
Remote Enabled |
false |
Configuration and Usage
| Parameter | Description | Required | Default value |
|---|---|---|---|
|
The port to which connection shall be tried. |
optional |
from 'snmp-config.xml' |
|
Number of polls to attempt. |
optional |
from 'snmp-config.xml' |
|
Deprecated.
Same as |
optional |
from 'snmp-config.xml' |
|
Time in milliseconds to wait before receiving the SNMP response. |
optional |
from 'snmp-config.xml' |
Examples
<!-- Overriding default SNMP config -->
<service name="Process-Table" interval="300000" user-defined="false" status="on">
  <parameter key="retry" value="3"/>
  <parameter key="timeout" value="5000"/>
</service>

<monitor service="Process-Table" class-name="org.opennms.netmgt.poller.monitors.PrTableMonitor" />
UCD-SNMP-MIB
The UCD-SNMP-MIB may be found here.
2.1.32. SmbMonitor
This monitor is used to test the NetBIOS over TCP/IP name resolution in Microsoft Windows environments. The monitor tries to retrieve a NetBIOS name for the IP address of the interface. Name services for NetBIOS in Microsoft Windows are provided on port 137/UDP or 137/TCP.
The service uses the IP address of the interface, where the monitor is assigned to. The service is up if for the given IP address a NetBIOS name is registered and can be resolved.
For troubleshooting see the usage of the Microsoft Windows command line tool nbtstat or on Linux nmblookup.
| Microsoft deprecated the usage of NetBIOS. Since Windows Server 2000 DNS is used as the default name resolution. |
Monitor facts
Class Name |
|
Remote Enabled |
false |
Configuration and Usage
| Parameter | Description | Required | Default value |
|---|---|---|---|
|
Number of attempts to get a valid response |
required |
|
|
Timeout in milliseconds for TCP connection establishment |
required |
|
|
Try to get the NetBIOS node status type for the given address |
optional |
|
Examples
Some example configuration how to configure the monitor in the 'poller-configuration.xml'.
<service name="SMB" interval="300000" user-defined="false" status="on">
  <parameter key="retry" value="1"/>
  <parameter key="timeout" value="3000"/>
</service>

<monitor service="SMB" class-name="org.opennms.netmgt.poller.monitors.SmbMonitor"/>
2.1.33. SnmpMonitor
The SNMP monitor gives a generic possibility to monitor states and results from SNMP agents. This monitor has two basic operation modes:
-
Test the response value of one specific OID (scalar object identifier);
-
Test multiple values in a whole table.
To decide which mode should be used, the walk and match-all parameters are used.
See the Operating mode selection'' and Monitor specific parameters for the SnmpMonitor'' tables below for more information about these operation modes.
| walk | match-all | Operating mode |
|---|---|---|
|
|
tabular, all values must match |
|
tabular, any value must match |
|
|
specifies that the value of at least minimum and at most maximum objects encountered in |
|
|
|
scalar |
|
scalar |
|
|
tabular, between |
| This monitor can’t be used on the OpenNMS Remote Poller. It is currently not possible for the Remote Poller to have access to the SNMP configuration of a central OpenNMS. |
Monitor facts
Class Name |
|
Remote Enabled |
false |
Configuration and Usage
| Parameter | Description | Required | Default value |
|---|---|---|---|
|
Specifies that the value monitored should be compared against its hexadecimal representation. Useful when the monitored value is a string containing non-printable characters. |
optional |
|
|
Can be set to: |
optional |
|
|
Valid only when |
optional |
|
|
Valid only when |
optional |
|
|
The object identifier of the MIB object to monitor. If no other parameters are present, the monitor asserts that the agent’s response for this object must include a valid value (as opposed to an error, no-such-name, or end-of-view condition) that is non-null. |
optional |
|
|
The value to be compared against the observed value of the monitored object.
Note: Comparison will always succeed if either the |
optional |
|
|
The operator to be used for comparing the monitored object against the |
optional |
|
|
Destination port where the SNMP requests shall be sent. |
optional |
from 'snmp-config.xml' |
|
A user-provided template used for the monitor’s reason code if the service is unvailable. Defaults to a reasonable value if unset. See below for an explanation of the possible template parameters. |
optional |
depends on operation mode |
|
Number of polls to attempt. |
optional |
from 'snmp-config.xml' |
|
Deprecated Same as |
optional |
from 'snmp-config.xml' |
|
Timeout in milliseconds for retrieving the object’s value. |
optional |
from 'snmp-config.xml' |
|
|
optional |
|
| Variable | Description |
|---|---|
|
Value of the |
|
IP address polled. |
|
Value of the |
|
When |
|
Value of the |
|
Value of the |
|
Polled value that made the monitor succeed or fail. |
|
Value of the |
|
Value of the |
|
Value of the |
|
Value of the |
|
Value of the |
|
Value of the |
|
Value of the |
Example for monitoring scalar object
As a working example we want to monitor the thermal system fan status which is provided as a scalar object ID.
cpqHeThermalSystemFanStatus .1.3.6.1.4.1.232.6.2.6.4.0
The manufacturer MIB gives the following information:
SYNTAX 	INTEGER  {
    other    (1),
    ok       (2),
    degraded (3),
    failed   (4)
}
ACCESS 	read-only
DESCRIPTION
"The status of the fan(s) in the system.

This value will be one of the following:
other(1)
Fan status detection is not supported by this system or driver.

ok(2)
All fans are operating properly.

degraded(3)
A non-required fan is not operating properly.

failed(4)
A required fan is not operating properly.

If the cpqHeThermalDegradedAction is set to shutdown(3) the
system will be shutdown if the failed(4) condition occurs."
The SnmpMonitor is configured to test if the fan status returns ok(2). If so, the service is marked as up. Any other value indicates a problem with the thermal fan status and marks the service down.
<service name="HP-Insight-Fan-System" interval="300000" user-defined="false" status="on">
    <parameter key="oid" value=".1.3.6.1.4.1.232.6.2.6.4.0"/>(1)
    <parameter key="operator" value="="/>(2)
    <parameter key="operand" value="2"/>(3)
    <parameter key="reason-template" value="System fan status is not ok. The state should be ok(${operand}) the observed value is ${observedValue}. Please check your HP Insight Manager. Syntax: other(1), ok(2), degraded(3), failed(4)"/>(4)
</service>

<monitor service="HP-Insight-Fan-System" class-name="org.opennms.netmgt.poller.monitors.SnmpMonitor" />| 1 | Scalar object ID to test |
| 2 | Operator for testing the response value |
| 3 | Integer 2 as operand for the test |
| 4 | Encode MIB status in the reason code to give more detailed information if the service goes down |
Example test SNMP table with all matching values
The second mode shows how to monitor values of a whole SNMP table. As a practical use case the status of a set of physical drives is monitored. This example configuration shows the status monitoring from the CPQIDA-MIB.
We use as a scalar object id the physical drive status given by the following tabular OID:
cpqDaPhyDrvStatus .1.3.6.1.4.1.232.3.2.5.1.1.6
SYNTAX 	INTEGER  {
    other             (1),
    ok                (2),
    failed            (3),
    predictiveFailure (4)
}
ACCESS 	read-only
DESCRIPTION
Physical Drive Status.
This shows the status of the physical drive.
The following values are valid for the physical drive status:

other (1)
 Indicates that the instrument agent does not recognize
 the drive.  You may need to upgrade your instrument agent
 and/or driver software.

ok (2)
 Indicates the drive is functioning properly.

failed (3)
 Indicates that the drive is no longer operating and
 should be replaced.

predictiveFailure(4)
 Indicates that the drive has a predictive failure error and
 should be replaced.
The configuration in our monitor will test all physical drives for status ok(2).
<service name="HP-Insight-Drive-Physical" interval="300000" user-defined="false" status="on">
    <parameter key="oid" value=".1.3.6.1.4.1.232.3.2.5.1.1.6"/>(1)
    <parameter key="walk" value="true"/>(2)
    <parameter key="operator" value="="/>(3)
    <parameter key="operand" value="2"/>(4)
    <parameter key="match-all" value="true"/>(5)
    <parameter key="reason-template" value="One or more physical drives are not ok. The state should be ok(${operand}) the observed value is ${observedValue}. Please check your HP Insight Manager. Syntax: other(1), ok(2), failed(3), predictiveFailure(4), erasing(5), eraseDone(6), eraseQueued(7)"/>(6)
</service>

<monitor service="HP-Insight-Drive-Physical" class-name="org.opennms.netmgt.poller.monitors.SnmpMonitor" />| 1 | OID for SNMP table with all physical drive states |
| 2 | Enable walk mode to test every entry in the table against the test criteria |
| 3 | Test operator for integer |
| 4 | Integer 2 as operand for the test |
| 5 | Test in walk mode has to be passed for every entry in the table |
| 6 | Encode MIB status in the reason code to give more detailed information if the service goes down |
Example test SNMP table with all matching values
This example shows how to use the SnmpMonitor to test if the number of static routes are within a given boundary. The service is marked as up if at least 3 and at maxium 10 static routes are set on a network device. This status can be monitored by polling the table ipRouteProto from the RFC1213-MIB2.
ipRouteProto 1.3.6.1.2.1.4.21.1.9
The MIB description gives us the following information:
SYNTAX 	INTEGER  {
    other(1),
    local(2),
    netmgmt(3),
    icmp(4),
    egp(5),
    ggp(6),
    hello(7),
    rip(8),
    is-is(9),
    es-is(10),
    ciscoIgrp(11),
    bbnSpfIgp(12),
    ospf(13),
    bgp(14)}
}
ACCESS 	read-only
DESCRIPTION
"The routing mechanism via which this route was learned.
Inclusion of values for gateway routing protocols is not
intended to imply that hosts should support those protocols."
To monitor only local routes, the test should be applied only on entries in the ipRouteProto table with value 2.
The number of entries in the whole ipRouteProto table has to be counted and the boundaries on the number has to be applied.
<service name="All-Static-Routes" interval="300000" user-defined="false" status="on">
 <parameter key="oid" value=".1.3.6.1.2.1.4.21.1.9" />(1)
 <parameter key="walk" value="true" />(2)
 <parameter key="operator" value="=" />(3)
 <parameter key="operand" value="2" />(4)
 <parameter key="match-all" value="count" />(5)
 <parameter key="minimum" value="3" />(6)
 <parameter key="maximum" value="10" />(7)
</service>

<monitor service="All-Static-Routes" class-name="org.opennms.netmgt.poller.monitors.SnmpMonitor" />| 1 | OID for SNMP table ipRouteProto |
| 2 | Enable walk mode to test every entry in the table against the test criteria |
| 3 | Test operator for integer |
| 4 | Integer 2 as operand for testing local route entries |
| 5 | Test in walk mode has is set to count to get the number of entries in the table regarding operator and operand |
| 6 | Lower count boundary set to 3 |
| 7 | High count boundary is set to 10 |
2.1.34. SshMonitor
The SSH monitor tests the availability of a SSH service. During the poll an attempt is made to connect on the specified port. If the connection request is successful, then the service is considered up. Optionaly, the banner line generated by the service may be parsed and compared against a pattern before the service is considered up.
Monitor facts
Class Name |
|
Remote Enabled |
true |
Configuration and Usage
| Parameter | Description | Required | Default value |
|---|---|---|---|
|
Regular expression to be matched against the service’s banner. |
optional |
|
|
The client banner that OpenNMS will use to identify itself on the service. |
optional |
|
|
Regular expression to be matched against the service’s banner. |
optional |
|
|
TCP port to which SSH connection shall be tried. |
optional |
|
|
Number of attempts to establish the SSH connnection. |
optional |
|
|
Timeout in milliseconds for SSH connection establishment. |
optional |
|
Examples
<service name="SSH" interval="300000" user-defined="false" status="on">
  <parameter key="retry" value="1"/>
  <parameter key="banner" value="SSH"/>
  <parameter key="client-banner" value="OpenNMS poller"/>
  <parameter key="timeout" value="5000"/>
  <parameter key="rrd-repository" value="/var/lib/opennms/rrd/response"/>
  <parameter key="rrd-base-name" value="ssh"/>
  <parameter key="ds-name" value="ssh"/>
</service>
<monitor service="SSH" class-name="org.opennms.netmgt.poller.monitors.SshMonitor"/>
2.1.35. SSLCertMonitor
This monitor is used to test if a SSL certificate presented by a remote network server are valid. A certificate is invalid if its initial time is prior to the current time, or if the current time is prior to 7 days (configurable) before the expiration time. The monitor only supports SSL on the socket and does not support a higher level protocol above it. Additionally, it does not support Server Name Indication (SNI) and so is unable to validate different certificates if they would be presented on the same connection.
You can simulate the behavior by running a command like this:
echo | openssl s_client -connect <site>:<port> 2>/dev/null | openssl x509 -noout -dates
The output shows you the time range a certificate is valid:
notBefore=Dec 24 14:11:34 2013 GMT
notAfter=Dec 25 10:37:40 2014 GMT
You can configure a threshold in days applied on the notAfter date.
Monitor facts
Class Name |
|
Remote Enabled |
true |
Configuration and Usage
| Parameter | Description | Required | Default value |
|---|---|---|---|
|
TCP port for the service with SSL certificate. |
required |
|
|
Number of attempts to get the certificate state |
optional |
|
|
Time in milliseconds to wait before next attempt. |
optional |
|
|
Number of days before the certificate expires that we mark the service as failed. |
optional |
|
| The monitor has no support for communicating on other protocol layers above the SSL session layer. It is not able to send a Host header for HTTPS, or issue a STARTTLS command for IMAP, POP3, SMTP, FTP, XMPP, LDAP, or NNTP. |
Examples
The following example shows how to monitor SSL certificates on services like IMAPS, SMTPS and HTTPS.
If the certificates expire within 30 days the service goes down and indicates this issue in the reason of the monitor.
In this example the monitoring interval is reduced to test the certificate every 2 hours (7,200,000 ms).
Configuration in poller-configuration.xml is as the following:
<service name="SSL-Cert-IMAPS-993" interval="7200000" user-defined="false" status="on">
    <parameter key="retry" value="2"/>
    <parameter key="timeout" value="2000"/>
    <parameter key="port" value="993"/>
    <parameter key="days" value="30"/>
</service>
<service name="SSL-Cert-SMTPS-465" interval="7200000" user-defined="false" status="on">
    <parameter key="retry" value="2"/>
    <parameter key="timeout" value="2000"/>
    <parameter key="port" value="465"/>
    <parameter key="days" value="30"/>
</service>
<service name="SSL-Cert-HTTPS-443" interval="7200000" user-defined="false" status="on">
    <parameter key="retry" value="2"/>
    <parameter key="timeout" value="3000"/>
    <parameter key="port" value="443"/>
    <parameter key="days" value="30"/>
</service>

<monitor service="SSL-Cert-IMAPS-993" class-name="org.opennms.netmgt.poller.monitors.SSLCertMonitor" />
<monitor service="SSL-Cert-SMTPS-465" class-name="org.opennms.netmgt.poller.monitors.SSLCertMonitor" />
<monitor service="SSL-Cert-HTTPS-443" class-name="org.opennms.netmgt.poller.monitors.SSLCertMonitor" />
2.1.36. StrafePingMonitor
This monitor is used to monitor packet delay variation to a specific endpoint using ICMP. The main use case is to monitor a WAN end point and visualize packet loss and ICMP packet round trip time deviation. The StrafePingMonitor performs multiple ICMP echo requests (ping) and stores the response-time of each as well as the packet loss, in a RRD file. Credit is due to Tobias Oetiker, as this graphing feature is an adaptation of the SmokePing tool that he developed.
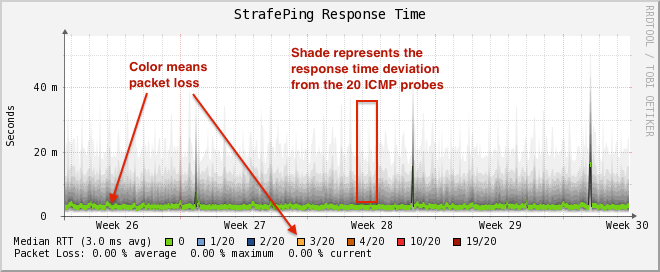
Monitor facts
Class Name |
|
Remote Enabled |
false |
Configuration and Usage
Monitor specific parameters for the StrafePingMonitor
| Parameter | Description | Required | Default value |
|---|---|---|---|
|
Time in milliseconds to wait before assuming that a packet has not responded |
optional |
|
|
The number of retries to attempt when a packet fails to respond in the given timeout |
optional |
|
|
The number of pings to attempt each interval |
required |
|
|
The number of pings that need to fail for the service to be considered down |
required |
|
|
Time in milliseconds to wait between each ICMP echo-request packet |
required |
|
|
The location to write RRD data. Generally, you will not want to change this from default |
required |
|
|
The name of the RRD file to write (minus the extension, |
required |
|
Examples
The StrafePingMonitor is typically used on WAN connections and not activated for every ICMP enabled device in your network.
Further this monitor is much I/O heavier than just a simple RRD graph with a single ICMP response time measurement.
By default you can find a separate poller package in the 'poller-configuration.xml' called strafer.
Configure the include-range or a filter to enable monitoring for devices with the service StrafePing.
| Don’t forget to assign the service StrafePing on the IP interface to be activated. |
The following example enables the monitoring for the service StrafePing on IP interfaces in the range 10.0.0.1 until 10.0.0.20.
Additionally the Nodes have to be in a surveillance category named Latency.
<package name="strafer" >
   <filter>categoryName == 'Latency'</filter>
   <include-range begin="10.0.0.1" end="10.0.0.20"/>
   <rrd step="300">
     <rra>RRA:AVERAGE:0.5:1:2016</rra>
     <rra>RRA:AVERAGE:0.5:12:1488</rra>
     <rra>RRA:AVERAGE:0.5:288:366</rra>
     <rra>RRA:MAX:0.5:288:366</rra>
     <rra>RRA:MIN:0.5:288:366</rra>
   </rrd>
   <service name="StrafePing" interval="300000" user-defined="false" status="on">
     <parameter key="retry" value="0"/>
     <parameter key="timeout" value="3000"/>
     <parameter key="ping-count" value="20"/>
     <parameter key="failure-ping-count" value="20"/>
     <parameter key="wait-interval" value="50"/>
     <parameter key="rrd-repository" value="/opt/opennms/share/rrd/response"/>
     <parameter key="rrd-base-name" value="strafeping"/>
   </service>
   <downtime interval="30000" begin="0" end="300000"/>
   <downtime interval="300000" begin="300000" end="43200000"/>
   <downtime interval="600000" begin="43200000" end="432000000"/>
   <downtime begin="432000000" delete="true"/>
 </package>
 <monitor service="StrafePing" class-name="org.opennms.netmgt.poller.monitors.StrafePingMonitor"/>
2.1.37. SystemExecuteMonitor
If it is required to execute a system call or run a script to determine a service status, the SystemExecuteMonitor can be used. It is calling a script or system command, if required it provides additional arguments to the call. To determine the status of the service the SystemExecuteMonitor can rely on 0 or a non-0 exit code of system call. As an alternative, the output of the system call can be matched against a banner. If the banner is part of the output the status is interpreted as up. If the banner is not available in the output the status is determined as down.
Monitor facts
Class Name |
|
Remote Enabled |
true |
Configuration and Usage
| Parameter | Description | Required | Default value |
|---|---|---|---|
|
The system-call to execute. |
required |
|
|
The arguments to hand over to the system-call. |
optional |
|
|
A string that is match against the output of |
optional |
|
The parameter args supports variable replacement for the following set of variables.
| Variable | Description |
|---|---|
|
Timeout in milliseconds, based on config of the service. |
|
Timeout in seconds, based on config of the service. |
|
Amount of retries based on config of the service. |
|
Service name based on the config of the service. |
|
IP-address of the interface the service is bound to. |
|
Nodeid of the node the monitor is associated to. |
|
Nodelabel of the node the monitor is associated to. |
Examples
<parameter key="args" value="-i ${ipaddr} -t ${timeout}"/>
<parameter key="args" value="http://${nodelabel}/${svcname}/static"/>
SystemExecuteMonitor vs GpMonitor
The SystemExecuteMonitor is the successor of the GpMonitor. The main differences are:
-
Variable replacement for the parameter args
-
There are no fixed arguments handed to the system-call
-
The SystemExecuteMonitor supports RemotePoller deployment
To migrate services from the GpMonitor to the SystemExecuteMonitor it is required to alter the parameter args.
To match the arguments called hoption for the hostAddress and toption for the timeoutInSeconds.
The args string that matches the GpMonitor call looks like this:
<parameter key="args" value="--hostname ${ipaddr} --timeout ${timeoutsec}" />To migrate the GpMonitor parameters hoption and toption just replace the --hostname and --timeout directly in the args key.
2.1.38. VmwareCimMonitor
This monitor is part of the VMware integration provided in Provisiond. The monitor is specialized to test the health status provided from all Host System (host) sensor data.
| This monitor is only executed if the host is in power state on. |
| This monitor requires to import hosts with Provisiond and the VMware import. OpenNMS requires network access to VMware vCenter and the hosts. To get the sensor data the credentials from vmware-config.xml for the responsible vCenter is used. The following asset fields are filled from Provisiond and is provided by VMware import feature: VMware Management Server, VMware Managed Entity Type and the foreignId which contains an internal VMware vCenter Identifier. |
The global health status is evaluated by testing all available host sensors and evaluating the state of each sensor. A sensor state could be represented as the following:
-
Unknown(0)
-
OK(5)
-
Degraded/Warning(10)
-
Minor failure(15)
-
Major failure(20)
-
Critical failure(25)
-
Non-recoverable error(30)
The service is up if all sensors have the status OK(5). If any sensor gives another status then OK(5) the service is marked as down. The monitor error reason contains a list of all sensors which not returned status OK(5).
| In case of using Distributed Power Management the standBy state forces a service down. The health status is gathrered with a direct connection to the host and in stand by this connection is unavailable and the service is down. To deal with stand by states, the configuration ignoreStandBy can be used. In case of a stand by state, the service is considered as up. |
state can be changed see the ignoreStandBy configuration parameter.
Monitor facts
Class Name |
|
Remote Enabled |
false |
Configuration and Usage
| Parameter | Description | Required | Default value |
|---|---|---|---|
|
Number of retries before the service is marked as down. |
optional |
|
|
Time in milliseconds to wait collecting the CIM sensor data. |
optional |
|
|
Treat power state standBy as up. |
optional |
|
Examples
Some example configuration how to configure the monitor in the poller-configuration.xml.
<service name="VMwareCim-HostSystem" interval="300000" user-defined="false" status="on">
  <parameter key="retry" value="2"/>
  <parameter key="timeout" value="3000"/>
</service>

<monitor service="VMwareCim-HostSystem" class-name="org.opennms.netmgt.poller.monitors.VmwareCimMonitor"/>
2.1.39. VmwareMonitor
This monitor is part of the VMware integration provided in Provisiond and test the power state of a virtual machine (VM) or a host system (host).
If the power state of a VM or host is poweredOn the service is up.
The state off the service on the VM or Host is marked as down.
By default standBy is also considered as down.
In case of using Distributed Power Management the standBy state can be changed see the ignoreStandBy configuration parameter.
| The information for the status of a virtual machine is collected from the responsible VMware vCenter using the credentials from the vmware-config.xml. It is also required to get specific asset fields assigned to an imported virtual machine and host system. The following asset fields are required, which are populated by the VMware integration in Provisiond: VMware Management Server, VMware Managed Entity Type and the foreignId which contains an internal VMware vCenter Identifier. |
Monitor facts
Class Name |
|
Remote Enabled |
false |
Configuration and Usage
| Parameter | Description | Required | Default value |
|---|---|---|---|
|
Number of retries before the service is marked as down. |
optional |
|
|
Time in milliseconds to wait for the vCenter to get the power state information. |
optional |
|
|
Treat power state standBy as up. |
optional |
|
Examples
Some example configuration how to configure the monitor in the poller-configuration.xml.
<service name="VMware-ManagedEntity" interval="300000" user-defined="false" status="on">
  <parameter key="retry" value="2"/>
  <parameter key="timeout" value="3000"/>
</service>

<monitor service="VMware-ManagedEntity" class-name="org.opennms.netmgt.poller.monitors.VmwareMonitor"/>
2.1.40. Win32ServiceMonitor
The Win32ServiceMonitor enables OpenNMS to monitor the running state of any Windows service. The service status is monitored using the Microsoft Windows® provided SNMP agent providing the LAN Manager MIB-II. For this reason it is required the SNMP agent and OpenNMS is correctly configured to allow queries against part of the MIB tree. The status of the service is monitored by polling the
svSvcOperatingState = 1.3.6.1.4.1.77.1.2.3.1.3
of a given service by the display name.
Monitor facts
Class Name |
|
Remote Enabled |
false |
Configuration and Usage
| Parameter | Description | Required | Default value |
|---|---|---|---|
|
Number of attempts to get the service state from SNMP agent |
required |
From |
|
Time in milliseconds to wait for the SNMP result before next attempt. |
required |
From |
|
The name of the service, this should be the exact name of the Windows service to monitor as it appears in the Services MSC snap-in. Short names such as you might use with net start will not work here. |
required |
|
Non-English Windows
The service-name is sometime encoded in languages other than English.
Like in French, the Task Scheduler service is Planificateur de tâche.
Because of the "â" (non-English character), the OID value is encoded in hexa (0x50 6C 61 6E 69 66 69 63 61 74 65 75 72 20 64 65 20 74 C3 A2 63 68 65 73).
|
Troubleshooting
If you’ve created a Win32ServiceMonitor poller and are having difficulties with it not being monitored properly on your hosts, chances are there is a difference in the name of the service you’ve created, and the actual name in the registry.
For example, I need to monitor a process called Example Service on one of our production servers.
I retrieve the Display name from looking at the service in service manager, and create an entry in the poller-configuration.xml files using the exact name in the Display name field.
However, what I don’t see is the errant space at the end of the service display name that is revealed when doing the following:
snmpwalk -v 2c -c <communitystring> <hostname> .1.3.6.1.4.1.77.1.2.3.1.1
This provides the critical piece of information I am missing:
iso.3.6.1.4.1.77.1.2.3.1.1.31.83.116.97.102.102.119.97.114.101.32.83.84.65.70.70.86.73.69.87.32.66.97.99.107.103.114.111.117.110.100.32 = STRING: "Example Service "
| Note the extra space before the close quote. |
The extra space at the end of the name was difficult to notice in the service manager GUI, but is easily visible in the snmpwalk output.
The right way to fix this would be to correct the service Display name field on the server, however, the intent of this procedure is to recommend verifying the true name using snmpwalk as opposed to relying on the service manager GUI.
Examples
Monitoring the service running state of the Task Scheduler on an English local Microsoft Windows® Server requires at minimum the following entry in the poller-configuration.xml.
<service name="Windows-Task-Scheduler" interval="300000" user-defined="false" status="on">
    <parameter key="service-name" value="Task Scheduler"/>
</service>

<monitor service="Windows-Task-Scheduler" class-name="org.opennms.netmgt.poller.monitors.Win32ServiceMonitor"/>
2.1.41. XmpMonitor
The XMP monitor tests for XMP service/agent availability by establishing an XMP session and querying the target agent’s sysObjectID variable contained in the Core MIB. The service is considered available when the session attempt succeeds and the agent returns its sysObjectID without error.
Monitor facts
Class Name |
|
Remote Enabled |
false |
Configuration and Usage
These parameters can be set in the XMP service entry in collectd-configuration.xml and will override settings from xmp-config.xml. Also, don’t forget to add an entry in response-graph.properties so that response values will be graphed.
| Parameter | Description | Required | Default value |
|---|---|---|---|
|
Time in milliseconds to wait for a successful session. |
optional |
|
|
The authenUser parameter for use with the XMP session. |
optional |
|
|
TCP port to connect to for XMP session establishment |
optional |
|
|
Name of MIB to query |
optional |
|
|
Name of MIB object to query |
optional |
|
Examples
<service name="XMP" interval="300000" user-defined="false" status="on">
  <parameter key="timeout" value="3000"/>
  <parameter key="rrd-repository" value="/opt/opennms/share/rrd/response"/>
  <parameter key="rrd-base-name" value="xmp"/>
  <parameter key="ds-name" value="xmp"/>
</service>
<monitor service="XMP" class-name="org.opennms.netmgt.poller.monitors.XmpMonitor"/>reports=icmp, \
xmp, \ . . . .
report.xmp.name=XMP
report.xmp.columns=xmp
report.xmp.type=responseTime
report.xmp.command=--title="XMP Response Time" \
--vertical-label="Seconds" \
DEF:rtMills={rrd1}:xmp:AVERAGE \
DEF:minRtMills={rrd1}:xmp:MIN \
DEF:maxRtMills={rrd1}:xmp:MAX \
CDEF:rt=rtMills,1000,/ \
CDEF:minRt=minRtMills,1000,/ \
CDEF:maxRt=maxRtMills,1000,/ \
LINE1:rt#0000ff:"Response Time" \
GPRINT:rt:AVERAGE:" Avg \\: %8.2lf %s" \
GPRINT:rt:MIN:"Min \\: %8.2lf %s" \
GPRINT:rt:MAX:"Max \\: %8.2lf %s\\n"3. Events in OpenNMS
3.1. Events
Events are central to the operation of the OpenNMS platform, so it’s critical to have a firm grasp of this topic.
| Whenever something in OpenNMS appears to work by magic, it’s probably events working behind the curtain. |
3.1.1. Anatomy of an Event
Events are structured historical records of things that happen in OpenNMS and the nodes, interfaces, and services it manages. Every event has a number of fixed fields and zero or more parameters.
- UEI (Universal Event Identifier)
-
A string uniquely identifying the event’s type. UEIs are typically formatted in the style of a URI, but the only requirement is that they start with the string
uei.. - Event Label
-
A short, static label summarizing the gist of all instances of this event.
- Description
-
A long-form description describing all instances of this event.
- Log Message
-
A long-form log message describing this event, optionally including expansions of fields and parameters so that the value is tailored to the event at hand.
- Severity
-
A severity for this event type. Possible values range from
ClearedtoCritical. - Event ID
-
A numeric identifier used to look up a specific event in the OpenNMS system.
- Operator Instruction
-
A set of instructions for an operator to respond appropriately to an event of this type.
- Alarm Data
-
If this field is provided for an event, OpenNMS will create, update, or clear alarms for events of that type according to the alarm-data specifics. For more about alarms and how they relate to events, see [alarms-introduction].
3.1.2. Sources of Events
Events may originate within OpenNMS itself or from outside.
Internally-generated events can be the result of the platform’s monitoring and management functions (e.g. a monitored node becoming totally unavailable results in an event with the UEI uei.opennms.org/nodes/nodeDown) or they may act as inputs or outputs of housekeeping processes.
Externally-created events can arrive by a variety of mechanisms, including:
- SNMP Traps
-
If SNMP-capable devices in the network are configured to send traps to OpenNMS, these traps are transformed into events according to pre-configured rules. Event definitions are included with OpenNMS for traps from many vendors' equipment.
- Syslog Messages
-
Syslog messages sent over the network to OpenNMS can be transformed into events according to pre-configured rules.
- TL1 Autonomous Messages
-
Autonomous messages can be retrieved from certain TL1-enabled equipment and transformed into events.
- XML-TCP
-
Any application or script can create custom events in OpenNMS by sending properly-formatted XML data over a TCP socket.
3.1.3. The Event Bus
At the heart of OpenNMS lies an event bus. Any OpenNMS component can publish events to the bus, and any component can subscribe to receive events of interest that have been published on the bus. This publish-subscribe model enables components to use events as a mechanism to send messages to each other. For example, the provisioning subsystem of OpenNMS publishes a node-added event whenever a new node is added to the system. Other subsystems with an interest in new nodes subscribe to the node-added event and automatically receive these events, so they know to start monitoring and managing the new node if their configuration dictates. The publisher and subscriber components do not need to have any knowledge of each other, allowing for a clean division of labor and lessening the programming burden to add entirely new OpenNMS subsystems or modify the behavior of existing ones.
3.1.4. Events in Action
4. OpenNMS Provisioning
4.1. Provisioning
4.1.1. Summary
The introduction of OpenNMS version 1.8 empowers enterprises and services providers like never before with a new service daemon for maintaining the managed entity inventory in OpenNMS. This new daemon, Provisiond, unifies all previous entity control mechanisms available in 1.6 (Capsd and the Importer), into a new and improved, massively parallel, policy based provisioning system. System integrators should note, Provisiond comes complete with a RESTFul Web Service API for easy integration with external systems such as CRM or external inventory systems as well as an adapter API for interfacing with other management systems such as configuration management.
OpenNMS 1.0, introduced almost a decade ago now, provided a capabilities scanning daemon, Capsd, as the mechanism for provisioning managed entities. Capsd, deprecated with the release of 1.8.0, provided a rich automatic provisioning mechanism that simply required an IP address to seed its algorithm for creating and maintaining the managed entities (nodes, interfaces, and IP based services). Version 1.2 added and XML-RPC API as a more controlled (directed) strategy for provisioning services that was mainly used by non telco based service providers (i.e. managed hosting companies). Version 1.6 followed this up with yet another and more advanced mechanism called the Importer service daemon. The Importer provided large service providers with the ability to strictly control the OpenNMS entity provisioning with an XML based API for completely defining and controlling the entities where no discovery and service scanning scanning was feasible.
The Importer service improved OpenNMS' scalability for maintaining managed entity databases by an order of magnitude. This daemon, while very simple in concept and yet extremely powerful and flexible provisioning improvement, has blazed the trail for Provisiond. The Importer service has been in production for 3 years in service provider networks maintaining entity counts of more than 50,000 node level entities on a single instances of OpenNMS. It is a rock solid provisioning tool.
Provisiond begins a new era of managed entity provisioning in OpenNMS.
4.1.2. Concepts
Provisioning is a term that is familiar to service providers (a.k.a. operators, a.k.a. telephone companies) and OSS systems but not so much in the non OSS enterprises.
Provisiond receives "requests" for adding managed entities via 2 basic mechanisms, the OpenNMS traditional "New Suspect" event, typically via the Discovery daemon, and the import requisition (XML definition of node entities) typically via the Provisioning Groups UI. If you are familiar with all previous releases of OpenNMS, you will recognize the New Suspect Event based Discovery to be what was previously the Capsd component of the auto discovery behavior. You will also recognize the import requisition to be of the Model Importer component of OpenNMS. Provisiond now unifies these two separate components into a massively parallel advanced policy based provisioning service.
OpenNMS Provisioning Terminology
The following terms are used with respect to OpenNMS’ provisioning system and are essential for understanding the material presented in this guide.
Entity
Entities are managed objects in OpenNMS such as Nodes, IP interfaces, SNMP Interfaces, and Services.
Foreign Source and Foreign ID
The Importer service from 1.6 introduced the idea of foreign sources and foreign IDs. The Foreign Source uniquely identifies a provisioning source and is still a basic attribute of importing node entities into OpenNMS. The concept is to provide an external (foreign) system with a way to uniquely identify itself and any node entities that it is requesting (via a requisition) to be provisioned into OpenNMS.
The Foreign ID is the unique node ID maintained in foreign system and the foreign source uniquely identifies the external system in OpenNMS.
OpenNMS uses the combination of the foreign source and foreign ID become the unique foreign key when synchronizing the set of nodes from each source with the nodes in the OpenNMS DB. This way the foreign system doesn’t have to keep track of the OpenNMS node IDs that are assigned when a node is first created. This is how Provisiond can decided if a node entity from an import requisition is new, has been changed, or needs to be deleted.
Foreign Source Definition
Additionally, the foreign source has been extended to also contain specifications for how entities should be discovered and managed on the nodes from each foreign source. The name of the foreign source has become pervasive within the provisioning system and is used to simply some of the complexities by weaving this name into:
-
the name of the provisioning group in the Web-UI
-
the name of the file containing the persisted requisition (as well as the pending requisition if it is in this state)
-
the foreign-source attribute value inside the requisition (obviously, but, this is pointed out to indicate that the file name doesn’t necessarily have to equal the value of this attribute but is highly recommended as an OpenNMS best practice)
-
the building attribute of the node defined in the requisition (this value is called “site” in the Web-UI and is assigned to the building column of the node’s asset record by Provisiond and is the default value used in the Site Status View feature)
Import Requisition
Import requisition is the terminology OpenNMS uses to represent the set of nodes, specified in XML, to be provisioned from a foreign source into OpenNMS. The requisition schema (XSD) can be found at the following location. http://xmlns.opennms.org/xsd/config/model-import
Auto Discovery
Auto discovery is the term used by OpenNMS to characterize the automatic provisioning of nodes entities. Currently, OpenNMS uses an ICMP ping sweep to find IP address on the network. For the IPs that respond and that are not currently in the DB, OpenNMS generates a new suspect event. When this event is received by Provisiond, it creates a node and it begins a node scan based on the default foreign source definition.
Directed Discovery
Provisiond takes over for the Model Importer found in version 1.6 which implemented a unique, first of its kind, controlled mechanism for specifying managed entities directly into OpenNMS from one or more data sources. These data sources often were in the form of an in-housed developed inventory or stand-alone provisioning system or even a set of element management systems. Using this mechanism, OpenNMS is directed to add, update, or delete a node entity exactly as defined by the external source. No discovery process is used for finding more interfaces or services.
Enhanced Directed Discovery
Directed discovery is enhanced with the capability to scan nodes that have been directed nodes for entities (interfaces.
Policy Based Discovery
The phrase, Policy based Directed Discovery, is a term that represents the latest step in OpenNMS’ provisioning evolution and best describes the new provisioning architecture now in OpenNMS for maintaining its inventory of managed entities. This term describes the control that is given over the Provisioning system to OpenNMS users for managing the behavior of the NMS with respect to the new entities that are being discovered. Current behaviors include persistence, data collection, service monitoring, and categorization policies.
Addressing Scalability
The explosive growth and density of the IT systems being deployed today to support not traditional IP services is impacting management systems like never before and is demanding from them tremendous amounts of scalability. The scalability of a management system is defined by its capacity for maintaining large numbers of managing entities coupled with its efficiency of managing the entities.
Today, It is not uncommon for OpenNMS deployments to find node entities with tens of thousands of physical interfaces being reported by SNMP agents due to virtualization (virtual hosts, interfaces, as well as networks). An NMS must be capable of using the full capacity every resource of its computing platform (hardware and OS) as effectively as possible in order to manage these environments. The days of writing scripts or single threaded applications will just no longer be able to do the work required an NMS when dealing with the scalability challenges facing systems and systems administrators working in this domain.
Parallelization and Non-Blocking I/O
Squeezing out every ounce of power from a management system’s platform (hardware and OS) is absolutely required to complete all the work of a fully functional NMS such as OpenNMS. Fortunately, the hardware and CPU architecture of a modern computing platform provides multiple CPUs with multiple cores having instruction sets that include support for atomic operations. While these very powerful resources are being provided by commodity systems, it makes the complexity of developing applications to use them vs. not using them, orders of magnitude more complex. However, because of scalability demands of our complex IT environments, multi-threaded NMS applications are now essential and this has fully exposed the complex issues of concurrency in software development.
OpenNMS has stepped up to this challenge with its new concurrency strategy. This strategy is based on a technique that combines the efficiency of parallel (asynchronous) operations (traditionally used by most effectively by single threaded applications) with the power of a fully current, non-blocking, multi-threaded design. The non-blocking component of this new concurrency strategy added greater complexity but OpenNMS gained orders of magnitude in increased scalability.
| Java Runtimes, based on the Sun JVM, have provided implementations for processor based atomic operations and is the basis for OpenNMS’ non-blocking concurrency algorithms. |
Provisioning Policies
Just because you can, doesn’t mean you should! Because the massively parallel operations being created for Provisiond allows tremendous numbers of nodes, interfaces, and services to be very rapidly discovered and persisted, doesn’t mean it should. A policy API was created for Provisiond that allows implementations to be developed that can be applied to control the behavior of Provisiond. The 1.8 release includes a set of flexible provisioning policies that control the persistence of entities and their attributes constrain monitoring behavior.
When nodes are imported or re-scanned, there is, potentially, a set of zero or more provisioning policies that are applied. The policies are defined in the foreign source’s definition. The policies for an auto-discovered node or nodes from provisioning groups that don’t have a foreign source definition, are the policies defined in the default foreign source definition.
The Default Foreign Source Definition
Contained in the libraries of the Provisioning service is the "template" or default foreign source. The template stored in the library is used until the OpenNMS admin user alters the default from the Provisioning Groups WebUI. Upon edit, this template is exported to the OpenNMS 'etc/' directory with the file name: 'default-foreign-source.xml'.
<?xml version="1.0" encoding="UTF-8" standalone="yes"?>
<foreign-source date-stamp="2009-10-16T18:04:12.844-05:00"
                name="default"
                xmlns="http://xmlns.opennms.org/[http://xmlns.opennms.org/xsd/config/foreign-source">
    <scan-interval>1d</scan-interval>
    <detectors>
      <detector class="org.opennms.netmgt.provision.detector.datagram.DnsDetector" name="DNS"/>
      <detector class="org.opennms.netmgt.provision.detector.simple.FtpDetector" name="FTP"/>
      <detector class="org.opennms.netmgt.provision.detector.simple.HttpDetector" name="HTTP"/>
      <detector class="org.opennms.netmgt.provision.detector.simple.HttpsDetector" name="HTTPS"/>
      <detector class="org.opennms.netmgt.provision.detector.icmp.IcmpDetector" name="ICMP"/>
      <detector class="org.opennms.netmgt.provision.detector.simple.ImapDetector" name="IMAP"/>
      <detector class="org.opennms.netmgt.provision.detector.simple.LdapDetector" name="LDAP"/>
      <detector class="org.opennms.netmgt.provision.detector.simple.NrpeDetector" name="NRPE"/>
      <detector class="org.opennms.netmgt.provision.detector.simple.Pop3Detector" name="POP3"/>
      <detector class="org.opennms.netmgt.provision.detector.radius.RadiusAuthDetector" name="Radius"/>
      <detector class="org.opennms.netmgt.provision.detector.simple.SmtpDetector" name="SMTP"/>
      <detector class="org.opennms.netmgt.provision.detector.snmp.SnmpDetector" name="SNMP"/>
      <detector class="org.opennms.netmgt.provision.detector.ssh.SshDetector" name="SSH"/>
  </detectors>
  <policies/>
</foreign-source>
Default Foreign Source
4.2. Getting Started
An NMS is of no use until it is setup for monitoring and entities are added to the system. OpenNMS installs with a base configuration with a configuration that is sufficient get service level monitoring and performance management quickly up and running. As soon as managed entities are provisioned, the base configuration will automatically begin monitoring and reporting.
Generally speaking, there are two methods of provisioning in OpenNMS: Auto Discovery and Directed Discovery. We’ll start with Auto Discovery, but first, we should quickly review the configuration of SNMP so that newly discovered devices can be immediately scanned for entities as well as have reporting and thresholding available.
4.2.1. Provisioning the SNMP Configuration
OpenNMS requires that the SNMP configuration to be properly setup for your network in order to properly understand Network and Node topology as well as to automatically enabled performance data collection. Network topology is updated as nodes (a.k.a. devices or hosts) are provisioned. Navigate to the Admin/Configure SNMP Community Names as shown below.
| Provisiond includes an option to add community information in the Single Node provisioning interface. This, is equivalent of entering a single IP address in the screen with the convenience of setting the community string at the same time a node is provisioned. See the Quick Node Add feature below for more details about this capability. |
This screen sets up SNMP within OpenNMS for agents listening on IP addresses 10.1.1.1 through 10.254.254.254. These settings are optimized into the 'snmp-configuration.xml' file. Optimization means that the minimal configuration possible will be written. Any IP addresses already configured that are eclipsed by this range will be removed. Here is the resulting configuration.
<?xml version="1.0" encoding="UTF-8"?>

<snmp-config
xmlns="http://xmlns.opennms.org/xsd/config/snmp[http://xmlns.opennms.org/xsd/config/snmp]"
port="161" retry="3" timeout="800" read-community="public"

version="v1" max-vars-per-pdu="10">

<definition retry="1" timeout="2000"

read-community="public" version="v2c">

<specific>10.12.23.32</specific>

</definition>

</snmp-config>
However, If an IP address is then configured that is within the range,
the range will be split into two separate ranges and a specific entry is
added. For example, if a configuration was added through the same UI for
the IP: 10.12.23.32 having the community name public, then the
resulting configuration will be:
<?xml version="1.0" encoding="UTF-8"?>
<snmp-config xmlns="http://xmlns.opennms.org/xsd/config/snmp"
             port="161"
             retry="3"
             timeout="800"
             read-community="public"
             version="v1"
             max-vars-per-pdu="10">

    <definition retry="1" timeout="2000" read-community="YrusoNoz" version="v2c">
        <range begin="10.1.1.1" end="10.12.23.31"/>
        <range begin="10.12.23.33" end="10.254.254.254"/>
    </definition>

    <definition retry="1" timeout="2000" read-community="public" version="v2c">
        <specific>10.12.23.32</specific>
    </definition>
</snmp-config>| the bold IP addresses show where the range was split and the specific with community name "public" was added. |
Now, with SNMP configuration provisioned for our 10 network, we are ready to begin adding nodes. Our first example will be to automatically discovery and add all managed entities (nodes, IP interfaces, SNMP Interfaces, and Monitored IP based Services). We will then give an example of how to be more directed and deliberate about your discovery by using Provisioning Groups.
Automatically discovered entities are analyzed, persisted to the relational data store, and then managed based on the policies defined in the default foreign source definition. This is very similar to the way that entities were handled by Capsd by with finer grained sense of control.
Automatic Discovery
Currently in OpenNMS, the ICMP is used to automatically provision node entities into OpenNMS. This functionality has been in OpenNMS since is 1.0 release, however, in 1.8, a few of the use cases have been updated with Provisiond’s replacement of Capsd.
Separation of Concerns
Version 1.8 Provisiond separates what was called Capsd scanning in to 3 distinct phases: entity scanning, service detection, and node merging. These phases are now managed separately by Provisiond. Immediately following the import of a node entity, tasks are created for scanning a node to discover the node entity’s interfaces (SNMP and IP). As interfaces are found, they are persisted and tasks are scheduled for service detection of each IP interface.
For auto discovered nodes, a node merging phase is scheduled. Nodes that have been directly provisioned will not be included in the node process. Only in the case the 2 where nodes that have been automatically discovered that appear to be the same node with the node merging phase be activated.
| the use case and redesign of node merging is still an outstanding issue with the 1.8.0 release |
Enhanced Directed Discovery
This new form of provisioning first appears in OpenNMS with version 1.8 and the new Provisiond service. It combines the benefits of the Importer’s strictly controlled methodology of directed provisioning (from version 1.6) with OpenNMS’ robustly flexible auto discovery. Enhanced Directed discovery begins with an enhanced version of the same import requisition used in directed provisioning and completes with a policy influenced persistence phase that sorts though the details of all the entities and services found during the entity and service scanning phase.
If you are planning to use this form of provisioning, it important to understand the conceptual details of how Provisiond manages entities it is directed to provision. This knowledge will enable administrators and systems integrators to better plan, implement, and resolve any issues involved with this provisioning strategy.
Understanding the Process
There are 3 phases involved with directing entities to be discovered: import, node scan, and service scan. The import phase also has sub phases: marshal, audit, limited SNMP scan, and re-parent.
======= Marshal and Audit Phases
It is important to understand that the nodes requisitioned from each foreign source are managed as a complete set. Nodes defined in a requisition from the foreign source CRM and CMDB, for example, will be managed separately from each other even if they should contain exactly the same node definitions. To OpenNMS, these are individual entities and they are managed as a set.
Requisitions are referenced via a URL.
Currently, the URL can be specified as one of the following protocols: FILE, HTTP, HTTPS, and DNS.
Each protocol has a protocol handler that is used to stream the XML from a foreign source, i.e. http://inv.corp.org/import.cgi?customer=acme or file:/opt/opennms/etc/imports/acme.xml.
The DNS protocol is a special handler developed for Provisioning sets of nodes as a foreign-source from a corporate DNS server.
See DNS Protocol Handler for details.
Upon the import request (either on schedule or on demand via an Event) the requisition is marshaled into Java objects for processing. The nodes defined in the requisition represent what OpenNMS should have as the current set of managed entities from that foreign source. The audit phase determines for each node defined (or not defined) in the requisition which are to be processed as an Add, Update, or Delete operation during the Import Phase. This determination is made by comparing the set foreign IDs of each node in the requisition set with the set of foreign IDs of currently managed entities in OpenNMS.
The intersection of the IDs from each set will become the Update operations, the extra set of foreign IDs that are in the requisition become the Add operations, and the extra set of foreign IDs from the managed entities become the Delete operations. This implies that the foreign IDs from each foreign source must be unique.
Naturally, the first time an import request is processed from a foreign source there will be zero (0) node entities from the set of nodes currently being managed and each node defined in the requisition will become an Add Operation. If a requisition is processed with zero (0) node definitions, all the currently managed nodes from that foreign source will become Delete operations (all the nodes, interfaces, outages, alarms, etc. will be removed from OpenNMS).
When nodes are provisioned using the Provisioning Groups Web-UI, the requisitions are stored on the local file system and the file protocol handler is used to reference the requisition. Each Provisioning Group is a separate foreign source and unique foreign IDs are generated by the Web-UI. An MSP might use Provisioning Groups to define the set of nodes to be managed by customer name where each customer’s set of nodes are maintained in a separate Provisioning Group.
======= Import Phase
The import phase begins when Provisiond receives a request to import a requisition from a URL. The first step in this phase is to load the requisition and marshal all the node entities defined in the requisition into Java objects.
If any syntactical or XML structural problems occur in the requisition, the entire import is abandoned and no import operations are completed.
Once the requisition is marshaled, the requisition nodes are audited against the persisted node entities. The set of requisitioned nodes are compared with a subset of persisted nodes and this subset is generated from a database query using the foreign source defined in the requisition. The audit generates one of three operations for each requisition node: insert, update, delete based on each requisitioned node’s foreign ID. Delete operations are created for any nodes that are not in the requisition but are in the DB subset, update operations are created for requisition nodes that match a persisted node from the subset (the intersection), and insert operations are created from the remaining requisition nodes (nodes in the requisition that are not in the DB subset).
If a requisition node has an interface defined as the Primary SNMP interface, then during the update and insert operations the node will be scanned for minimal SNMP attribute information. This scan find the required node and SNMP interface details required for complete SNMP support of the node and only the IP interfaces defined in the requisition.
| this not the same as Provisiond SNMP discovery scan phases: node scan and interface scan. |
======= Node Scan Phase
Where directed discovery leaves off and enhanced directed discovery begins is that after all the operations have completed, directed discovery is finished and enhanced directed discovery takes off. The requisitioned nodes are scheduled for node scans where details about the node are discovered and interfaces that were not directly provisioned are also discovered. All physical (SNMP) and logical (IP) interfaces are discovered and persisted based on any Provisioning Policies that may have defined for the foreign source associated with the import requisition.
======= Service Scan (detection) Phase
Additionally, the new Provisiond enhanced directed discovery mechanism follows interface discovery with service detection on each IP interface entity. This is very similar to the Capsd plugin scanning found in all former releases of OpenNMS accept that the foreign source definition is used to define what services should be detected on these interfaces found for nodes in the import requisition.
4.3. Import Handlers
4.3.1. File Handler
4.3.2. HTTP Handler
4.3.3. DNS Handler
The new Provisioning service in OpenNMS is continuously improving and adapting to the needs of the community.
One of the most recent enhancements to the system is built upon the very flexible and extensible API of referencing an import requisition’s location via a URL. Most commonly, these URLs are files on the file system (i.e. file:/opt/opennms/etc/imports/<my-provisioning-group.xml>) as requisitions created by the Provisioning Groups UI.
However, these same requisitions for adding, updating, and deleting nodes (based on the original model importer) can also come from URLs specifying the HTTP protocol: http://myinventory.server.org/nodes.cgi
Now, using Java’s extensible protocol handling specification, a new protocol handler was created so that a URL can be specified for requesting a Zone Transfer (AXFR) request from a DNS server. The A records are recorded and used to build an import requisition. This is handy for organizations that use DNS (possibly coupled with an IP management tool) as the data base of record for nodes in the network. So, rather than ping sweeping the network or entering the nodes manually into OpenNMS Provisioning UI, nodes can be managed via 1 or more DNS servers.
The format of the URL for this new protocol handler is: dns://<host>[:port]/<zone>[/<foreign-source>/][?expression=<regex>]
DNS Import Examples:
dns://my-dns-server/myzone.com
This URL will import all A records from the host my-dns-server on port 53 (default port) from zone "myzone.com" and since the foreign source (a.k.a. the provisioning group) is not specified it will default to the specified zone.
dns://my-dns-server/myzone.com/portland/?expression=^por-.*
This URL will import all nodes from the same server and zone but will only manage the nodes in the zone matching the regular expression ^port-.* and will and they will be assigned a unique foreign source (provisioning group) for managing these nodes as a subset of nodes from within the specified zone.
If your expression requires URL encoding (for example you need to use a ? in the expression) it must be properly encoded.
dns://my-dns-server/myzone.com/portland/?expression=^por[0-9]%3F
Currently, the DNS server requires to be setup to allow a zone transfer from the OpenNMS server. It is recommended that a secondary DNS server is running on OpenNMS and that the OpenNMS server be allowed to request a zone transfer. A quick way to test if zone transfers are working is:
dig -t AXFR @<dnsServer> <zone>
The configuration of the Provisoning system has moved from a properties file ('model-importer.properties') to an XML based configuration container. The configuration is now extensible to allow the definition of 0 or more import requisitions each with their own cron based schedule for automatic importing from various sources (intended for integration with external URL such as http and this new dns protocol handler.
A default configuration is provided in the OpenNMS 'etc/' directory and is called: 'provisiond-configuration.xml'. This default configuration has an example for scheduling an import from a DNS server running on the localhost requesting nodes from the zone, localhost and will be imported once per day at the stroke of midnight. Not very practical but is a good example.
<?xml version="1.0" encoding="UTF-8"?>
    <provisiond-configuration xmlns:xsi="http://www.w3.org/2001/XMLSchema-instance" xsi:schemaLocation="http://xmlns.opennms.org/xsd/config/provisiond-configuration"
                              foreign-source-dir="/opt/opennms/etc/foreign-sources"
                              requistion-dir="/opt/opennms/etc/imports"
                              importThreads="8"
                              scanThreads="10"
                              rescanThreads="10"
                              writeThreads="8" >

    <!--http://quartz.sourceforge.net/javadoc/org/quartz/CronTrigger.html
        Field Name Allowed Values Allowed Special Characters
        Seconds 0-59 , - * / Minutes 0-59 , - * / Hours 0-23 , - * /
        Day-of-month1-31, - * ? / L W C Month1-12 or JAN-DEC, - * /
        Day-of-Week1-7 or SUN-SAT, - * ? / L C # Year (Opt)empty, 1970-2099, - * /
    -->

    <requisition-def import-name="localhost"
                     import-url-resource="dns://localhost/localhost">

        <cron-schedule>0 0 0 * * ? *</cron-schedule> <!-- daily, at midnight -->
    </requisition-def>
</provisiond-configuration>Like many of the daemon configuration in the 1.7 branch, the configurations are reloadable without having to restart OpenNMS, using the reloadDaemonConfig uei:
/opt/opennms/bin/send-event.pl
uei.opennms.org/internal/reloadDaemonConfig --parm 'daemonName Provisiond'
This means that you don’t have to restart OpenNMS every time you update the configuration.
4.4. Provisioning Examples
Here are a few practical examples of enhanced directed discovery to help with your understanding of this feature.
4.4.1. Basic Provisioning
This example adds three nodes and requires no OpenNMS configuration other than specifying the node entities to be provisioned and managed in OpenNMS.
Defining the Nodes via the Web-UI
Using the Provisioning Groups Web-UI, three nodes are created given a single IP address. Navigate to the Admin Menu and click Provisioning Groups Menu from the list of Admin options and create the group Bronze.

Clicking the Add New Group button will create the group and will redisplay the page including this new group among the list of any group(s) that have already been created.
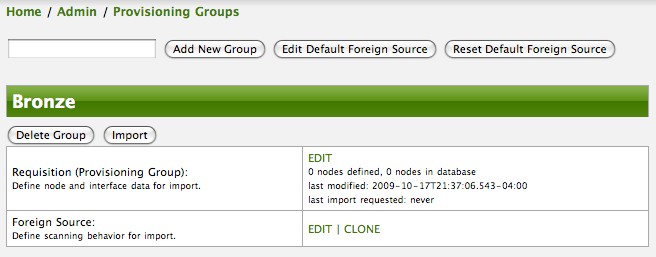
| At this point, the XML structure for holding the new provisioning group (a.k.a. an import requisition) has been persisted to the '$OPENNMS_ETC/imports/pending' directory. |
Clicking the Edit link will bring you to the screen where you can begin the process of defining node entities that will be imported into OpenNMS. Click the Add Node button will begin the node entity creation process fill in the node label and click the Save button.
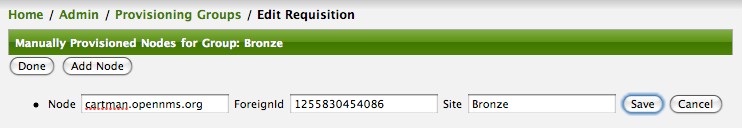
At this point, the provisioning group contains the basic structure of a node entity but it is not complete until the interface(s) and interface service(s) have been defined. After having clicked the Save button, as we did above presents, in the Web-UI, the options Add Interface, Add Node Category, and Add Node Asset. Click the Add Interface link to add an interface entity to the node.
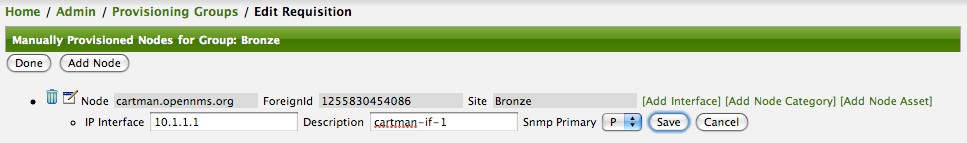
Enter the IP address for this interface entity, a description, and specify the Primary attribute as P (Primary), S (Secondary), N (Not collected), or C (Collected) and click the save button.
Now the node entity has an interface for which services can be defined for which the Web-UI now presents the Add Service link.
Add two services (ICMP, SNMP) via this link.
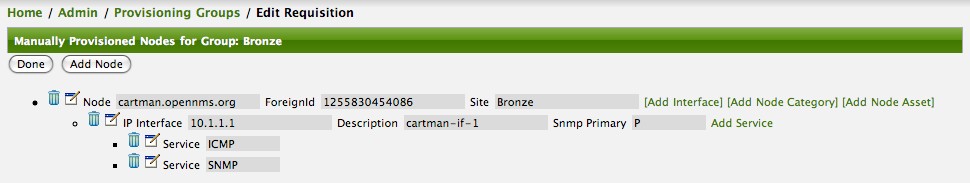
Now the node entity definition contains all the required elements necessary for importing this requisition into OpenNMS. At this point, all the interfaces that are required for the node should be added. For example, NAT interfaces should be specified there are services that they provide because they will not be discovered during the Scan Phase.
Two more node definitions will be added for the benefit of this example.
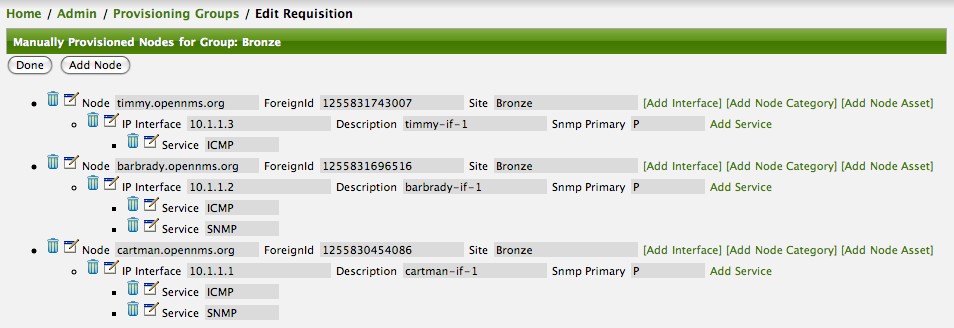
This set of nodes represents an import requisition for the Bronze provisioning group. As this requisition is being edited via the WebUI, changes are being persisted into the OpenNMS configuration directory '$OPENNMS_etc/imports/' pending as an XML file having the name 'bronze.xml'.
| The name of the XML file containing the import requisition is the same as the provisioning group name. Therefore naming your provisioning group without the use of spaces makes them easier to manage on the file system. |
Click the Done button to return to the Provisioning Groups list screen. The details of the “Bronze” group now indicates that there are 3 nodes in the requisition and that there are no nodes in the DB from this group (a.k.a. foreign source). Additionally, you can see that time the requisition was last modified and the time it last imported are given (the time stamps are stored as attributes inside the requisition and are not the file system time stamps). These details are indicative of how well the DB represents what is in the requisition.
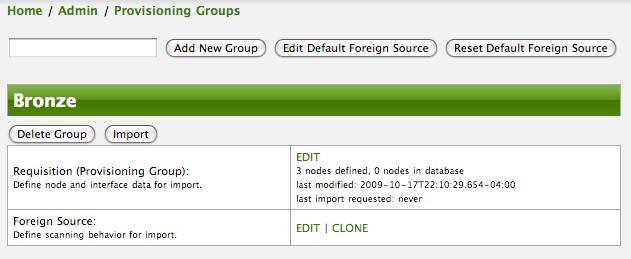
| You can tell that this is a pending requisition for 2 reasons: 1) there are 3 nodes defined and 0 nodes in the DB, 2) the requisition has been modified since the last import (in this case never). |
Import the Nodes
In this example, you see that there are 3 nodes in the pending requisition and 0 in the DB. Click the Import button to submit the requisition to the provisioning system (what actually happens is that the Web-UI sends an event to the Provisioner telling it to begin the Import Phase for this group).
| Do not refresh this page to check the values of these details. To refresh the details to verify the import, click the Provisioning Groups bread crumb item. |
You should be able to immediately verify the importation of this provisioning group because the import happens very quickly. Provisiond has several threads ready for processing the import operations of the nodes defined in this requisition.
A few SNMP packets are sent and received to get the SNMP details of the node and the interfaces defined in the requisition. Upon receipt of these packets (or not) each node is inserted as a DB transaction.
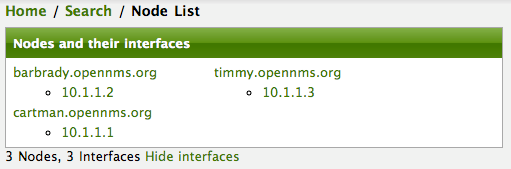
Following the import of a node with thousands of interfaces, you will be able to refresh the Interface table browser on the Node page and see that interfaces and services are being discovered and added in the background. This is the discovery component of directed discovery.
To direct that another node be added from a foreign source (in this example the Bronze Provisioning Group) simply add a new node definition and re-import. It is important to remember that all the node definitions will be re-imported and the existing managed nodes will be updated, if necessary.
Changing a Node
To direct changes to an existing node, simply add, change, or delete elements or attributes of the node definition and re- import. This is a great feature of having directed specific elements of a node in the requisition because that attributes will simply be changed. For example, to change the IP address of the Primary SNMP interface for the node, barbrady.opennms.org, just change the requisition and re-import.
Each element in the Web-UI has an associated Edit icon Click this icon to change the IP address for barbrady.opennms.org, click save, and then Click the Done button.

The Web-UI will return you to the Provisioning Groups screen where you will see that there are the time stamp showing that the requisition’s last modification is more recent that the last import time.
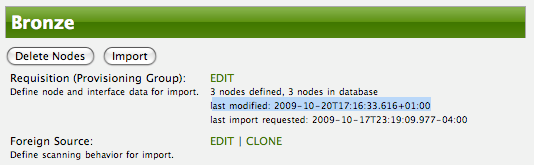
This provides an indication that the group must be re-imported for the changes made to the requisition to take effect. The IP Interface will be simply updated and all the required events (messages) will be sent to communicate this change within OpenNMS.
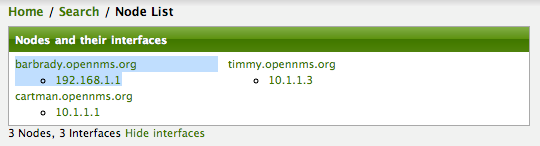
Deleting a Node
Barbrady has not been behaving, as one might expect, so it is time to remove him from the system. Edit the provisioning group, click the delete button next to the node barbrady.opennms.org, click the Done button.
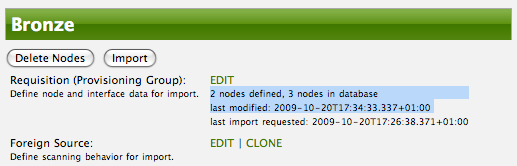
Click the Import button for the Bronze group and the Barbrady node and its interfaces, services, and any other related data will be immediately deleted from the OpenNMS system. All the required Events (messages) will be sent by Provisiond to provide indication to the OpenNMS system that the node Barbrady has been deleted.
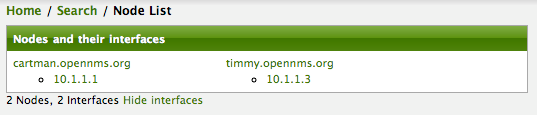
Deleting all the Nodes
There is a convenient way to delete all the nodes that have been provided from a specific foreign source. From the main Admin/Provisioning Groups screen in the Web-UI, click the Delete Nodes button. This button deletes all the nodes defined in the Bronze requisition. It is very important to note that once this is done, it cannot be undone! Well it can’t be undone from the Web-UI and can only be undone if you’ve been good about keeping a backup copy of your '$OPENMS_ETC/' directory tree. If you’ve made a mistake, before you re-import the requisition, restore the 'Bronze.xml' requisition from your backup copy to the '$OPENNMS_ETC/imports' directory.
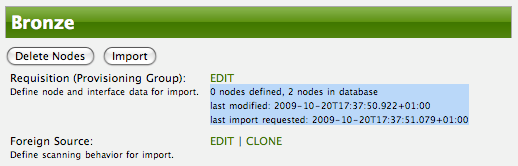
Clicking the Import button will cause the Audit Phase of Provisiond to determine that all the nodes from the Bronze group (foreign source) should be deleted from the DB and will create Delete operations. At this point, if you are satisfied that the nodes have been deleted and that you will no longer require nodes to be defined in this Group, you will see that the Delete Nodes button has now changed to the Delete Group button. The Delete Group button is displayed when there are no nodes entities from that group (foreign source) in OpenNMS.
When no node entities from the group exist in OpenNMS, then the Delete Group button is displayed.
4.4.2. Advanced Provisioning Example
In the previous example, we provisioned 3 nodes and let Provisiond complete all of its import phases using a default foreign source definition. Each Provisioning Group can have a separate foreign source definition that controls:
-
The rescan interval
-
The services to be detected
-
The policies to be applied
This example will demonstrate how to create a foreign source definition and how it is used to control the behavior of Provisiond when importing a Provisioning Group/foreign source requisition.
First let’s simply provision the node and let the default foreign source definition apply.
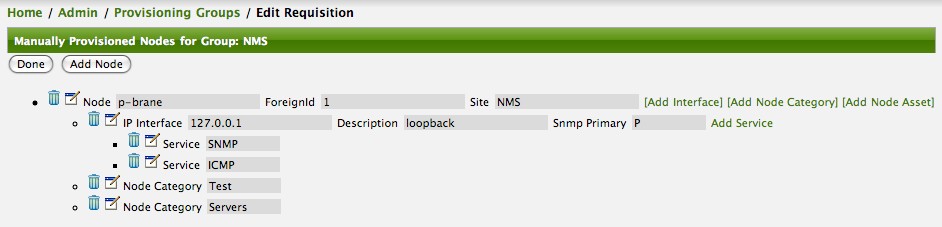
Following the import, All the IP and SNMP interfaces, in addition to the interface specified in the requisition, have been discovered and added to the node entity. The default foreign source definition has no polices for controlling which interfaces that are discovered either get persisted or managed by OpenNMS.
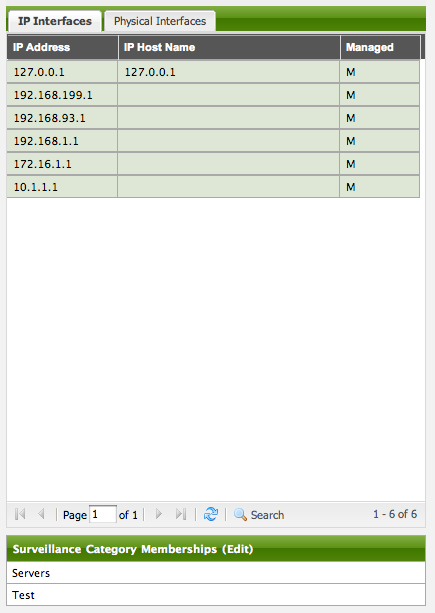
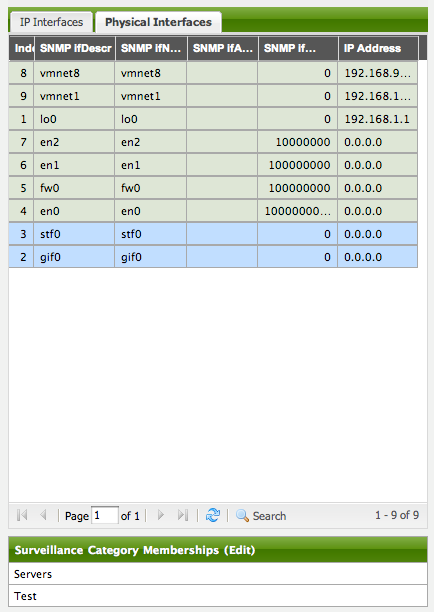
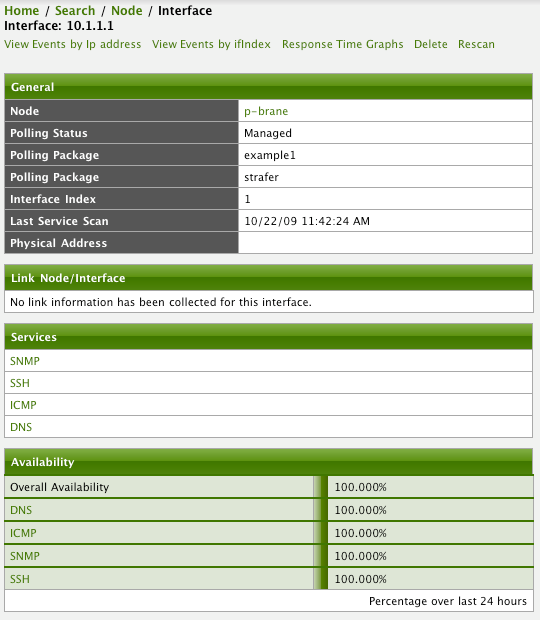
Service Detection
As IP interfaces are found during the node scan process, service detection tasks are scheduled for each IP interface. The service detections defined in the foreign source determines which services are to be detected and how (i.e. the values of the parameters that parameters control how the service is detected, port, timeout, etc.).
Applying a New Foreign Source Definition
This example node has been provisioned using the Default foreign source definition. By navigating to the Provisioning Groups screen in the OpenNMS Web-UI and clicking the Edit Foreign Source link of a group, you can create a new foreign source definition that defines service detection and policies. The policies determine entity persistence and/or set attributes on the discovered entities that control OpenNMS’ management behaviors.
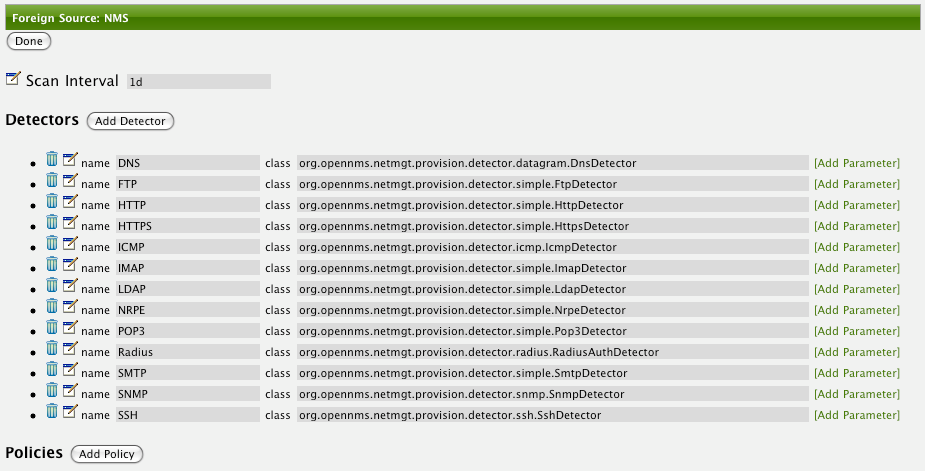
In this UI, new Detectors can be added, changed, and removed. For this example, we will remove detection of all services accept ICMP and DNS, change the timeout of ICMP detection, and a new Service detection for OpenNMS Web-UI.
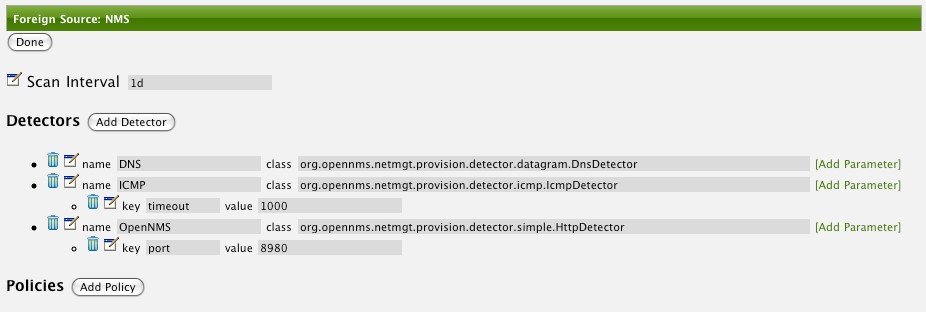
Click the Done button and re-import the NMS Provisioning Group. During this and any subsequent re-imports or re- scans, the OpenNMS detector will be active, and the detectors that have been removed will no longer test for the related services for the interfaces on nodes managed in the provisioning group (requisition), however, the currently detected services will not be removed. There are 2 ways to delete the previously detected services:
-
Delete the node in the provisioning group, re-import, define it again, and finally re-import again
-
Use the ReST API to delete unwanted services. Use this command to remove each unwanted service from each interface, iteratively:
curl -X DELETE -H "Content-Type: application/xml" -u admin:admin http://localhost:8980/opennms/rest/nodes/6/ipinterfaces/172.16.1.1/services/DNS
| There is a sneaky way to do #1. Edit the provisioning group and just change the foreign ID. That will make Provisiond think that a node was deleted and a new node was added in the same requisition! Use this hint with caution and an full understanding of the impact of deleting an existing node. |
Provisioning with Policies
The Policy API in Provisiond allow you to control the persistence of discovered IP and SNMP Interface entities and Node Categories during the Scan phase.
The Matching IP Interface policy controls whether discovered I interfaces are to be persisted and if they are to be persisted, whether or not they will be forced to be Managed or Unmanaged.
Continuing with this example Provisioning Group, we are going to define a few policies that:
-
Prevent discovered 10 network addresses from being persisted
-
Force 192.168 network addresses to be unmanaged
From the foreign source definition screen, click the Add Policy button and you the definition of a new policy will begin with a field for naming the policy and a drop down list of the currently installed policies. Name the policy no10s, make sure that the Match IP Interface policy is specified in the class list and click the Save button. This action will automatically add all the parameters required for the policy.
The two required parameters for this policy are action and matchBehavior.
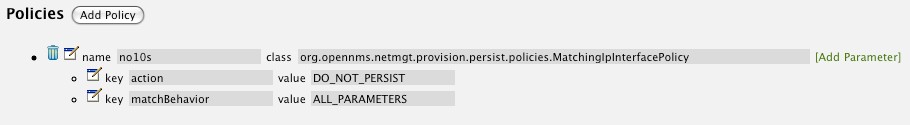
The DO_NOT_PERSIST action does just what it indicates, it prevents discovered IP interface entities from being added to OpenNMS when the matchBehavior is satisfied. The Manage and UnManage values for this action allow the IP interface entity to be persisted by control whether or not that interface should be managed by OpenNMS.
The matchBehavior action is a boolean control that determines how the optional parameters will be evaluated. Setting this parameter’s value to ALL_PARAMETERS causes Provisiond to evaluate each optional parameter with boolean AND logic and the value ANY_PARAMETERS will cause OR logic to be applied.
Now we will add one of the optional parameters to filter the 10 network addresses.
The Matching IP Interface policy supports two additional parameters, hostName and ipAddress.
Click the Add Parameter link and choose ipAddress as the key.
The value for either of the optional parameters can be an exact or regular expression match.
As in most configurations in OpenNMS where regular expression matching can be optionally applied, prefix the value with the ~ character.
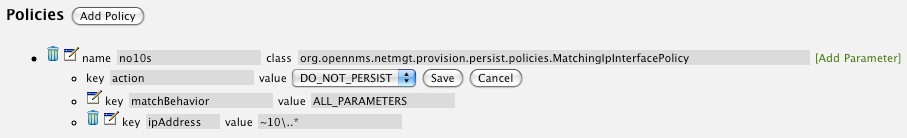
Any subsequent scan of the node or re-imports of NMS provisioning group will force this policy to be applied. IP Interface entities that already exist that match this policy will not be deleted. Existing interfaces can be deleted by recreating the node in the Provisioning Groups screen (simply change the foreign ID and re-import the group) or by using the ReST API:
curl -X DELETE -H "Content-Type: application/xml" -u admin:admin http://localhost:8980/opennms/rest/nodes/6/ipinterfaces/10.1.1.1
The next step in this example is to define a policy that sets discovered 192.168 network addresses to be unmanaged (not managed) in OpenNMS. Again, click the Add Policy button and let’s call this policy noMgt192168s. Again, choose the Mach IP Interface policy and this time set the action to UNMANAGE.
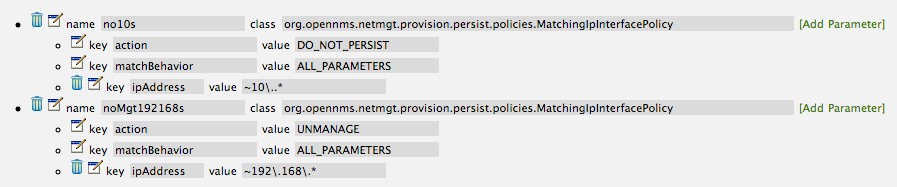
| The UNMANAGE behavior will be applied to existing interfaces. |
Like the Matching IP Interface Policy, this policy controls the whether discovered SNMP interface entities are to be persisted and whether or not OpenNMS should collect performance metrics from the SNMP agent for Interface’s index (MIB2 IfIndex).
In this example, we are going to create a policy that doesn’t persist interfaces that are AAL5 over ATM or type 49 (ifType). Following the same steps as when creating an IP Management Policy, edit the foreign source definition and create a new policy. Let’s call it: noAAL5s. We’ll use Match SNMP Interface class for each policy and add a parameter with ifType as the key and 49 as the value.
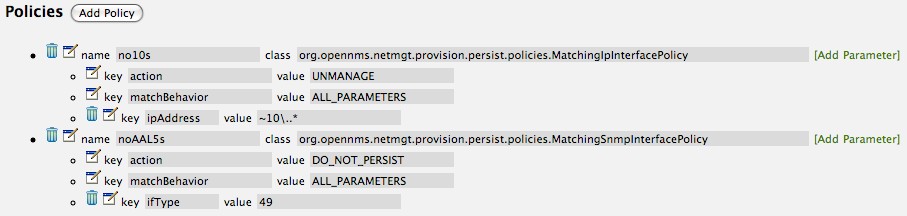
| At the appropriate time during the scanning phase, Provisiond will evaluate the policies in the foreign source definition and take appropriate action. If during the policy evaluation process any policy matches for a “DO_NOT_PERSIST” action, no further policy evaluations will happen for that particular entity (IP Interface, SNMP Interface). |
With this policy, nodes entities will automatically be assigned categories.
The policy is defined in the same manner as the IP and SNMP interface polices.
Click the Add Policy button and give the policy name, cisco and choose the Set Node Category class.
Edit the required category key and set the value to Cisco.
Add a policy parameter and choose the sysObjectId key with a value ~^\.1\.3\.6\.1\.4\.1\.9\..*.
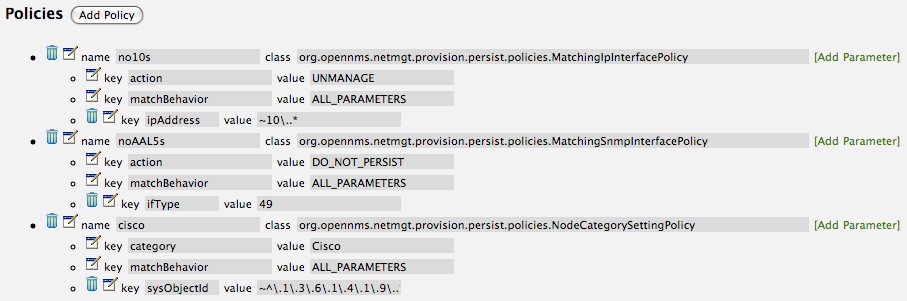
New Import Capabilities
Several new XML entities have been added to the import requisition since the introduction of the OpenNMS Importer service in version 1.6. So, in addition to provisioning the basic node, interface, service, and node categories, you can now also provision asset data.
Provisiond Configuration
The configuration of the Provisioning system has moved from a properties file ('model-importer.properties') to an XML based configuration container. The configuration is now extensible to allow the definition of 0 or more import requisitions each with their own Cron based schedule for automatic importing from various sources (intended for integration with external URL such as HTTP and this new DNS protocol handler.
A default configuration is provided in the OpenNMS 'etc/' directory and is called: 'provisiond-configuration.xml'. This default configuration has an example for scheduling an import from a DNS server running on the localhost requesting nodes from the zone, localhost and will be imported once per day at the stroke of midnight. Not very practical but is a good example.
<?xml version="1.0" encoding="UTF-8"?>
    <provisiond-configuration xmlns:xsi="http://www.w3.org/2001/XMLSchema-instance" xsi:schemaLocation="http://xmlns.opennms.org/xsd/config/provisiond-configuration"
        foreign-source-dir="/opt/opennms/etc/foreign-sources"
        requistion-dir="/opt/opennms/etc/imports"
        importThreads="8"
        scanThreads="10"
        rescanThreads="10"
        writeThreads="8" >
    <!--
        http://quartz.sourceforge.net/javadoc/org/quartz/CronTrigger.html[http://quartz.sourceforge.net/javadoc/org/quartz/CronTrigger.html]
        Field Name Allowed Values Allowed Special Characters
        Seconds 0-59 , - * / Minutes 0-59 , - * / Hours 0-23 , - * /
        Day-of-month1-31, - * ? / L W C Month1-12 or JAN-DEC, - * /
        Day-of-Week1-7 or SUN-SAT, - * ? / L C # Year (Opt)empty, 1970-2099, - * /
    -->

    <requisition-def import-name="NMS"
                     import-url-resource="file://opt/opennms/etc/imports/NMS.xml">
        <cron-schedule>0 0 0 * * ? *</cron-schedule> <!-- daily, at midnight -->
    </requisition-def>
</provisiond-configuration>Like many of the daemon configurations in the 1.7 branch, Provisiond’s configuration is re-loadable without having to restart OpenNMS. Use the reloadDaemonConfig uei:
/opt/opennms/bin/send-event.pl uei.opennms.org/internal/reloadDaemonConfig --parm 'daemonName Provisiond'
This means that you don’t have to restart OpenNMS every time you update the configuration!
Provisioning Asset Data
The Provisioning Groups Web-UI had been updated to expose the ability to add Node Asset data in an import requisition. Click the Add Node Asset link and you can select from a drop down list all the possible node asset attributes that can be defined.
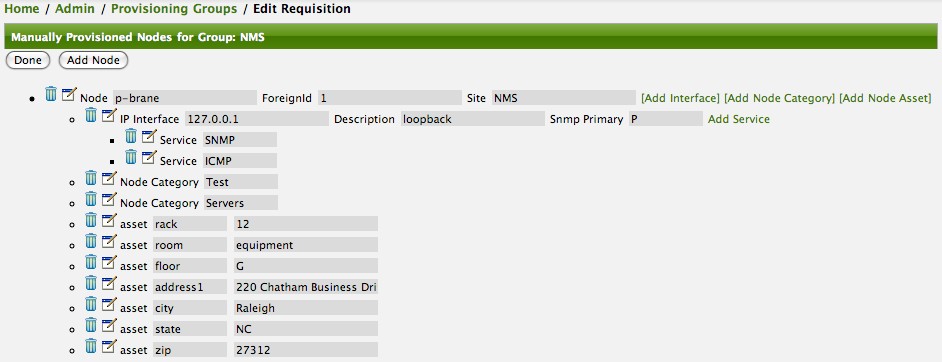
After an import, you can navigate to the Node Page and click the Asset Info link and see the asset data that was just provided in the requisition.
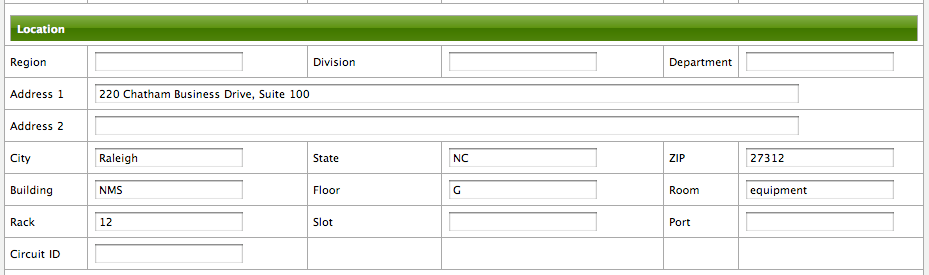
External Requisition Sources
Because Provisiond takes a URL as the location service for import requisitions, OpenNMS can be easily extended to support sources in addition to the native URL handling provided by Java: file://, http://, and https://. When you configure Provisiond to import requisitions on a schedule you specify using a URL Resource. For requisitions created by the Provisioning Groups WebUI, you can specify a file based URL.
| <need further documentation> |
Provisioning Nodes from DNS
The new Provisioning service in OpenNMS is continuously improving and adapting to the needs of the community. One of the most recent enhancements to the system is built upon the very flexible and extensible API of referencing an import requisition’s location via a URL. Most commmonly, these URLs are files on the file system (i.e. 'file:/opt/opennms/etc/' 'imports/<my-provisioning-group.xml>') as requisitions created by the Provisioning Groups UI. However, these same requistions for adding, updating, and deleting nodes (based on the original model importer) can also come from URLs specifying the HTTP protocol: http://myinventory.server.org/nodes.cgi)
Now, using Java’s extensible protocol handling specification, a new protocol handler was created so that a URL can be specified for requesting a Zone Transfer (AXFR) request from a DNS server. The A records are recorded and used to build an import requisition. This is handy for organizations that use DNS (possibly coupled with an IP management tool) as the data base of record for nodes in the network. So, rather than ping sweeping the network or entering the nodes manually into OpenNMS Provisioning UI, nodes can be managed via 1 or more DNS servers. The format of the URL for this new protocol handler is:
dns://<host>[:port]/<zone>[/<foreign-source>/][?expression=<regex>]
dns://my-dns-server/myzone.com
This will import all A records from the host my-dns-server on port 53 (default port) from zone myzone.com and since the foreign source (a.k.a. the provisioning group) is not specified it will default to the specified zone.
You can also specify a subset of the A records from the zone transfer using a regular expression:
dns://my-dns-server/myzone.com/portland/?expression=^por-.*
This will import all nodes from the same server and zone but will only manage the nodes in the zone matching the regular expression ^port-.* and will and they will be assigned a unique foreign source (provisioning group) for managing these nodes as a subset of nodes from within the specified zone.
If your expression requires URL encoding (for example you need to use a ? in the expression) it must be properly encoded.
dns://my-dns-server/myzone.com/portland/?expression=^por[0-9]%3F
Currently, the DNS server requires to be setup to allow a zone transfer from the OpenNMS server. It is recommended that a secondary DNS server is running on OpenNMS and that the OpenNMS server be allowed to request a zone transfer. A quick way to test if zone transfers are working is:
dig -t AXFR @<dn5Server> <zone>
4.5. Adapters
The OpenNMS Provisiond API also supports Provisioning Adapters (plugins) for integration with external systems during the provisioning Import phase. When node entities are added, updated, deleted, or receive a configuration management change event, OpenNMS will call the adapter for the provisioning activities with integrated systems.
Currently, OpenNMS supports the following adapters:
4.5.1. DDNS Adapter
The Opposite end of Provisiond integration from the DNS Requisition Import, is the DDNS adapter.
This adapter uses the dynamic DNS protocol to update a DNS system as nodes are provisioned into OpenNMS.
To configure this adapter, edit the 'opennms.properties' file and set the importer.adapter.dns.server property:
importer.adapter.dns.server=192.168.1.1
4.5.2. RANCID Adapter
Integration has been integrated with RANCID though this new API.
| <More documentation needed> |
| Maps (soon to be moved to Mapd) <documentation required> |
| WiMax-Link (soon to be moved to Linkd) <documentation required> |
4.6. Integrating with Provisiond
The ReST API should be used for integration from other provisioning systems with OpenNMS. The ReST API provides an interface for defining foreign sources and requisitions.
4.6.1. Provisioning Groups of Nodes
Just as with the WebUI, groups of nodes can be managed via the ReST API from an external system. The steps are:
-
Create a Foreign Source (if not using the default) for the group
-
Update the SNMP configuration for each node in the group
-
Create/Update the group of nodes
4.6.2. Example
Step 1 - Create a Foreign Source
If policies for this group of nodes are going to be specified differently than the default policy, then a foreign source should be created for the group. Using the ReST API, a foreign source can be provided. Here is an example:
The XML can be imbedded in the curl command option -d or be referenced from a file if the @ prefix is used with the file name as in this case.
|
The XML file: 'customer-a.foreign-source.xml':
<?xml version="1.0" encoding="UTF-8" standalone="yes"?>
<foreign-source date-stamp="2009-10-12T17:26:11.616-04:00" name="customer-a" xmlns="http://xmlns.opennms.org/xsd/config/foreign-source">
    <scan-interval>1d</scan-interval>
    <detectors>
        <detector class="org.opennms.netmgt.provision.detector.icmp.IcmpDetector" name="ICMP"/>
        <detector class="org.opennms.netmgt.provision.detector.snmp.SnmpDetector" name="SNMP"/>
    </detectors>
    <policies>
        <policy class="org.opennms.netmgt.provision.persist.policies.MatchingIpInterfacePolicy" name="no-192-168">
            <parameter value="UNMANAGE" key="action"/>
            <parameter value="ALL_PARAMETERS" key="matchBehavior"/>
            <parameter value="~^192\.168\..*" key="ipAddress"/>
        </policy>
    </policies>
</foreign-source>
Here is an example curl command used to create the foreign source with the above foreign source specification above:
curl -v -u admin:admin -X POST -H 'Content-type: application/xml' -d '@customer-a.foreign-source.xml' http://localhost:8980/opennms/rest/foreignSources
Now that you’ve created the foreign source, it needs to be deployed by Provisiond.
Here an the example using the curl command to deploy the foreign source:
curl -v -u admin:admin http://localhost:8980/opennms/rest/foreignSources/pending/customer-a/deploy -X PUT
| The current API doesn’t strictly follow the ReST design guidelines and will be updated in a later release. |
Step 2 - Update the SNMP configuration
The implementation only supports a PUT request because it is an implied "Update" of the configuration since it requires an IP address and all IPs have a default configuration.
This request is is passed to the SNMP configuration factory in OpenNMS for optimization of the configuration store 'snmp-config.xml'.
This example changes the community string for the IP address 10.1.1.1 to yRuSonoZ.
| Community string is the only required element |
curl -v -X PUT -H "Content-Type: application/xml" -H "Accept: application/xml" -d <snmp-info><community>yRuSonoZ</community><port>161</port><retries>1</retries><timeout>2000</timeout><version>v2c</version></snmp-info>" -u admin:admin http://localhost:8980/opennms/rest/snmpConfig/10.1.1.1
Step 3 - Create/Update the Requisition
This example adds 2 nodes to the Provisioning Group, customer-a. Note that the foreign-source attribute typically has a 1 to 1 relationship to the name of the Provisioning Group requisition. There is a direct relationship between the foreign- source attribute in the requisition and the foreign source policy specification. Also, typically, the name of the provisioning group will also be the same. In the following example, the ReST API will automatically create a provisioning group based on the value foreign-source attribute specified in the XML requisition.
curl -X POST -H "Content-Type: application/xml" -d "<?xml version="1.0" encoding="UTF-8"?><model-import xmlns="http://xmlns.opennms.org/xsd/config/model-import" date-stamp="2009-03-07T17:56:53.123-05:00" last-import="2009-03-07T17:56:53.117-05:00" foreign-source="customer-a"><node node-label="p-brane" foreign-id="1" ><interface ip-addr="10.0.1.3" descr="en1" status="1" snmp-primary="P"><monitored-service service-name="ICMP"/><monitored-service service-name="SNMP"/></interface><category name="Production"/><category name="Routers"/></node><node node-label="m-brane" foreign-id="1" ><interface ip-addr="10.0.1.4" descr="en1" status="1" snmp-primary="P"><monitored-service service-name="ICMP"/><monitored-service service-name="SNMP"/></interface><category name="Production"/><category name="Routers"/></node></model-import>" -u admin:admin http://localhost:8980/opennms/rest/requisitions
A provisioning group file called 'etc/imports/customer-a.xml' will be found on the OpenNMS system following the successful completion of this curl command and will also be visible via the WebUI.
| Add, Update, Delete operations are handled via the ReST API in the same manner as described in detailed specification. |
4.7. Provisioning Single Nodes (Quick Add Node)
Often, it is requested that a single node add/update be completed for an already defined provisioning group. There is a ReST API for the Add Node implementation found in the OpenNMS Web-UI. For this to work, the provisioning group must already exist in the system even if there are no nodes defined in the group.
-
Create a foreign source (if required)
-
Specify SNMP configuration
-
Provide a single node with the following specification
4.8. Fine Grained Provisioning Using provision.pl
We have created a Perl script to help your team with this provisioning. It is in the '/opt/opennms/bin/' directory when you install from our SNAPSHOT builds. The script has most all the operations you need for interfacing from WAVE and you should be able to use it or duplicate the code in WAVE. The options that are not available can be added to the script if you need them but everything is fully available in the REST interface. The script provides an easy interface to the REST API and should help a lot but making the examples easier to read and having code to inspect sometimes makes understanding the API much easier, as well.
The script '/opt/opennms/bin/provision.pl', has many options but the first 3 optional parameters are described here:
You can use --help to the script to see all the available options.
|
--username (default: admin)
--password (default: admin)
--url (default: http://localhost:8980/opennms/rest)
We stand-by to help with any questions they may have. Additionally, we should get the latest software installed so that they can start testing. It would be good to have installs from the nightly SNAPSHOT builds so that we can keep it easily and quickly updated if there are any changes we have to make for you.
4.8.1. First, Create a new Provisioning Group
Provisioning Groups are created with import requisitions. The script provides an easy access to the REST API using the requisition option:
/opt/opennms/bin/provision.pl requisition customer1
This command will create a new requisition (provisioning group) in the '/opt/opennms/etc/imports/pending/' directory. It will be an empty requisition (provisioning group). Empty meaning there will be the import definition only with no nodes.
| Notice that the group is in the 'pending' directory. This allows you to iteratively create the group and then later actually import/provide the nodes in the group into OpenNMS. This hands all adds/changes/deletes at once. So, you could be making changes all day and then at night either have a schedule in OpenNMS that imports the group automatically or you can send a command through the REST service from WAVE to have the pending group imported/reimported. This is defined in the docs. |
$ cat /opt/opennms/etc/imports/pending/customer1.xml
<?xml version="1.0" encoding="UTF-8" standalone="yes"?>
<model-import foreign-source="customer1"
              date-stamp="2010-01-12T09:29:23.104-05:00"
              xmlns="http://xmlns.opennms.org/xsd/config/model-import">
</model-import>
You can also get a list of all existing provisioning groups (import requisitions) with the list option of the provision.pl script:
/opt/opennms/bin/provision.pl list
4.8.2. Add a Node to an Existing Provisioning Group
Okay, the script we provided helps one to managed provisioning group elements at a very fine grained level. This example shows you how tohandle adding a node and all the node elements with fine grained requests. Note, that you could create the resulting XML in WAVE and send the entire group as an XML document to the REST API as I’ve attempted to document in the docs. I will be including this example in a updated version of the docs, ASAP.
Create the Node Element
/opt/opennms/bin/provision.pl node add customer1 1 node-a
This command creates a node element in the provisioning group (a.k.a requisition) customer1 called node-a using the scripts node option. Note it has no interfaces or services, yet.
<?xml version="1.0" encoding="UTF-8" standalone="yes"?>
<model-import foreign-source="customer1"
              date-stamp="2010-01-12T09:29:23.104-05:00" xmlns="http://xmlns.opennms.org/xsd/config/model-import">
    <node node-label="node-a" foreign-id="1"/>
</model-import>
Add a Interface Element to that Node
/opt/opennms/bin/provision.pl interface add customer1 1 127.0.0.1
This command adds an interface element to the node element using the interface option to the 'provision.pl' command and it can now be seen in the pending requisition:
<?xml version="1.0" encoding="UTF-8" standalone="yes"?>
<model-import foreign-source="customer1"
              date-stamp="2010-01-12T09:31:21.029-05:00" xmlns="http://xmlns.opennms.org/xsd/config/model-import">
    <node node-label="node-a" foreign-id="1">
        <interface ip-addr="127.0.0.1"/>
    </node>
</model-import>
Add a Couple of Services to that Interface
/opt/opennms/bin/provision.pl service add customer1 1 127.0.0.1 ICMP
/opt/opennms/bin/provision.pl service add customer1 1 127.0.0.1 SNMP
This adds the 2 services to the specified 127.0.0.1 interface and is now in the pending XML document.
| These Services must already be defined in the foreign-source definition for this group. There is a default foreign source definition, btw. This is covered in the docs we provided. |
<?xml version="1.0" encoding="UTF-8" standalone="yes"?>
<model-import foreign-source="customer1"
              date-stamp="2010-01-12T09:32:14.885-05:00" xmlns="http://xmlns.opennms.org/xsd/config/model-import">
    <node node-label="node-a" foreign-id="1">
        <interface ip-addr="127.0.0.1">
            <monitored-service service-name="ICMP"/>
            <monitored-service service-name="SNMP"/>
        </interface>
    </node>
</model-import>
Set the Primary SNMP Interface
/opt/opennms/bin/provision.pl interface set customer1 1 127.0.0.1 snmp-primary P
This sets the 127.0.0.1 interface to be the Primary SNMP interface:
<?xml version="1.0" encoding="UTF-8" standalone="yes"?>
<model-import last-import="2010-01-12T09:37:27.373-05:00"
              foreign-source="customer1" date- stamp="2010-01-12T11:12:23.738-05:00" xmlns="http://xmlns.opennms.org/xsd/config/model-import">
    <node node-label="node-a" foreign-id="1">
        <interface snmp-primary="P" ip-addr="127.0.0.1">
            <monitored-service service-name="ICMP"/>
            <monitored-service service-name="SNMP"/>
        </interface>
    </node>
</model-import>
Add a couple Node Categories
/opt/opennms/bin/provision.pl category add customer1 1 Routers
/opt/opennms/bin/provision.pl category add customer1 1 Production
This adds the 2 categories to the node and is now in the pending XML document.
| These categories are: a) case sensitive and b) do not have to already be defined in OpenNMS. They will be created on the fly during the import if they do not already exist. |
<?xml version="1.0" encoding="UTF-8" standalone="yes"?>
<model-import foreign-source="customer1"
              date-stamp="2010-01-12T09:33:57.740-05:00" xmlns="http://xmlns.opennms.org/xsd/config/model-import">
    <node node-label="node-a" foreign-id="1">
        <interface ip-addr="127.0.0.1">
            <monitored-service service-name="ICMP"/>
            <monitored-service service-name="SNMP"/>
        </interface>
        <category name="Servers"/>
        <category name="Production"/>
    </node>
</model-import>
Setting Asset Fields on a Node
/opt/opennms/bin/provision.pl asset add customer1 1 serialnumber 9999
This will add value of 9999 to the asset field: serialnumber:
<?xml version="1.0" encoding="UTF-8" standalone="yes"?>
<model-import foreign-source="customer1"
              date-stamp="2010-01-12T09:35:48.343-05:00" xmlns="http://xmlns.opennms.org/xsd/config/model-import">
    <node node-label="node-a" foreign-id="1">
        <interface ip-addr="127.0.0.1">
            <monitored-service service-name="ICMP"/>
            <monitored-service service-name="SNMP"/>
        </interface>
        <category name="Servers"/>
        <category name="Production"/>
        <asset value="9999" name="serialnumber"/>
    </node>
</model-import>/opt/opennms/bin/provision.pl requisition import customer1
This will cause OpenNMS Provisiond to import the pending requisition. The XML document will moved from the '/opt/' 'opennms/imports/pending' directory to the '/opt/opennms/imports' directory. The philosophy is that the XML document in the 'imports/' directory should be reflective of what is actually supposed to be in the DB.
| The behavior changed. Mixing ReST and UI is dangerous. |
Very much the same as the add, accept, a single delete command and a re-import is required. What happens is that the audit phase is run by Provisiond (this is detailed in the docs we sent) and it will be determined that a node has been removed from the group (requisition) and the node will be deleted from the DB and all services will stop activities related to it.
/opt/opennms/bin/provision.pl node delete customer1 1 node-a
/opt/opennms/bin/provision.pl requisition import customer1
This, also, will create a copy of the currently deployed requisition, remove the node-a node element, and place it in the pending directory, so it too must be deployed so that the node is removed from the provisioning group.
/opt/opennms/bin/provision.pl requisition import customer1
This completes the life cycle of managing a node element, iteratively, in a import requisition.
4.9. Yet Other API Examples
The 'provision.pl' script doesn’t supply this feature but you can get it via the REST API. Here is an example using curl:
#!/bin/bash
REQ=$1
curl -X GET -H "Content-Type: application/xml" -u admin:admin http://localhost:8980/opennms/rest/requisitions/$REQ 2>/dev/null | xmllint --format -