1. About This Guide
Welcome to the OpenNMS Horizon Administrators Guide. This documentation provides information and procedures on setup, configuration, and use of the OpenNMS Horizon platform. Using a task-based approach, chapters appear in a recommended order for working with OpenNMS Horizon:
-
Opt in or out of usage statistics collection (requirement during first login).
-
Create users and security roles.
-
Provision your system.
1.1. Audience
This guide is suitable for administrative users and those who will use OpenNMS Horizon to monitor their network.
1.2. Related Documentation
Installation Guide: how to install OpenNMS Horizon
Developers Guide: information and procedures on developing for the OpenNMS Horizon project
OpenNMS 101: a series of video training tutorials that build on each other to get you up and running with OpenNMS Horizon
OpenNMS 102: a series of stand-alone video tutorials on OpenNMS features
OpenNMS Helm: a guide to OpenNMS Helm, an application for creating flexible dashboards to interact with data stored by OpenNMS
Architecture for Learning Enabled Correlation (ALEC): guide to this framework for logically grouping related faults (alarms) into higher level objects (situations) with OpenNMS.
1.3. Typographical Conventions
This guide uses the following typographical conventions:
Convention |
Meaning |
|---|---|
bold |
Indicates UI elements to click or select in a procedure, and the names of UI elements like dialogs or icons. |
italics |
Introduces a defined or special word. Also used for the titles of publications. |
|
Anything you must type or enter, and the names for code-related elements (classes, methods, commands). |
1.4. Need Help?
-
join the OpenNMS Discussion chat
-
join our community on Discourse
-
contact sales@opennms.com to purchase customer support
2. Data Choices
The first time a user with the Admin role logs into the system, a prompt appears for permission to allow the Data Choices module to collect and publish anonymous usage statistics to https://stats.opennms.org.
The OpenNMS Group uses this information to help determine product usage, and improve the OpenNMS Horizon software.
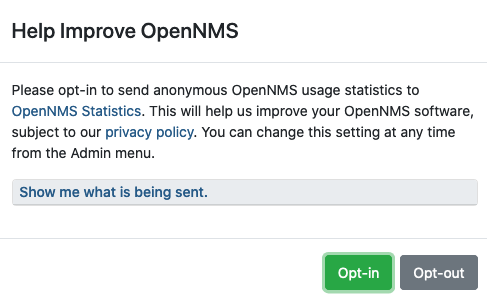
Click Show me what is being sent to see what information is being collected. Statisitcs collection and publication happen only once an admin user opts-in.
When enabled, the following anonymous statistics are collected and published on system startup and every 24 hours after:
-
System ID (a randomly generated UUID)
-
OpenNMS Horizon Release
-
OpenNMS Horizon Version
-
OS Architecture
-
OS Name
-
OS Version
-
Number of alarms in the
alarmstable -
Number of events in the
eventstable -
Number of IP interfaces in the
ipinterfacetable -
Number of nodes in the
nodetable -
Number of nodes, grouped by System OID
| You can enable or disable usage statistics collection at any time by choosing admin>Configure OpenNMS>Additional Tools>Data Choices and choosing Opt-in or Opt-out in the UI. |
3. User Management
Users are entities with login accounts in the OpenNMS Horizon system. Ideally each user corresponds to a person. An OpenNMS Horizon User represents an actor which may be granted permissions in the system by associating Security Roles. OpenNMS Horizon stores by default User information and credentials in a local embedded file based storage. Credentials and user details, e.g. contact information, descriptions or Security Roles can be managed through the Admin Section in the Web User Interface.
Beside local Users, external authentication services including LDAP / LDAPS, RADIUS, and SSO can be configured. Configuration specifics for these services are outside the scope of this section.
The following paragraphs describe how to manage the embedded User and Security Roles in OpenNMS Horizon.
3.1. Users
Managing Users is done through the Web User Interface and requires to login as a User with administrative permissions.
By default the admin user is used to initially create and modify Users.
The User, Password and other detail descriptions are persisted in users.xml file.
It is not required to restart OpenNMS Horizon when User attributes are changed.
In case administrative tasks should be delegated to an User the Security Role named ROLE_ADMIN can be assigned.
| Don’t delete the admin and rtc user. The RTC user is used for the communication of the Real-Time Console on the start page to calculate the node and service availability. |
| Change the default admin password to a secure password. |
-
Login as a User with administrative permissions
-
Choose Configure OpenNMS from the user specific main navigation which is named as your login user name
-
Choose Configure Users, Groups and On-Call roles and select Configure Users
-
Click the Modify icon next to an existing User and select Reset Password
-
Set a new Password, Confirm Password and click OK
-
Click Finish to persist and apply the changes
-
Login with user name and old password
-
Choose Change Password from the user specific main navigation which is named as your login user name
-
Select Change Password
-
Identify yourself with the old password and set the new password and confirm
-
Click Submit
-
Logout and login with your new password
-
Login as a User with administrative permissions
-
Choose Configure OpenNMS from the user specific main navigation which is named as your login user name
-
Choose Configure Users, Groups and On-Call roles and select Configure Users
-
Use Add new user and type in a login name as User ID and a Password with confirmation or click Modify next to an existing User
-
Optional: Fill in detailed User Information to provide more context information around the new user in the system
-
Optional: Assign Security Roles to give or remove permissions in the system
-
Optional: Provide Notification Information which are used in Notification targets to send messages to the User
-
Optional: Set a schedule when a User should receive Notifications
-
Click Finish to persist and apply the changes
| Please note that angle brackets (<>), single (') and double quotation marks ("), and the ampersand symbol (&) are not allowed to be used in the user ID. |
| By default a new User has the Security Role similar to ROLE_USER assigned. Acknowledgment and working with Alarms and Notifications is possible. The Configure OpenNMS administration menu is not available. |
-
Login as a User with administrative permissions
-
Choose Configure OpenNMS from the user specific main navigation which is named as your login user name
-
Choose Configure Users, Groups and On-Call roles and select Configure Users
-
Use the trash bin icon next to the User to delete
-
Confirm delete request with OK
3.2. Security Roles
A Security Roles is a set of permissions and can be assigned to an User. They regulate access to the Web User Interface and the ReST API to exchange monitoring and inventory information. In case of a distributed installation, the Minion or Remote Poller instances interact with OpenNMS Horizon and require specific permissions which are defined in the Security Roles ROLE_MINION and ROLE_REMOTING. The following Security Roles are available:
| Security Role Name | Description |
|---|---|
anyone |
In case the |
ROLE_ANONYMOUS |
Allows HTTP OPTIONS request to show allowed HTTP methods on a ReST resources and the login and logout page of the Web User Interface. |
ROLE_ADMIN |
Permissions to create, read, update and delete in the Web User Interface and the ReST API. |
ROLE_ASSET_EDITOR |
Permissions to just update the asset records from nodes. |
ROLE_DASHBOARD |
Allow users to just have access to the Dashboard. |
ROLE_DELEGATE |
Allows actions (such as acknowledging an alarm) to be performed on behalf of another user. |
ROLE_JMX |
Allows retrieving JMX metrics but does not allow executing MBeans of the OpenNMS Horizon JVM, even if they just return simple values. |
ROLE_MINION |
Minimal amount of permissions required for a Minion to operate. |
ROLE_MOBILE |
Allow user to use OpenNMS COMPASS mobile application to acknowledge Alarms and Notifications via the ReST API. |
ROLE_PROVISION |
Allow user to use the Provisioning System and configure SNMP in OpenNMS Horizon to access management information from devices. |
ROLE_READONLY |
Limited to just read information in the Web User Interface and are no possibility to change Alarm states or Notifications. |
ROLE_REMOTING |
Permissions to allow access from a Remote Poller instance to exchange monitoring information. |
ROLE_REST |
Allow users interact with the whole ReST API of OpenNMS Horizon |
ROLE_RTC |
Exchange information with the OpenNMS Horizon Real-Time Console for availability calculations. |
ROLE_USER |
Default permissions of a new created user to interact with the Web User Interface which allow to escalate and acknowledge Alarms and Notifications. |
-
Login as a User with administrative permissions
-
Choose Configure OpenNMS from the user specific main navigation which is named as your login user name
-
Choose Configure Users, Groups and On-Call roles and select Configure Users
-
Modify an existing User by clicking the modify icon next to the User
-
Select the Role from Available Roles in the Security Roles section
-
Use Add and Remove to assign or remove the Security Role from the User
-
Click Finish to persist and apply the Changes
-
Logout and Login to apply the new Security Role settings
-
Create a file called
$OPENNMS_HOME/etc/security-roles.properties. -
Add a property called
roles, and for its value, a comma separated list of the custom roles, for example:
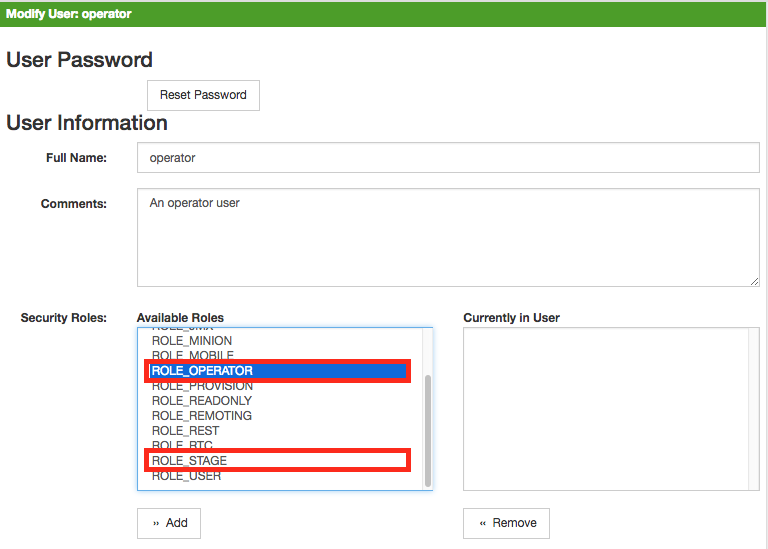
roles=operator,stage-
After following the procedure to associate the security roles with users, the new custom roles will be available as shown on the following image:
 :imagesdir: ../../images
3.3. Web UI Pre-Authentication
It is possible to configure OpenNMS Horizon to run behind a proxy that provides authentication, and then pass the pre-authenticated user to the OpenNMS Horizon webapp using a header.
The pre-authentication configuration is defined in $OPENNMS_HOME/jetty-webapps/opennms/WEB-INF/spring-security.d/header-preauth.xml. This file is automatically included in the Spring Security context, but is not enabled by default.
| DO NOT configure OpenNMS Horizon in this manner unless you are certain the web UI is only accessible to the proxy and not to end-users. Otherwise, malicious attackers can craft queries that include the pre-authentication header and get full control of the web UI and ReST APIs. |
3.3.1. Enabling Pre-Authentication
Edit the header-preauth.xml file, and set the enabled property:
<beans:property name="enabled" value="true" />3.3.2. Configuring Pre-Authentication
There are a number of other properties that can be set to change the behavior of the pre-authentication plugin.
| Property | Description | Default |
|---|---|---|
|
Whether the pre-authentication plugin is active. |
|
|
If true, disallow login if the header is not set or the user does not exist. If false, fall through to other mechanisms (basic auth, form login, etc.) |
|
|
The HTTP header that will specify the user to authenticate as. |
|
|
A comma-separated list of additional credentials (roles) the user should have. |
4. Administrative Webinterface
4.1. Surveillance View
When networks are larger and contain devices of different priority, it becomes interesting to show at a glance how the "whole system" is working. The surveillance view aims to do that. By using categories, you can define a matrix which allows to aggregate monitoring results. Imagine you have 10 servers with 10 internet connections and some 5 PCs with DSL lines:
| Servers | Internet Connections | |
|---|---|---|
Super important |
1 of 10 |
0 of 10 |
Slightly important |
0 of 10 |
0 of 10 |
Vanity |
4 of 10 |
0 of 10 |
The whole idea is to give somebody at a glance a hint on where the trouble is. The matrix-type of display allows a significantly higher aggregation than the simple list. In addition, the surveillance view shows nodes rather than services - an important tidbit of information when you look at categories. At a glance, you want to know how many of my servers have an issue rather than how many services in this category have an issue.
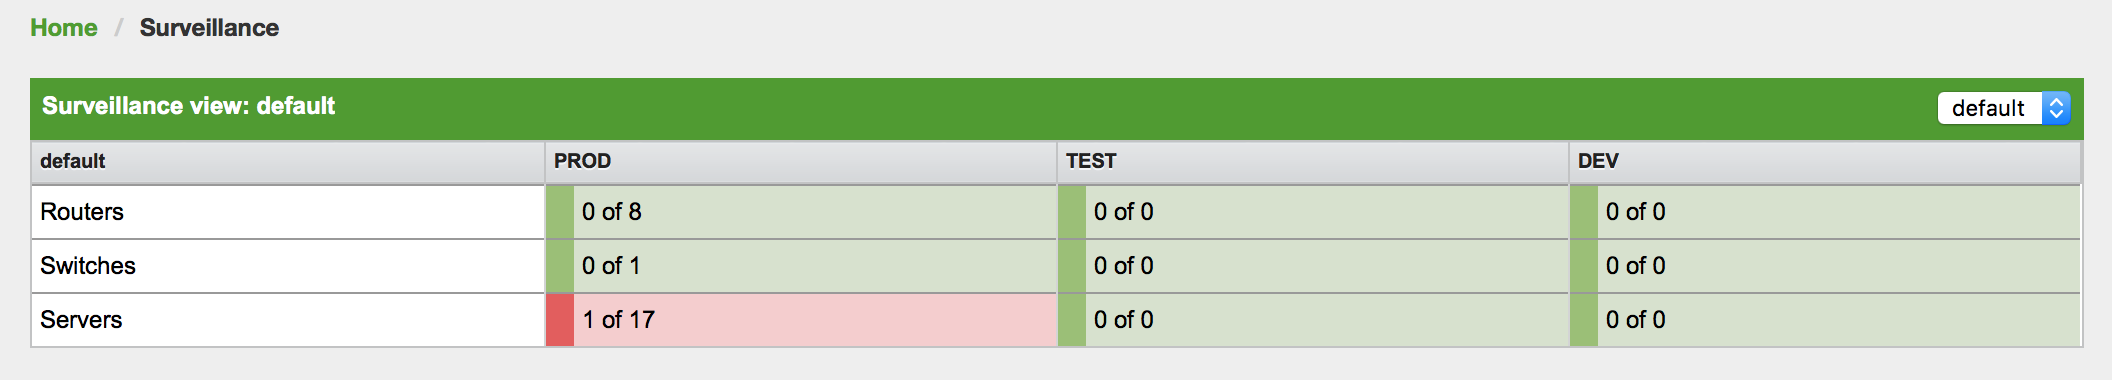
The visual indication for outages in the surveillance view cells is defined as the following:
-
No services down: green as normal
-
One (1) service down: yellow as warning
-
More than one (1) services down: red as critical
This Surveillance View model also builds the foundation of the Dashboard View.
4.1.1. Default Surveillance View Configuration
Surveillance Views are defined in the surveillance-views.xml file.
This file resides in the OpenNMS Horizon etc directory.
| This file can be modified in a text editor and is reread every time the Surveillance View page is loaded. Thus, changes to this file do not require OpenNMS Horizon to be restarted. |
The default configuration looks like this:
<?xml version="1.0" encoding="UTF-8"?>
<surveillance-view-configuration
  xmlns:this="http://www.opennms.org/xsd/config/surveillance-views"
  xmlns:xsi="http://www.w3.org/2001/XMLSchema-instance"
  xsi:schemaLocation="http://www.opennms.org/xsd/config/surveillance-views http://www.opennms.org/xsd/config/surveillance-views.xsd"
  default-view="default" >
  <views >
    <view name="default" refresh-seconds="300" >
      <rows>
        <row-def label="Routers" >
          <category name="Routers"/>
        </row-def>
        <row-def label="Switches" >
          <category name="Switches" />
        </row-def>
        <row-def label="Servers" >
          <category name="Servers" />
        </row-def>
      </rows>
      <columns>
        <column-def label="PROD" >
          <category name="Production" />
        </column-def>
        <column-def label="TEST" >
          <category name="Test" />
        </column-def>
        <column-def label="DEV" >
          <category name="Development" />
        </column-def>
      </columns>
    </view>
  </views>
</surveillance-view-configuration>
Please note, that the old report-category attribute is deprecated and is no longer supported.
|
4.1.2. Configuring Surveillance Views
The Surveillance View configuration can also be modified using the Surveillance View Configurations editor on the OpenNMS Horizon Admin page.
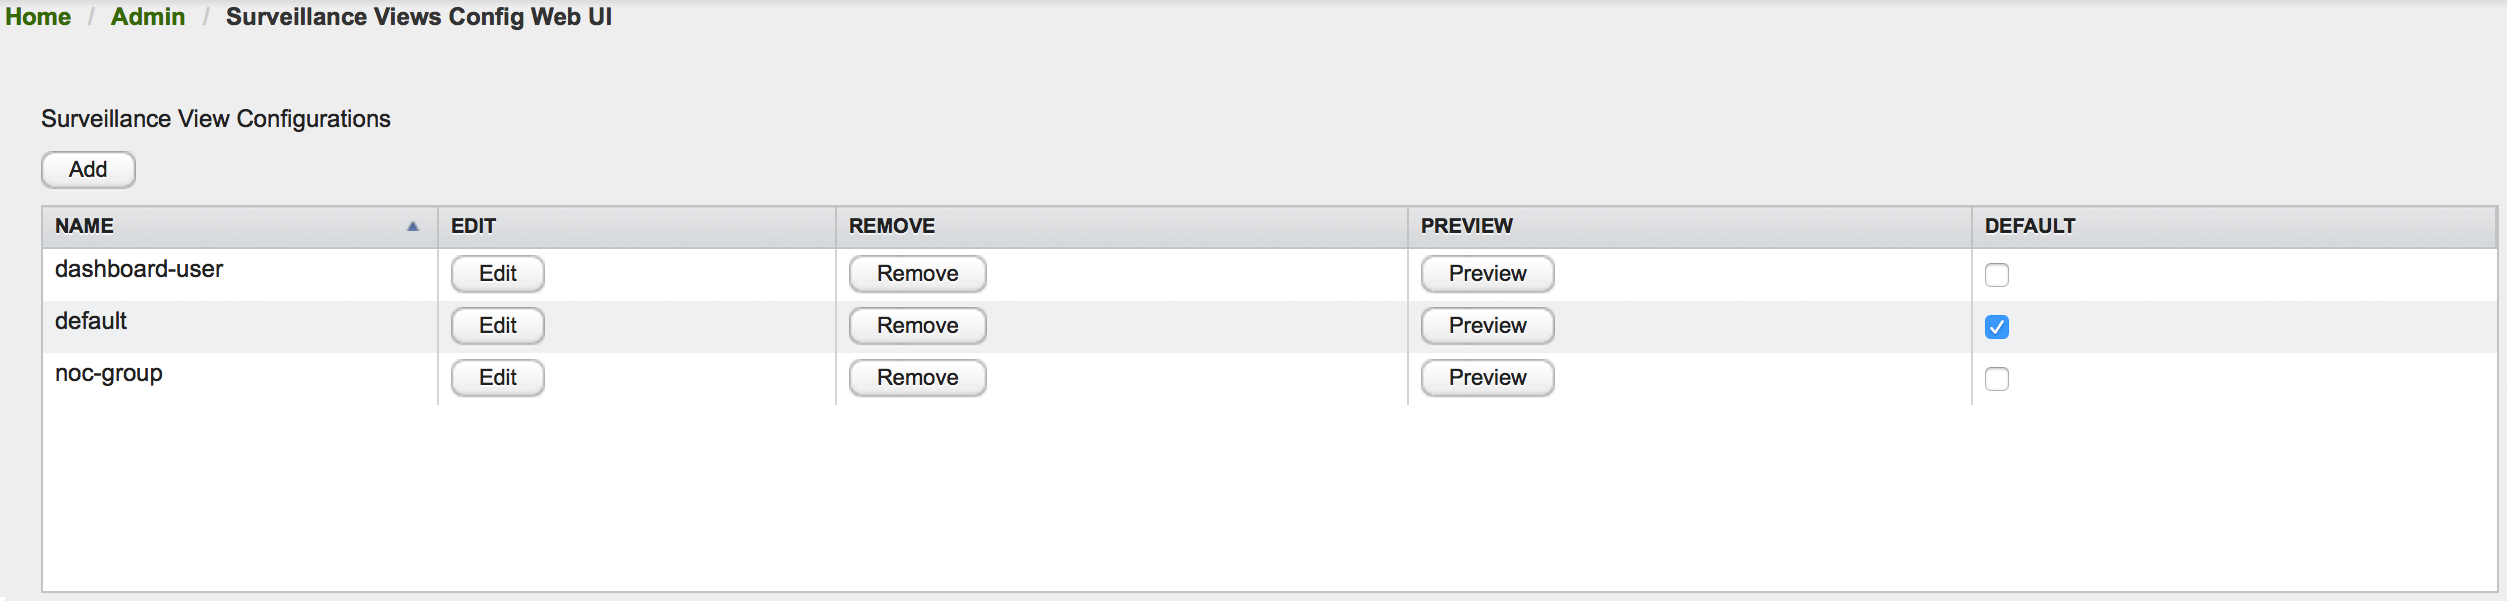
This page gives an overview of the configured Surveillance Views and allows the user to edit, remove or even preview the defined Surveillance View. Furthermore, the default Surveillance View can be selected using the checkbox in the DEFAULT column.
When editing a Surveillance View the user has to define the view’s title and the time in seconds between successive refreshes. On the left side of this dialog the defined rows, on the right side the defined columns are listed. Beside adding new entries an user can modify or delete existing entries. Furthermore, the position of an entry can be modified using the up/down buttons.
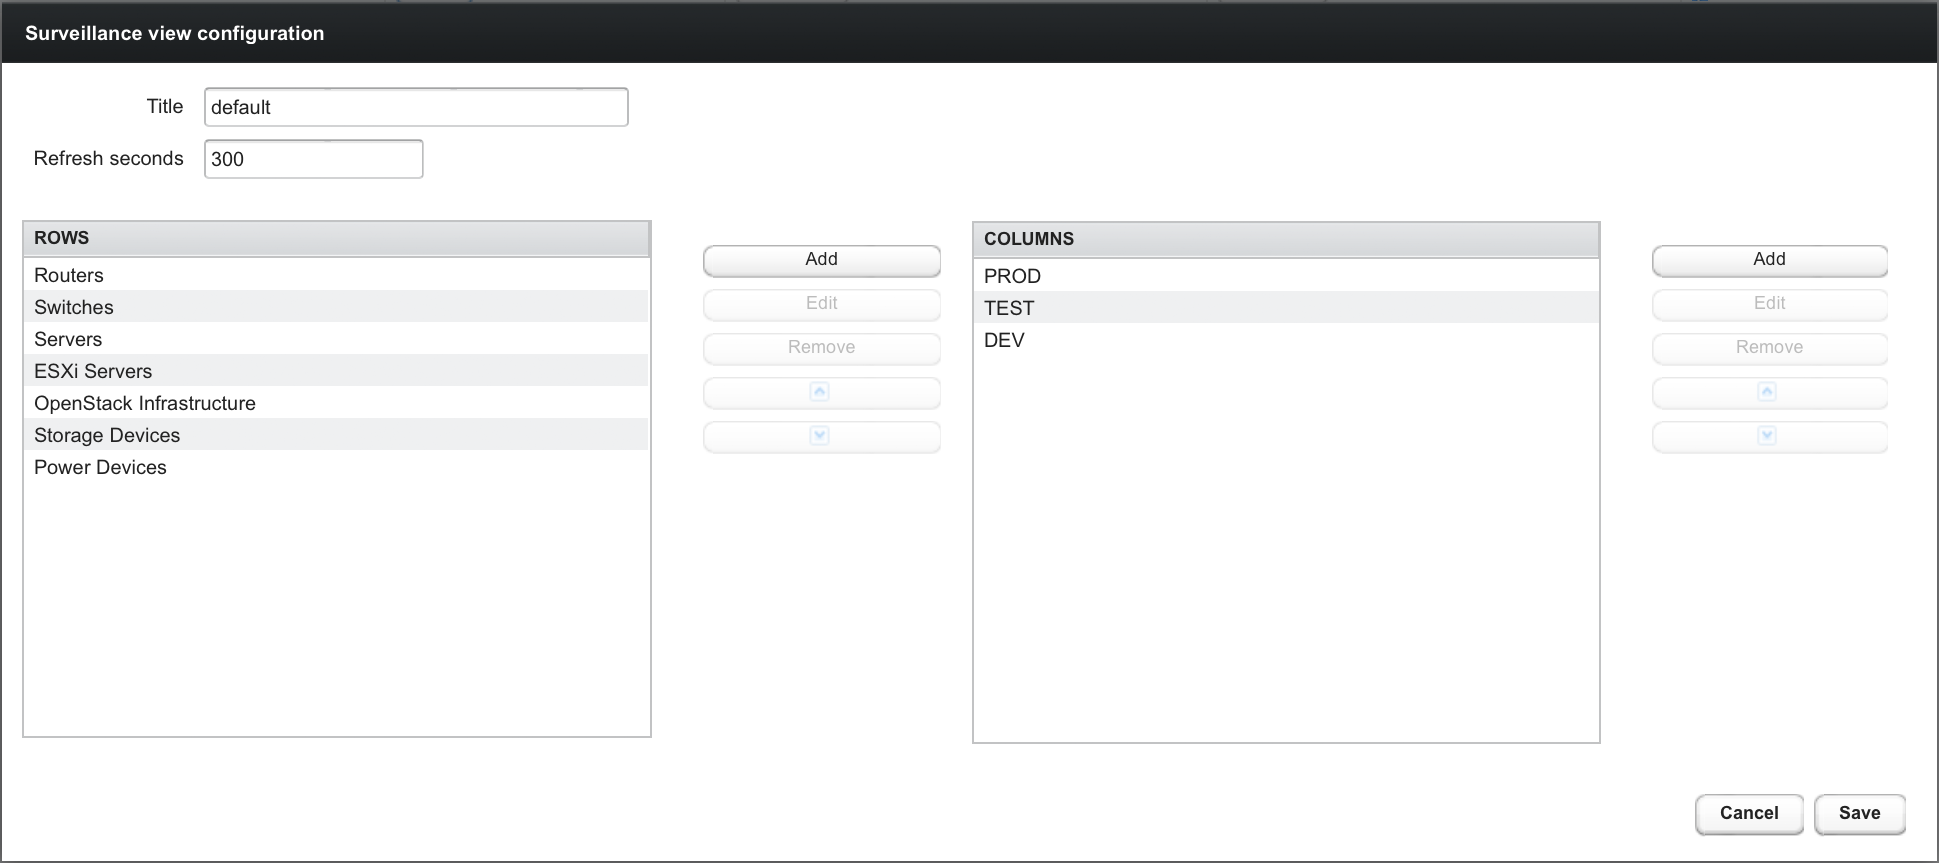
Editing row or column definitions require to choose an unique label for this entry and at least one OpenNMS Horizon category. When finished you can hit the Save button to persist your modified configuration or Cancel to close this dialog.
4.1.3. Categorizing Nodes
In order to categorize nodes in the Surveillance View, choose a node and click Edit beside Surveillance Category Memberships. Recalling from your Surveillance View, choose two categories that represent a column and a row, for example, Servers and Test, then click Add.
4.1.4. Creating Views for Users and Groups
You can use user and group names for Surveillance Views. When the Surveillance View page is invoked the following criteria selects the proper Surveillance View to be displayed. The first matching item wins:
-
Surveillance View name equal to the user name they used when logging into OpenNMS Horizon.
-
Surveillance View name equal to the user’s assigned OpenNMS Horizon group name
-
Surveillance View name equal to the
default-viewattribute in thesurveillance-views.xmlconfiguration file.
4.2. Dashboard
In Network Operation Centers NOC an overview about issues in the network is important and often described as Dashboards. Large networks have people (Operator) with different responsibilities and the Dashboard should show only information for a given monitoring context. Network or Server operator have a need to customize or filter information on the Dashboard. A Dashboard as an At-a-glance overview is also often used to give an entry point for more detailed diagnosis through the information provided by the monitoring system. The Surveillance View allows to reduce the visible information by selecting rows, columns and cells to quickly limit the amount of information to navigate through.
4.2.1. Components
The Dashboard is built with five components:
-
Surveillance View: Allows to model a monitoring context for the Dashboard.
-
Alarms: Shows unacknowledged Alarms which should be escalated by an Operator.
-
Notifications: Shows outstanding and unacknowledged notifications sent to Engineers.
-
Node Status: Shows all ongoing network Outages.
-
Resource Graph Viewer: Shows performance time series reports for performance diagnosis.
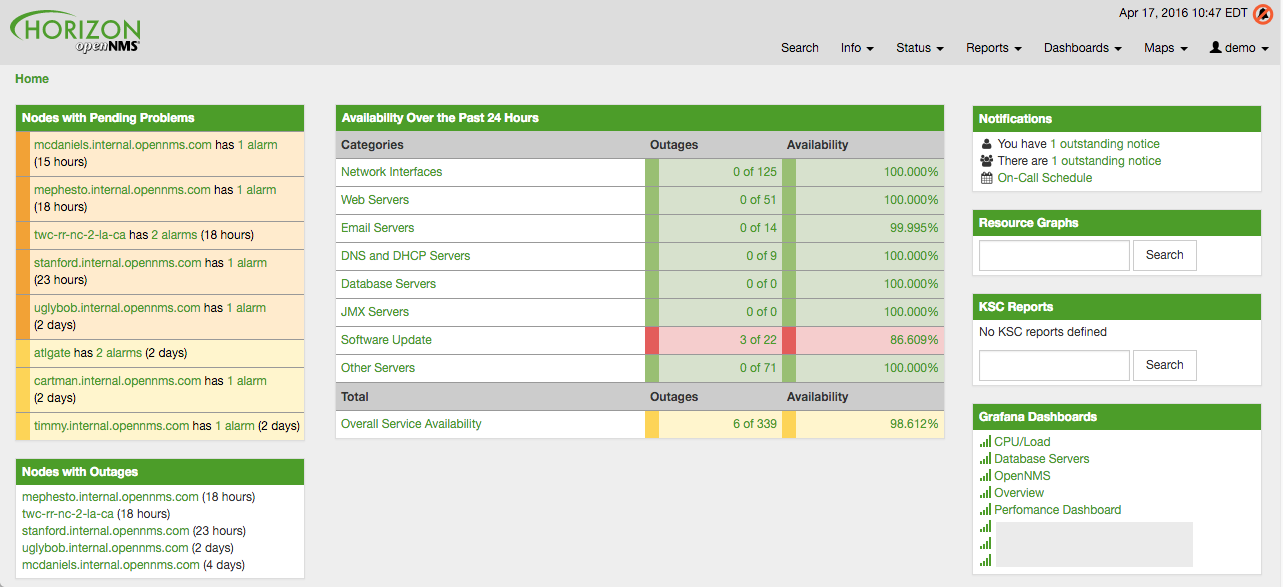
The following screenshot shows a configured Dashboard and which information are displayed in the components.
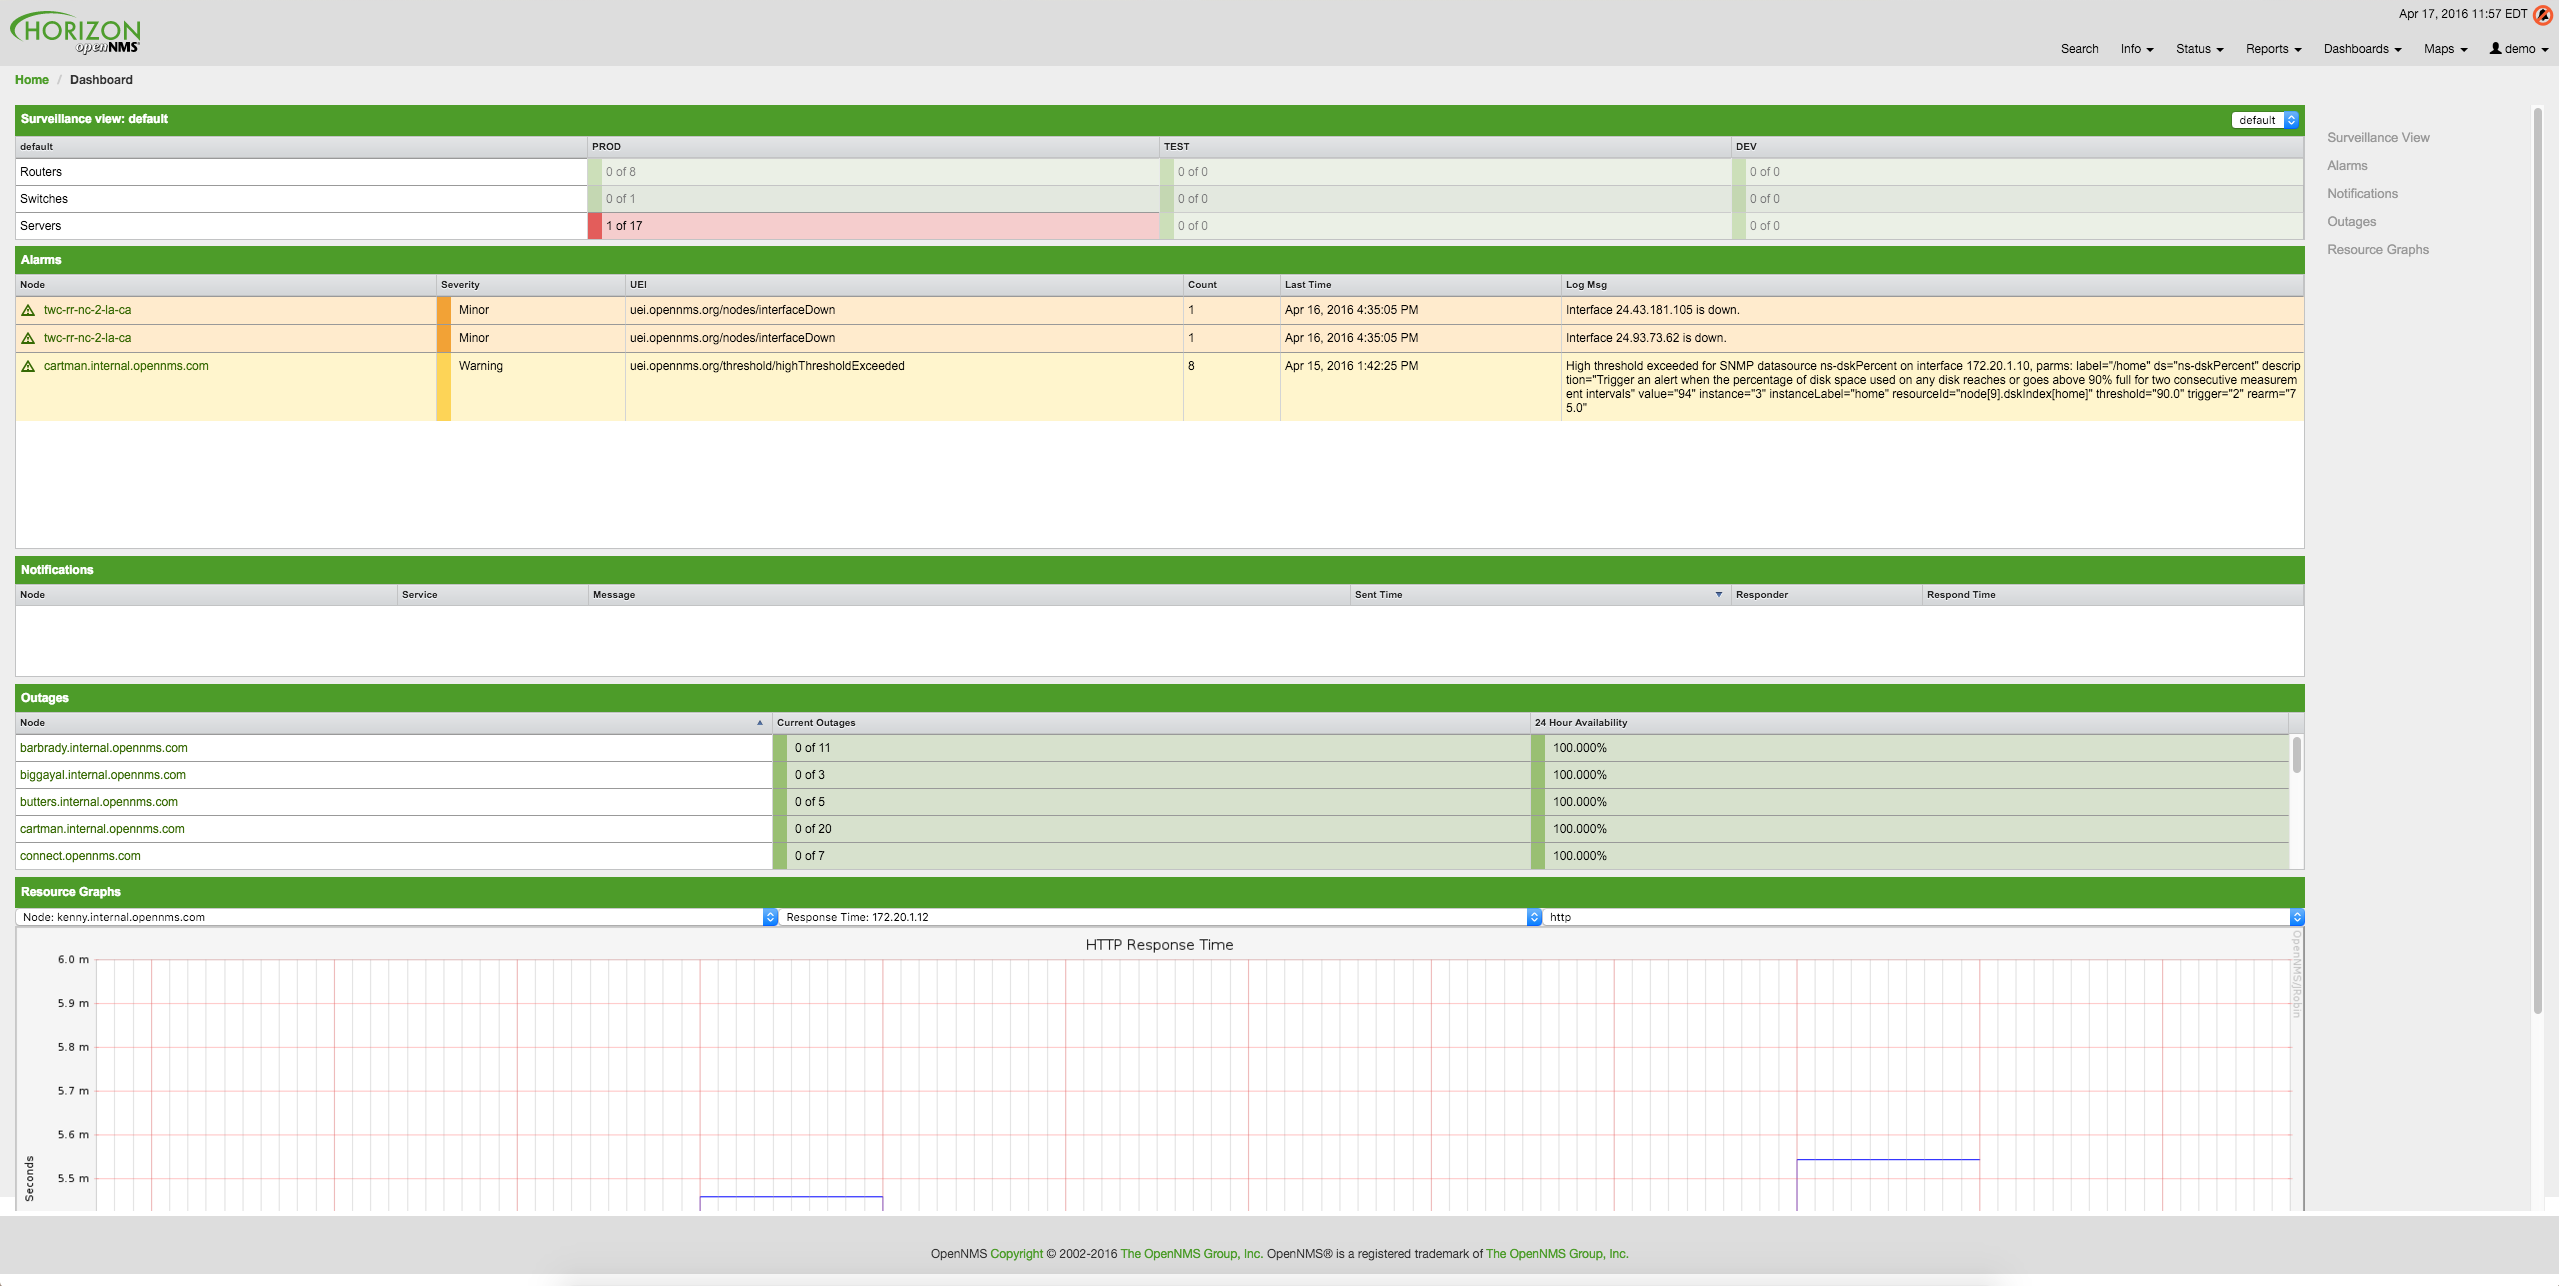
The following section describe the information shown in each component. All other components display information based on the Surveillance View.
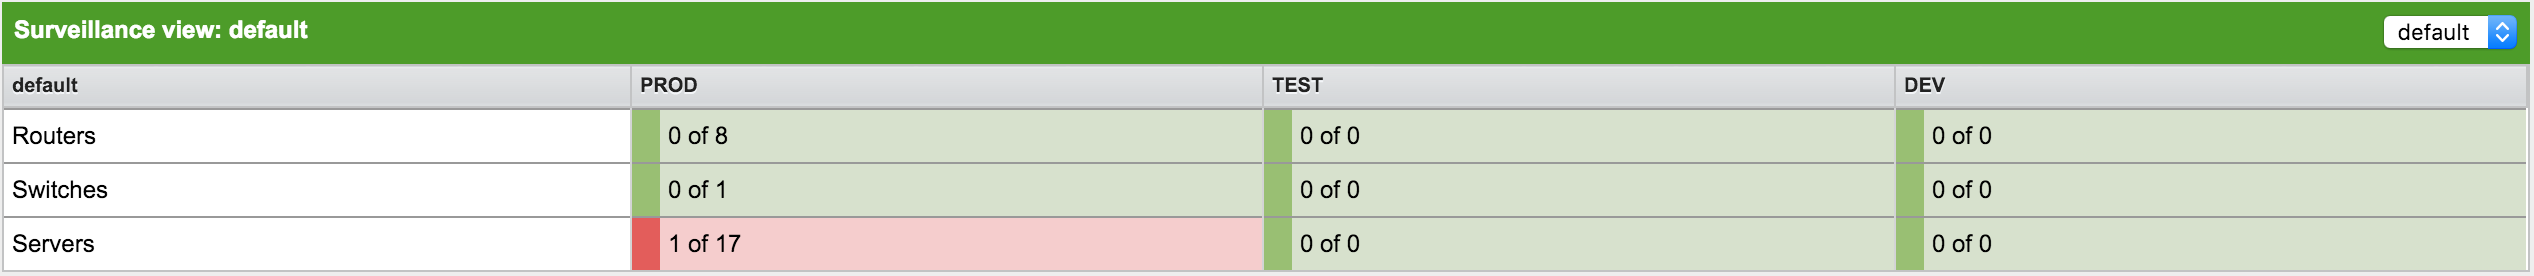
Surveillance View
The Surveillance View has multiple functions.
-
Allows to model the monitoring context and shows service and node Outages in compact matrix view.
-
Allows to limit the number of information in the Dashboard by selecting rows, columns and cells.
You can select columns, rows, single cells and of course all entries in a Surveillance View. Please refer to the Surveillance View Section for details on how to configure Surveillance Views.
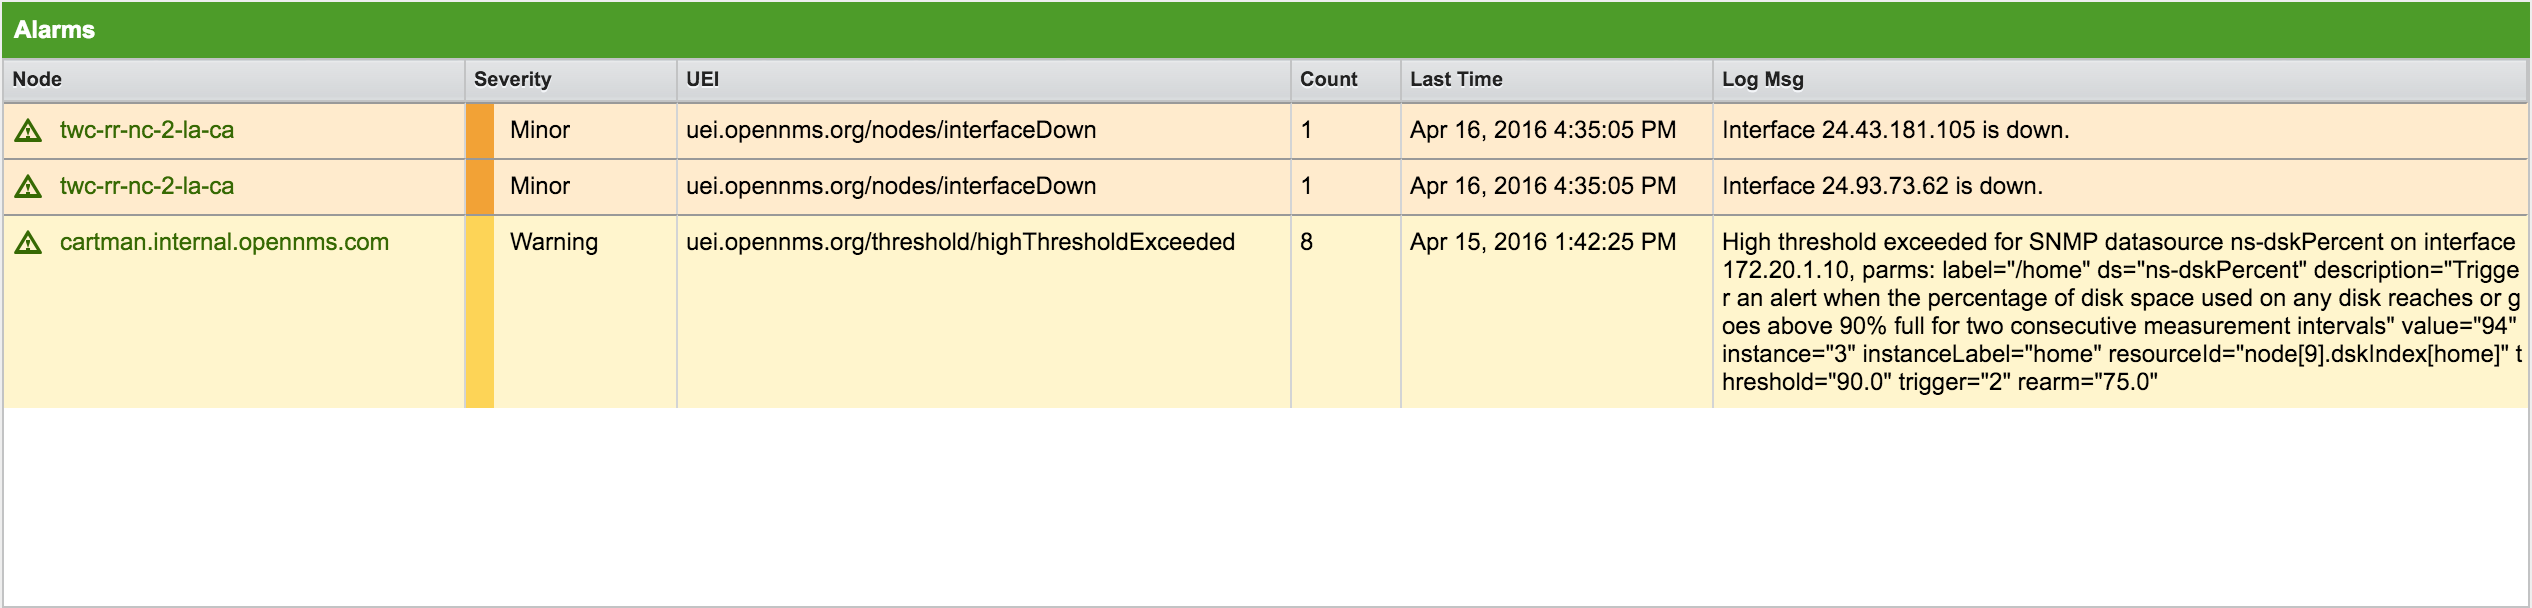
Alarms
The Alarms component gives an overview about all unacknowledged Alarms with a severity higher than Normal(1). Acknowledged Alarms will be removed from the responsibility of the Operator. The following information are shown in:
-
Node: Node label of the node the Alarm is associated
-
Severity: Severity of the Alarm
-
UEI: Shows the UEI of the Alarm
-
Count: Number of Alarms deduplicated by the reduction key of the Alarm
-
Last Time: Time for the last occurrence of the Alarm
-
Log Msg: The log message from the Event which is the source for this Alarm. It is specified in the event configuration file in
<logmsg />
The Alarms component shows the most recent Alarms and allows the user to scroll through the last 100 Alarms.
Notifications
To inform people on a duty schedule notifications are used and force action to fix or reconfigure systems immediately. In OpenNMS Horizon it is possible to acknowledge notifications to see who is working on a specific issue. The Dashboard should show outstanding notifications in the NOC to provide an overview and give the possibility for intervention.
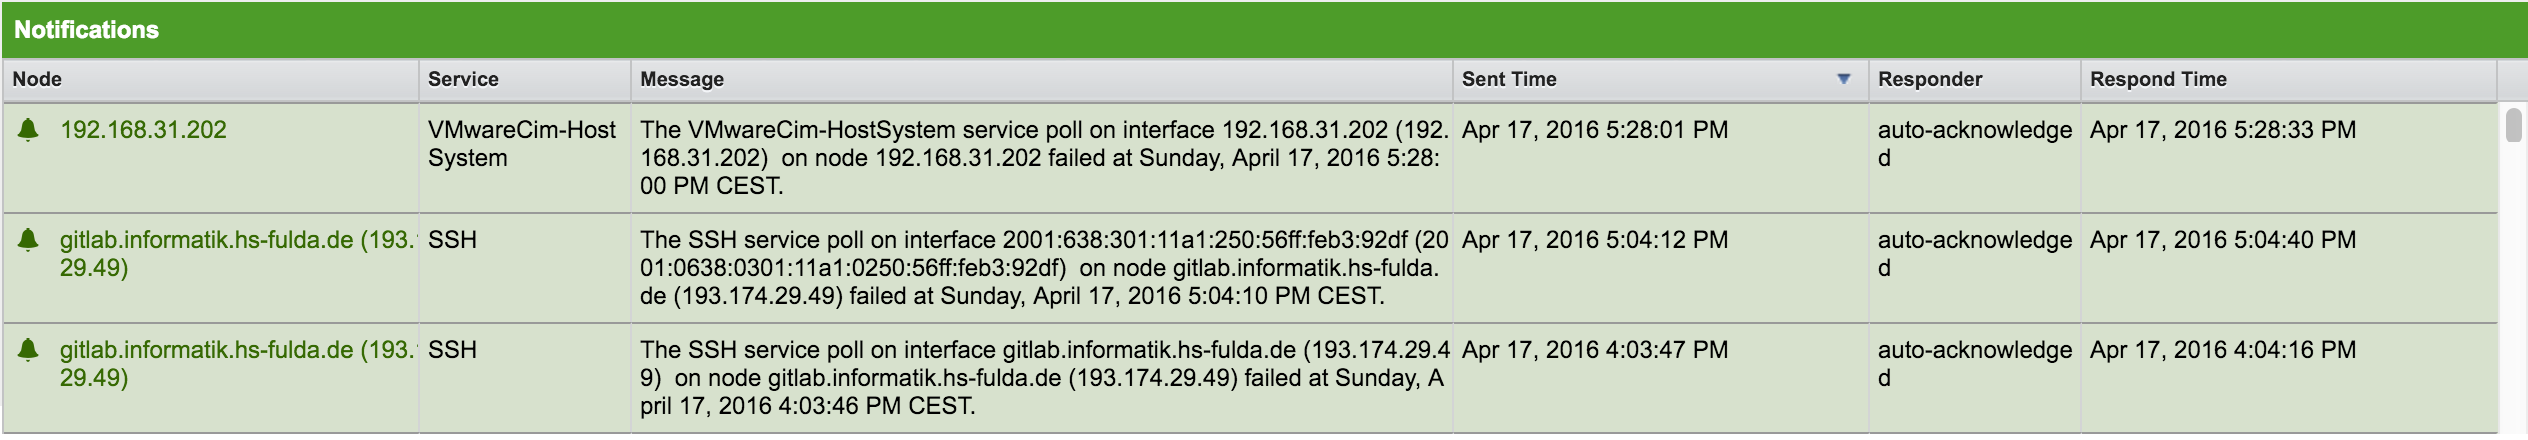
-
Node: Label of the monitored node the notification is associated with
-
Service: Name of the service the notification is associated with
-
Message: Message of the notification
-
Sent Time: Time when the notification was sent
-
Responder: User name who acknowledged the notification
-
Response Time: Time when the user acknowledged the notification
The Notifications component shows the most recent unacknowledged notifications and allows the user to scroll through the last 100 Notifications.
Node Status
An acknowledged Alarm doesn’t mean necessarily the outage is solved. To give an overview information about ongoing Outages in the network, the Dashboard shows an outage list in the Node Status component.
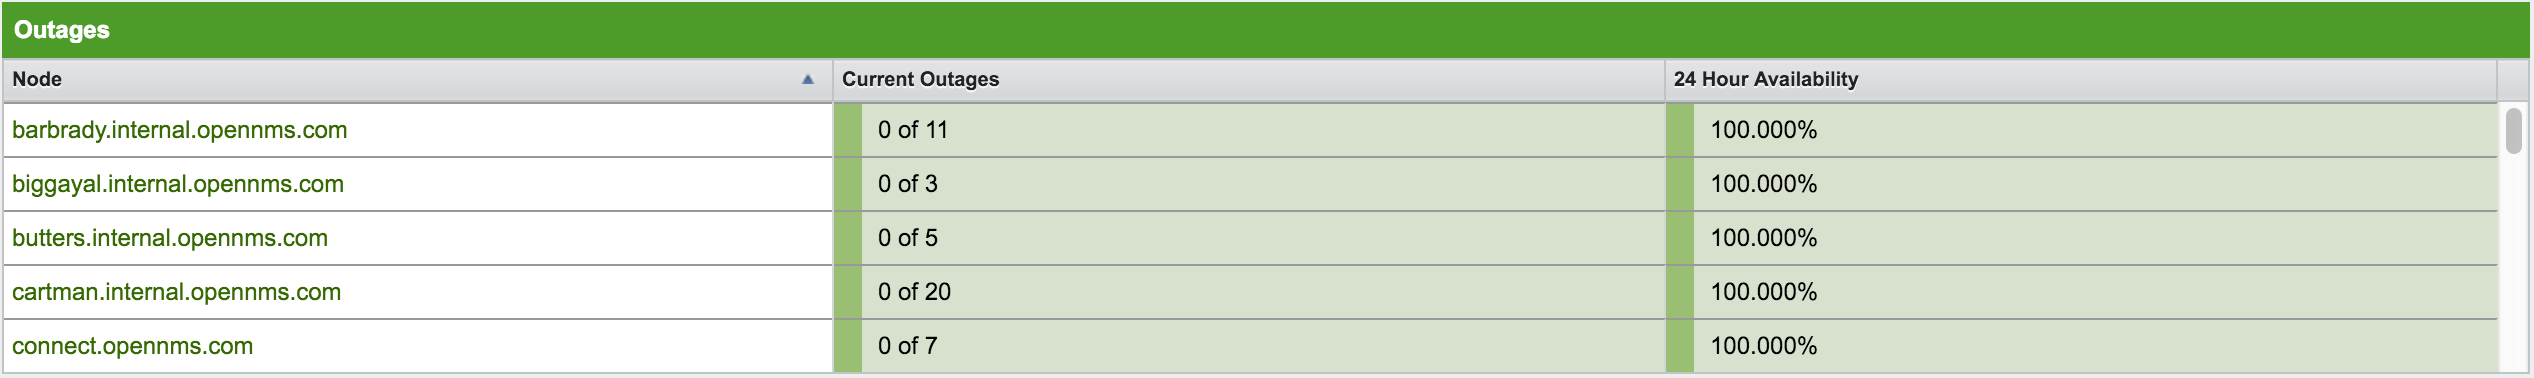
-
Node: Label of the monitored node with ongoing outages.
-
Current Outages: Number of services on the node with outages and total number of monitored services, e.g. with the natural meaning of "3 of 3 services are affected".
-
24 Hour Availability: Availability of all services provided by the node calculated by the last 24 hours.
Resource Graph Viewer
To give a quick entry point diagnose performance issues a Resource Graph Viewer allows to navigate to time series data reports which are filtered in the context of the Surveillance View.
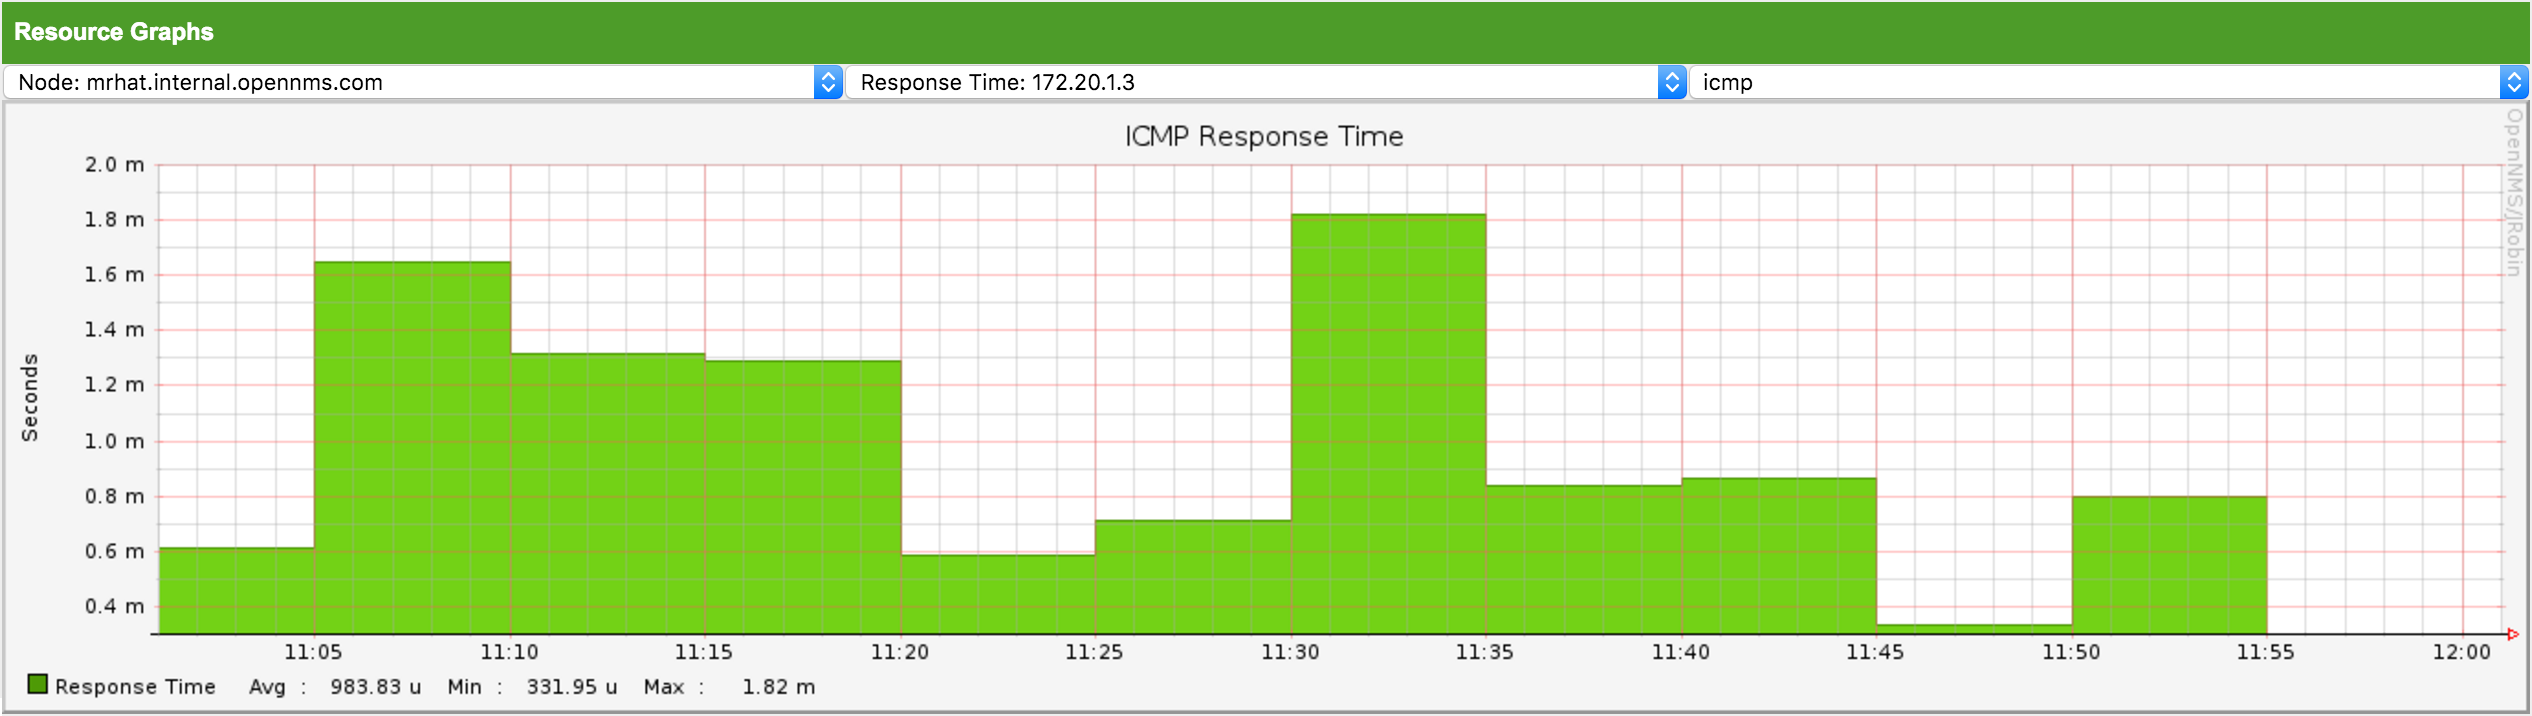
It allows to navigate sequentially through resource graphs provided by nodes filtered by the Surveillance View context and selection and shows one graph report at a time.
4.2.2. Advanced configuration
The Surveillance View component allows to model multiple views for different monitoring contexts. It gives the possibility to create special view as example for network operators or server operators. The Dashboard shows only one configured Surveillance View. To give different users the possibility using their Surveillance View fitting there requirements it is possible to map a logged in user to a given Surveillance View used in the Dashboard.
The selected nodes from the Surveillance View are also aware of User Restriction Filter. If you have a group of users, which should see just a subset of nodes the Surveillance View will filter nodes which are not related to the assigned user group.
The Dashboard is designed to focus, and therefore also restrict, a user’s view to devices of their interest. To do this, a new role was added that can be assigned to a user that restricts them to viewing only the Dashboard if that is intended.
Using the Dashboard role
The following example illustrates how this Dashboard role can be used.
For instance the user drv4doe is assigned the dashboard role.
So, when logging in as drv4doe, the user is taking directly to the Dashboard page and is presented with a custom Dashboard based on the drv4doe Surveillance View definition.
Step 1: Create an user
The following example assigns a Dashboard to the user "drv4doe" (a router and switch jockey) and restricts the user for navigation to any other link in the OpenNMS Horizon WebUI.
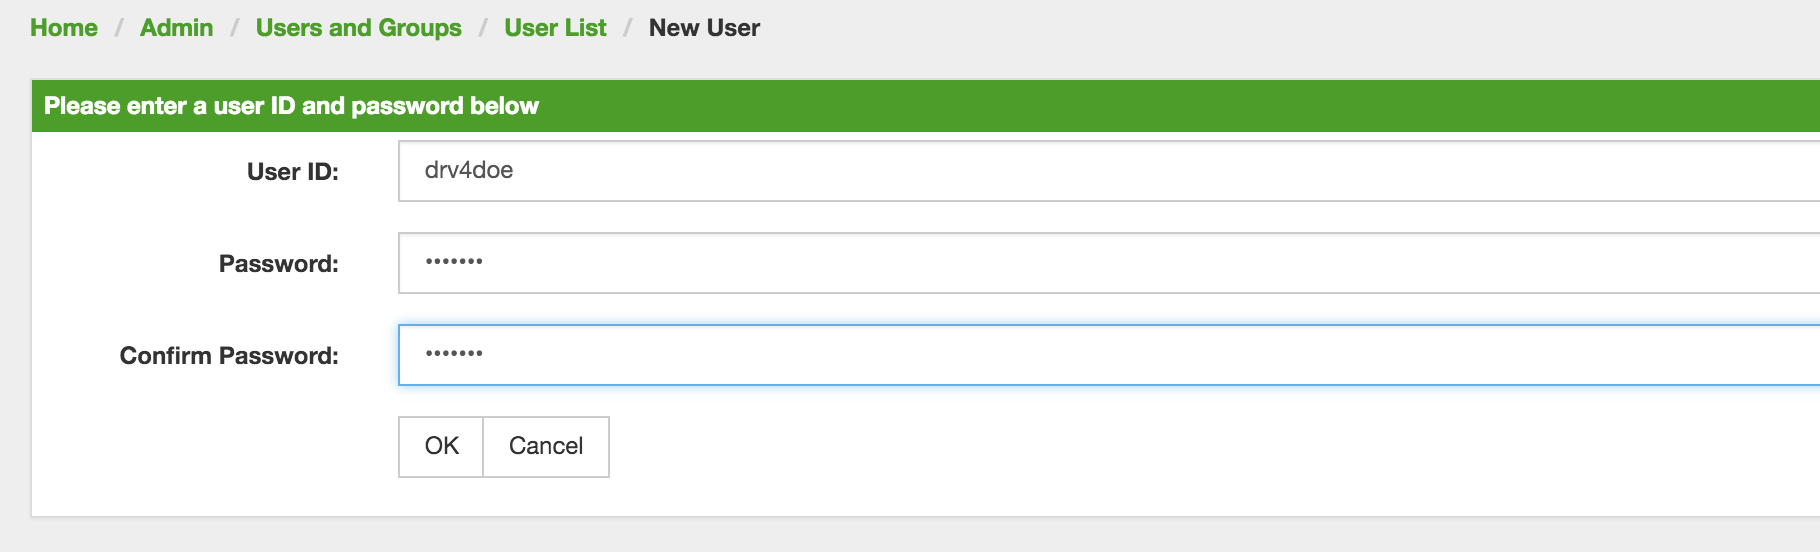
drv4doe using the OpenNMS Horizon WebUIStep 2: Change Security Roles
Now, add the ROLE_PROVISION role to the user through the WebUI or by manually editing the users.xml file in the /opt/opennms/etc directory for the user drv4doe.
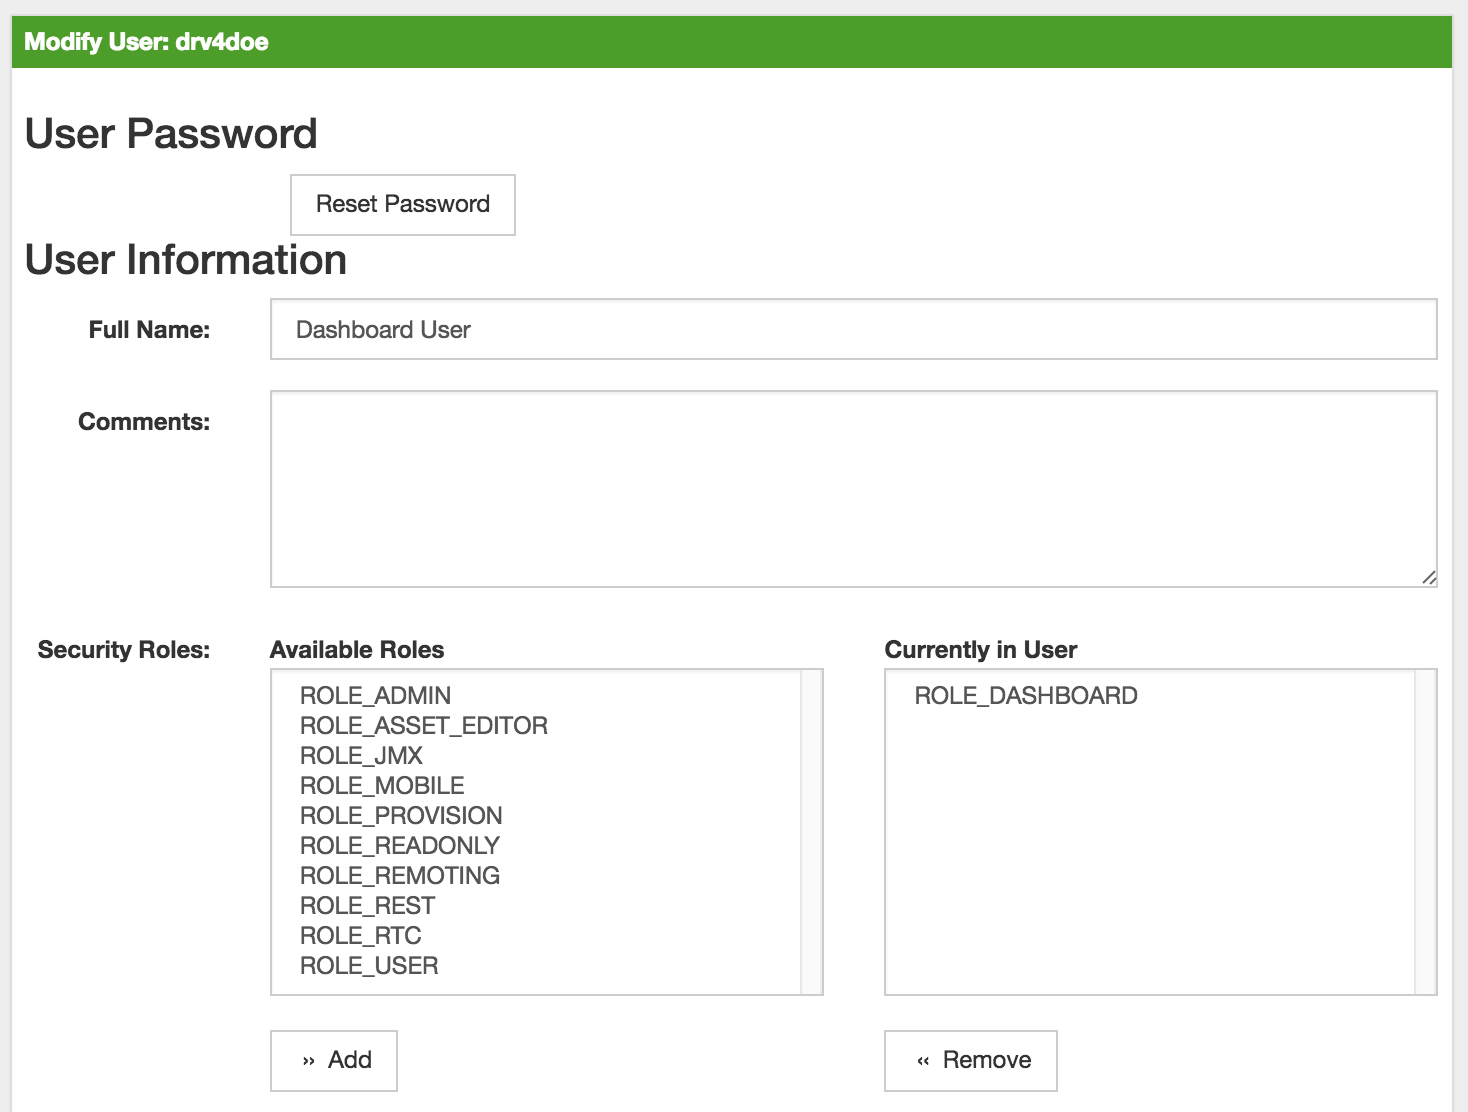
drv4doe using the OpenNMS Horizon WebUI<user>
<user-id>drv4doe</user-id>
<full-name>Dashboard User</full-name>
<password salt="true">6FOip6hgZsUwDhdzdPUVV5UhkSxdbZTlq8M5LXWG5586eDPa7BFizirjXEfV/srK</password>
<role>ROLE_DASHBOARD</role>
</user>Step 3: Define Surveillance View
Edit the $OPENNMS_HOME/etc/surveilliance-view.xml file to add a definition for the user drv4doe, which you created in step 1.
<?xml version="1.0" encoding="UTF-8"?>
<surveillance-view-configuration
  xmlns:this="http://www.opennms.org/xsd/config/surveillance-views"
  xmlns:xsi="http://www.w3.org/2001/XMLSchema-instance"
  xsi:schemaLocation="http://www.opennms.org/xsd/config/surveillance-views http://www.opennms.org/xsd/config/surveillance-views.xsd"
  default-view="default" >
  <views >
    <view name="drv4doe" refresh-seconds="300" >
      <rows>
        <row-def label="Servers" >
          <category name="Servers"/>
        </row-def>
      </rows>
      <columns>
        <column-def label="PROD" >
          <category name="Production" />
        </column-def>
        <column-def label="TEST" >
          <category name="Test" />
        </column-def>
      </columns>
    </view>
   <!-- default view here -->
    <view name="default" refresh-seconds="300" >
      <rows>
        <row-def label="Routers" >
          <category name="Routers"/>
        </row-def>
        <row-def label="Switches" >
          <category name="Switches" />
        </row-def>
        <row-def label="Servers" >
          <category name="Servers" />
        </row-def>
      </rows>
      <columns>
        <column-def label="PROD" >
          <category name="Production" />
        </column-def>
        <column-def label="TEST" >
          <category name="Test" />
        </column-def>
        <column-def label="DEV" >
          <category name="Development" />
        </column-def>
      </columns>
    </view>
  </views>
</surveillance-view-configuration>
This configuration and proper assignment of node categories will produce a default Dashboard for all users, other than drv4doe.
You can hide the upper navigation on any page by specifying ?quiet=true; adding it to the end of the OpenNMS Horizon URL.
This is very handy when using the dashboard on a large monitor or tv screen for office wide viewing.
|
However, when logging in as drv4doe, the user is taking directly to the Dashboard page and is presented with a Dashboard based on the custom Surveillance View definition.
The drv4doe user is not allowed to navigate to URLs other than the dashboard.jsp URL.
Doing so will result in an Access Denied error.
|
Anonymous dashboards
You can modify the configuration files for the security framework to give you access to one or more dashboards without logging in.
At the end you’ll be able to point a browser at a special URL like http://…/opennms/dashboard1 or http://…/opennms/dashboard2 and see a dashboard without any authentication.
First, configure surveillance views and create dashboard users as above.
For example, make two dashboards and two users called dashboard1 and dashboard2.
Test that you can log in as each of the new users and see the correct dashboard.
Now create some aliases you can use to distinguish between dashboards.
In /opt/opennms/jetty-webapps/opennms/WEB-INF, edit web.xml.
Just before the first <servlet-mapping> tag, add the following servlet entries:
  <servlet>
       <servlet-name>dashboard1</servlet-name>
       <jsp-file>/dashboard.jsp</jsp-file>
  </servlet>

  <servlet>
       <servlet-name>dashboard2</servlet-name>
       <jsp-file>/dashboard.jsp</jsp-file>
  </servlet>
Just before the first <error-page> tag, add the following servlet-mapping entries:
  <servlet-mapping>
       <servlet-name>dashboard1</servlet-name>
       <url-pattern>/dashboard1</url-pattern>
  </servlet-mapping>

  <servlet-mapping>
       <servlet-name>dashboard2</servlet-name>
       <url-pattern>/dashboard2</url-pattern>
  </servlet-mapping>
After the last <filter-mapping> tag, add the following filter-mapping entries:
  <filter-mapping>
    <filter-name>AddRefreshHeader-120</filter-name>
    <url-pattern>/dashboard.jsp</url-pattern>
  </filter-mapping>
  <filter-mapping>
    <filter-name>AddRefreshHeader-120</filter-name>
    <url-pattern>/dashboard1</url-pattern>
  </filter-mapping>
  <filter-mapping>
    <filter-name>AddRefreshHeader-120</filter-name>
    <url-pattern>/dashboard2</url-pattern>
  </filter-mapping>
Next edit applicationContext-acegi-security.xml to enable anonymous authentication for the /dashboard1 and /dashboard2 aliases.
Near the top of the file, find <bean id="filterChainProxy" …>.
Below the entry for /rss.jsp*, add an entry for each of the dashboard aliases:
  <bean id="filterChainProxy" class="org.acegisecurity.util.FilterChainProxy">
    <property name="filterInvocationDefinitionSource">
      <value>
        CONVERT_URL_TO_LOWERCASE_BEFORE_COMPARISON
        PATTERN_TYPE_APACHE_ANT
        /rss.jsp*=httpSessionContextIntegrationFilter,logoutFilter,authenticationProcessingFilter,basicProcessingFilter,securityContextHolderAwareRequestFilter,anonymousProcessingFilter,basicExceptionTranslationFilter,filterInvocationInterceptor
        /dashboard1*=httpSessionContextIntegrationFilter,logoutFilter,securityContextHolderAwareRequestFilter,dash1AnonymousProcessingFilter,filterInvocationInterceptor
        /dashboard2*=httpSessionContextIntegrationFilter,logoutFilter,securityContextHolderAwareRequestFilter,dash2AnonymousProcessingFilter,filterInvocationInterceptor
        /**=httpSessionContextIntegrationFilter,logoutFilter,authenticationProcessingFilter,basicProcessingFilter,securityContextHolderAwareRequestFilter,anonymousProcessingFilter,exceptionTranslationFilter,filterInvocationInterceptor

...
About halfway through the file, look for <bean id="filterInvocationInterceptor" …>.
Below the entry for /dashboard.jsp, add an entry for each of the aliases:
  <bean id="filterInvocationInterceptor" class="org.acegisecurity.intercept.web.FilterSecurityInterceptor">

...

        /frontpage.htm=ROLE_USER,ROLE_DASHBOARD
        /dashboard.jsp=ROLE_USER,ROLE_DASHBOARD
        /dashboard1=ROLE_USER,ROLE_DASHBOARD
        /dashboard2=ROLE_USER,ROLE_DASHBOARD
        /gwt.js=ROLE_USER,ROLE_DASHBOARD

...
Finally, near the bottom of the page, add a new instance of AnonymousProcessingFilter for each alias.
  <!-- Set the anonymous username to dashboard1 so the dashboard page
       can match it to a surveillance view of the same name. -->
  <bean id="dash1AnonymousProcessingFilter" class="org.acegisecurity.providers.anonymous.AnonymousProcessingFilter">
    <property name="key"><value>foobar</value></property>
    <property name="userAttribute"><value>dashboard1,ROLE_DASHBOARD</value></property>
  </bean>

  <bean id="dash2AnonymousProcessingFilter" class="org.acegisecurity.providers.anonymous.AnonymousProcessingFilter">
    <property name="key"><value>foobar</value></property>
    <property name="userAttribute"><value>dashboard2,ROLE_DASHBOARD</value></property>
  </bean>
Restart OpenNMS Horizon and you should bring up a dashboard at http://…/opennms/dashboard1 without logging in.
| There’s no way to switch dashboards without closing the browser (or deleting the JSESSIONID session cookie). |
If you accidentally click a link that requires full user privileges (e.g. Node List), you’ll be given a login form.
Once you get to the login form, there’s no going back to the dashboard without restarting the browser.
If this problem bothers you, you can set ROLE_USER in addition to ROLE_DASHBOARD in your userAttribute property.
However this will give full user access to anonymous browsers.
|
4.3. Grafana Dashboard Box
Grafana provides an API key which gives access for 3rd party application like OpenNMS Horizon. The Grafana Dashboard Box on the start page shows dashboards related to OpenNMS Horizon. To filter relevant dashboards, you can use a tag for dashboards and make them accessible. If no tag is provided all dashboards from Grafana will be shown.
The feature is by default deactivated and is configured through opennms.properties. Please note that this feature
works with the Grafana API v2.5.0.
| Name | Type | Description | Default |
|---|---|---|---|
|
Boolean |
This setting controls whether a grafana box showing the
available dashboards is placed on the landing page. The two
valid options for this are |
|
|
String |
If the box is enabled you also need to specify hostname of the Grafana server |
|
|
Integer |
The port of the Grafana server ReST API |
|
|
String |
The Grafana base path to be used |
|
|
String |
The API key is needed for the ReST calls to work |
|
|
String |
When a tag is specified only dashboards with this given tag will be displayed. When no tag is given all dashboards will be displayed |
|
|
String |
The protocol for the ReST call can also be specified |
|
|
Integer |
Timeout in milliseconds for getting information from the Grafana server |
|
|
Integer |
Socket timeout |
|
|
Integer |
Maximum number of entries to be displayed (0 for unlimited) |
|
If you have Grafana behind a proxy it is important the org.opennms.grafanaBox.hostname is reachable.
This host name is used to generate links to the Grafana dashboards.
|
The process to generate an Grafana API Key can be found in the HTTP API documentation.
Copy the API Key to opennms.properties as org.opennms.grafanaBox.apiKey.
4.4. Operator Board
In a network operation center (NOC) the Ops Board can be used to visualize monitoring information. The monitoring information for various use-cases are arranged in configurable Dashlets. To address different user groups it is possible to create multiple Ops Boards.
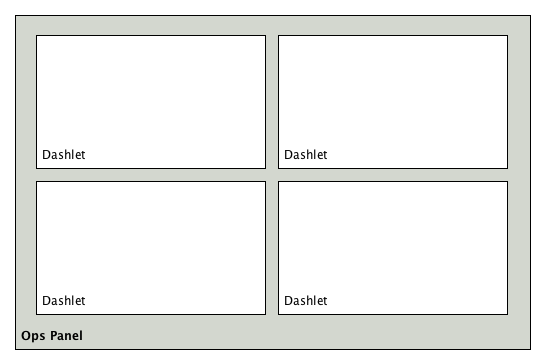
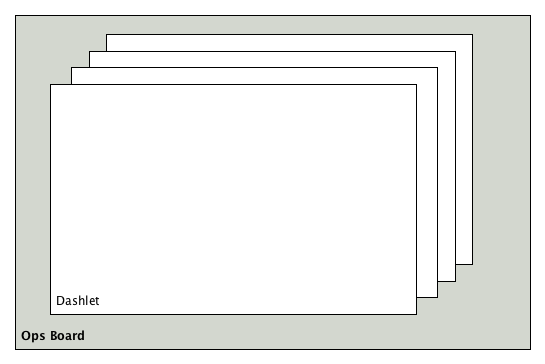
There are two visualisation components to display Dashlets:
-
Ops Panel: Shows multiple Dashlets on one screen, e.g. on a NOC operators workstation
-
Ops Board: Shows one Dashlet at a time in rotation, e.g. for a screen wall in a NOC
4.4.1. Configuration
To create and configure Ops Boards administration permissions are required. The configuration section is in admin area of OpenNMS Horizon and named Ops Board Config Web Ui.
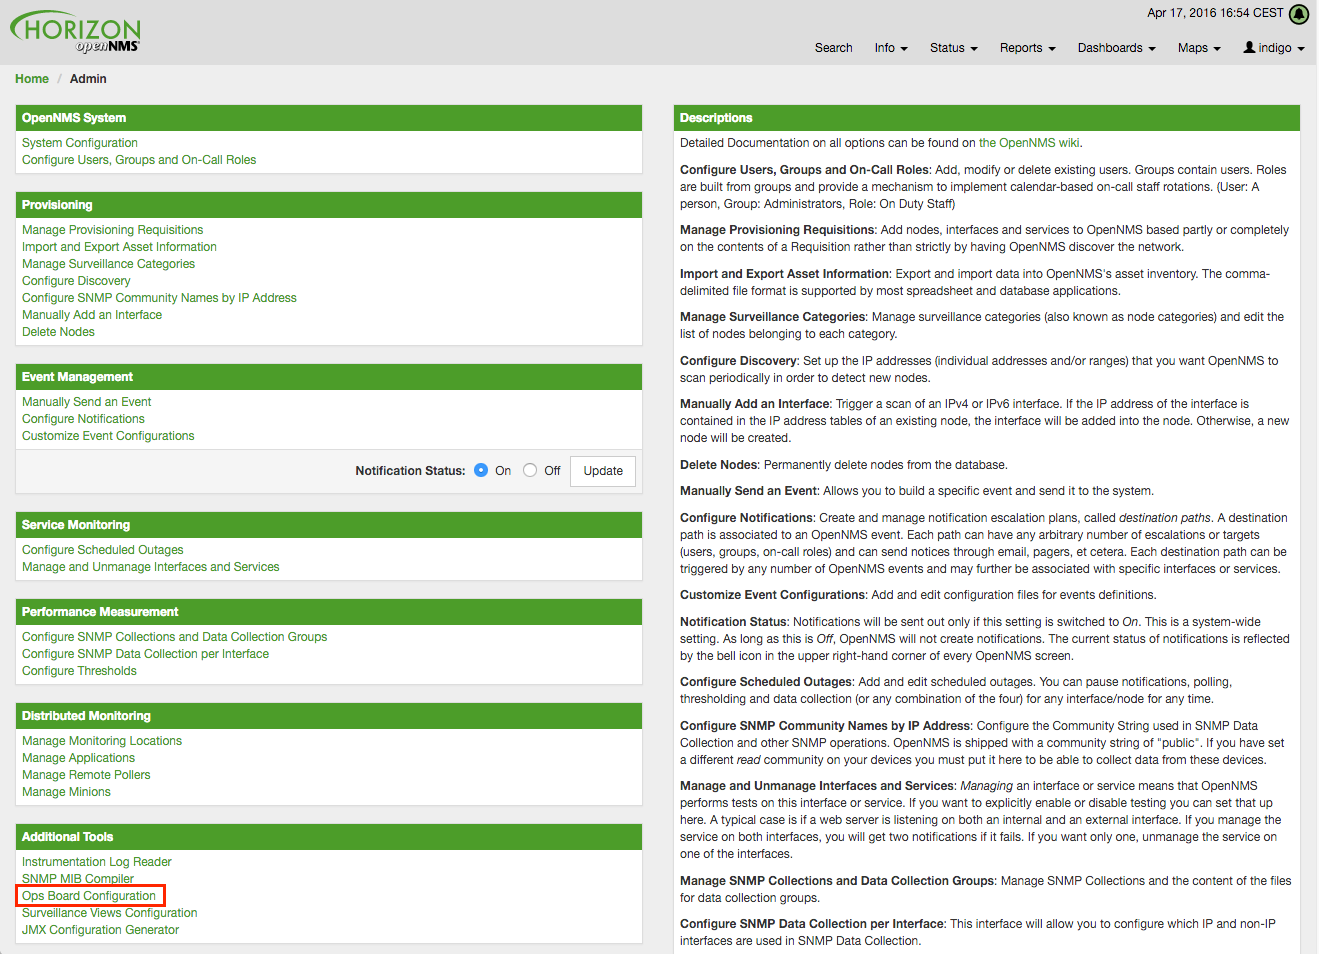
Create or modify Ops Boards is described in the following screenshot.
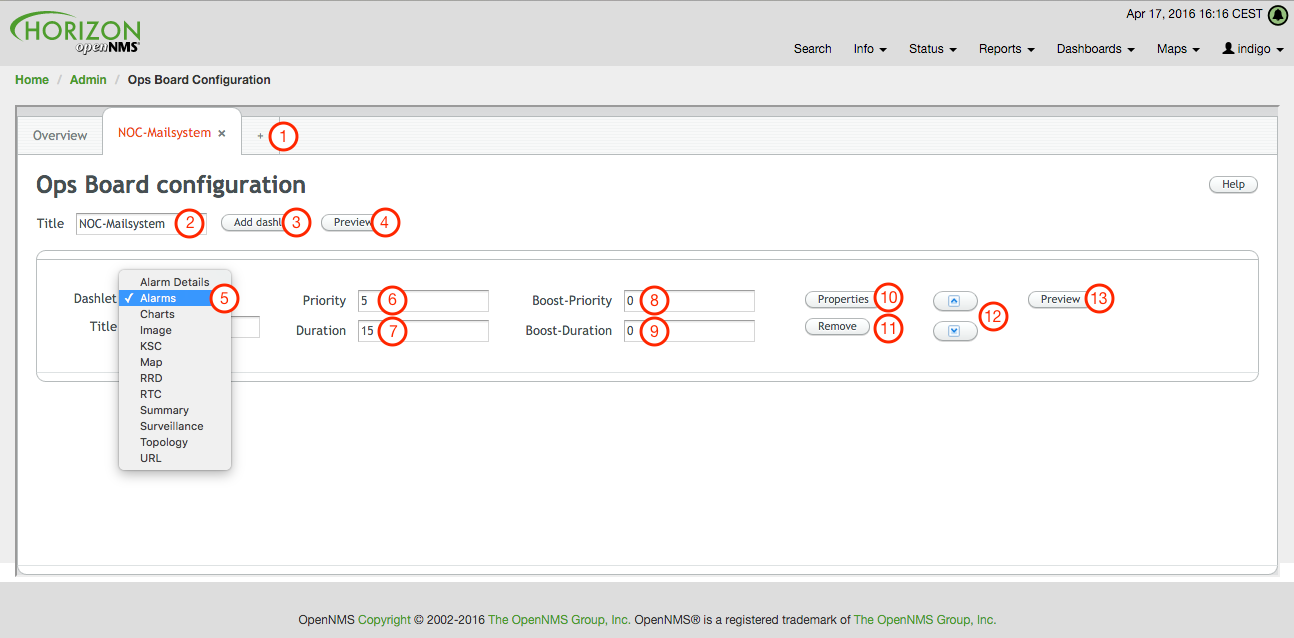
-
Create a new Ops Board to organize and arrange different Dashlets
-
The name to identify the Ops Board
-
Add a Dashlet to show OpenNMS Horizon monitoring information
-
Show a preview of the whole Ops Board
-
List of available Dashlets
-
Priority for this Dashlet in Ops Board rotation, lower priority means it will be displayed more often
-
Duration in seconds for this Dashlet in the Ops Board rotation
-
Change Priority if the Dashlet is in alert state, this is optional and maybe not available in all Dashlets
-
Change Duration if the Dashlet is in alert state, it is optional and maybe not available in all Dashlets
-
Configuration properties for this Dashlet
-
Remove this Dashlet from the Ops Board
-
Order Dashlets for the rotation on the Ops Board and the tile view in the Ops Panel
-
Show a preview for the whole Ops Board
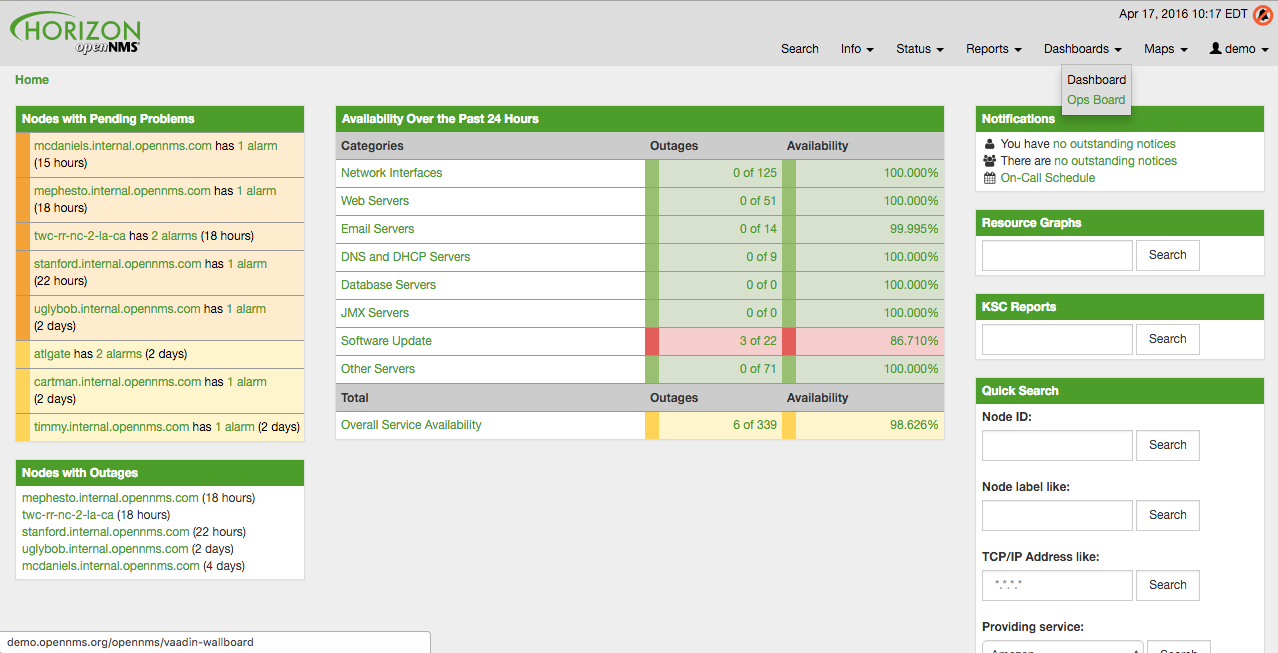
The configured Ops Board can be used by navigating in the main menu to Dashboard → Ops Board.
4.4.2. Dashlets
Visualization of information is implemented in Dashlets. The different Dashlets are described in this section with all available configuration parameter.
To allow filter information the Dashlet can be configured with a generic Criteria Builder.
Alarm Details
This Alarm-Details Dashlet shows a table with alarms and some detailed information.
| Field | Description |
|---|---|
Alarm ID |
OpenNMS Horizon ID for the alarm |
Severity |
Alarm severity (Cleared, Indeterminate, Normal, Warning, Minor, Major, Critical) |
Node label |
Node label of the node where the alarm occurred |
Alarm count |
Alarm count based on reduction key for deduplication |
Last Event Time |
Last time the alarm occurred |
Log Message |
Reason and detailed log message of the alarm |
The Alarm Details Dashlet can be configured with the following parameters.
Boost support |
|
Configuration |
Alarms
This Alarms Dashlet shows a table with a short alarm description.
| Field | Description |
|---|---|
Time |
Absolute time since the alarm appeared |
Node label |
Node label of the node where the alarm occurred |
UEI |
OpenNMS Horizon Unique Event Identifier for this alarm |
The Alarms Dashlet can be configured with the following parameters.
Boost support |
|
Configuration |
Charts
This Dashlet displays an existing Chart.
Boost support |
false |
|
Name of the existing chart to display |
|
Rescale the image to fill display width |
|
Rescale the image to fill display height |
Grafana
This Dashlet shows a Grafana Dashboard for a given time range.
The Grafana Dashboard Box configuration defined in the opennms.properties file is used to access the Grafana instance.
Boost support |
false |
|
Title of the Grafana dashboard to be displayed |
|
URI to the Grafana Dashboard to be displayed |
|
Start of time range |
|
End of time range |
Image
This Dashlet displays an image by a given URL.
Boost support |
false |
|
URL with the location of the image to show in this Dashlet |
|
Rescale the image to fill display width |
|
Rescale the image to fill display height |
KSC
This Dashlet shows an existing KSC report. The view is exact the same as the KSC report is build regarding order, columns and time spans.
Boost support |
false |
|
Name of the KSC report to show in this Dashlet |
Map
This Dashlet displays the geographical map.
Boost support |
false |
|
Predefined search for a subset of nodes shown in the geographical map in this Dashlet |
RRD
This Dashlet shows one or multiple RRD graphs. It is possible to arrange and order the RRD graphs in multiple columns and rows. All RRD graphs are normalized with a given width and height.
Boost support |
false |
|
Number of columns within the Dashlet |
|
Number of rows with the Dashlet |
|
Import RRD graphs from an existing KSC report and re-arrange them. |
|
Generic width for all RRD graphs in this Dashlet |
|
Generic height for all RRD graphs in this Dashlet |
|
Number of the given |
|
Minute, Hour, Day, Week, Month and Year for all RRD graphs |
RTC
This Dashlet shows the configured SLA categories from the OpenNMS Horizon start page.
Boost support |
false |
|
- |
Summary
This Dashlet shows a trend of incoming alarms in given time frame.
Boost support |
|
|
Time slot in seconds to evaluate the trend for alarms by severity and UEI. |
Surveillance
This Dashlet shows a given Surveillance View.
Boost support |
false |
|
Name of the configured Surveillance View |
Topology
This Dashlet shows a Topology Map. The Topology Map can be configured with the following parameter.
Boost support |
false |
|
Which node(s) is in focus for the topology |
|
Which topology should be displayed, e.g. Linkd, VMware |
|
Set the zoom level for the topology |
URL
This Dashlet shows the content of a web page or other web application, e.g. other monitoring systems by a given URL.
Boost support |
false |
|
Optional password if a basic authentication is required |
|
URL to the web application or web page |
|
Optional username if a basic authentication is required |
4.4.3. Boosting Dashlet
The behavior to boost a Dashlet describes the behavior of a Dashlet showing critical monitoring information. It can raise the priority in the Ops Board rotation to indicate a problem. This behavior can be configured with the configuration parameter Boost Priority and Boost Duration. These to configuration parameter effect the behavior on the Ops Board in rotation.
-
Boost Priority: Absolute priority of the Dashlet with critical monitoring information.
-
Boost Duration: Absolute duration in seconds of the Dashlet with critical monitoring information.
4.4.4. Criteria Builder
The Criteria Builder is a generic component to filter information of a Dashlet. Some Dashlets use this component to filter the shown information on a Dashlet for certain use case. It is possible to combine multiple Criteria to display just a subset of information in a given Dashlet.
| Restriction | Property | Value 1 | Value 2 | Description |
|---|---|---|---|---|
|
- |
- |
- |
ascending order |
|
- |
- |
- |
descending order |
|
database attribute |
String |
String |
Subset of data between value 1 and value 2 |
|
database attribute |
String |
- |
Select all data which contains a given text string in a given database attribute |
|
database attribute |
- |
- |
Select a single instance |
|
database attribute |
String |
- |
Select data where attribute equals ( |
|
database attribute |
String |
- |
Select data where attribute is greater equals than ( |
|
database attribute |
String |
- |
Select data where attribute is greater than ( |
|
database attribute |
String |
- |
unknown |
|
database attribute |
String |
- |
unknown |
|
database attribute |
String |
- |
Select data where attribute matches an given IPLIKE expression |
|
database attribute |
- |
- |
Select data where attribute is null |
|
database attribute |
- |
- |
Select data where attribute is not null |
|
database attribute |
- |
- |
Select data where attribute is not null |
|
database attribute |
String |
- |
Select data where attribute is less equals than ( |
|
database attribute |
String |
- |
Select data where attribute is less than ( |
|
database attribute |
String |
- |
Select data where attribute is less equals than ( |
|
database attribute |
String |
- |
Select data where attribute is like a given text value similar to SQL |
|
- |
Integer |
- |
Limit the result set by a given number |
|
database attribute |
String |
- |
Select data where attribute is not equals ( |
|
database attribute |
String |
- |
unknown difference between |
|
database attribute |
- |
- |
Order the result set by a given attribute |
| For date values, absolute value can be specified in ISO format, e.g. 2019-06-20T20:45:15.123-05:00. Relative times can be specified by +seconds and -seconds. |
4.5. JMX Configuration Generator
OpenNMS Horizon implements the JMX protocol to collect long term performance data for Java applications. There are a huge variety of metrics available and administrators have to select which information should be collected. The JMX Configuration Generator Tools is build to help generating valid complex JMX data collection configuration and RRD graph definitions for OpenNMS Horizon.
This tool is available as CLI and a web based version.
4.5.1. Web based utility
Complex JMX data collection configurations can be generated from a web based tool. It collects all available MBean Attributes or Composite Data Attributes from a JMX enabled Java application.
The workflow of the tool is:
-
Connect with JMX or JMXMP against a MBean Server provided of a Java application
-
Retrieve all MBean and Composite Data from the application
-
Select specific MBeans and Composite Data objects which should be collected by OpenNMS Horizon
-
Generate JMX Collectd configuration file and RRD graph definitions for OpenNMS Horizon as downloadable archive
The following connection settings are supported:
-
Ability to connect to MBean Server with RMI based JMX
-
Authentication credentials for JMX connection
-
Optional: JMXMP connection
The web based configuration tool can be used in the OpenNMS Horizon Web Application in administration section Admin → JMX Configuration Generator.
Configure JMX Connection
At the beginning the connection to an MBean Server of a Java application has to be configured.
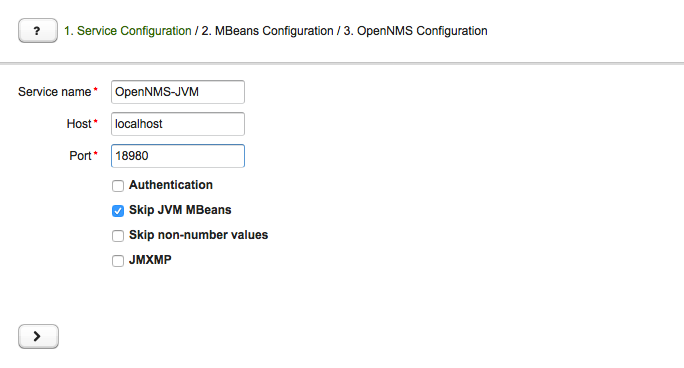
-
Service name: The name of the service to bind the JMX data collection for Collectd
-
Host: IP address or FQDN connecting to the MBean Server to load MBeans and Composite Data into the generation tool
-
Port: Port to connect to the MBean Server
-
Authentication: Enable / Disable authentication for JMX connection with username and password
-
Skip non-number values: Skip attributes with non-number values
-
JMXMP: Enable / Disable JMX Messaging Protocol instead of using JMX over RMI
By clicking the arrow ( > ) the MBeans and Composite Data will be retrieved with the given connection settings. The data is loaded into the MBeans Configuration screen which allows to select metrics for the data collection configuration.
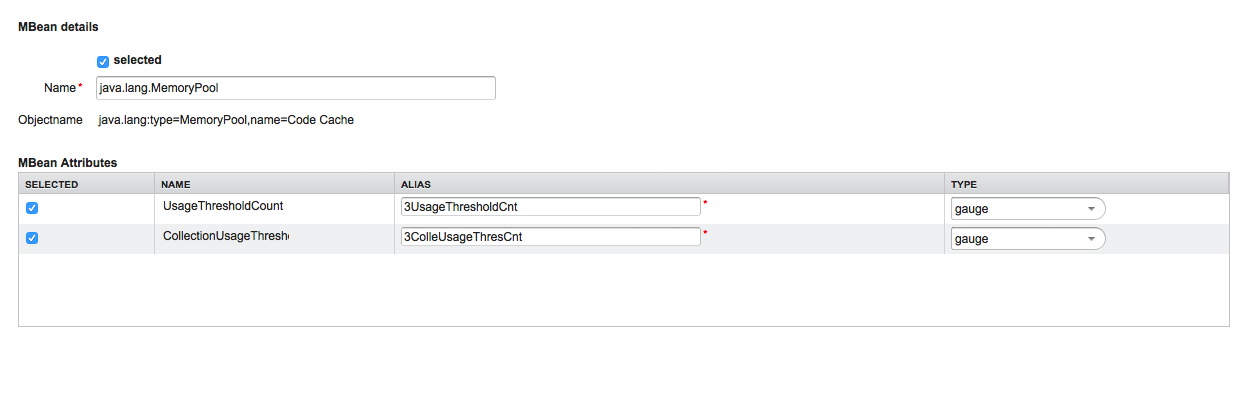
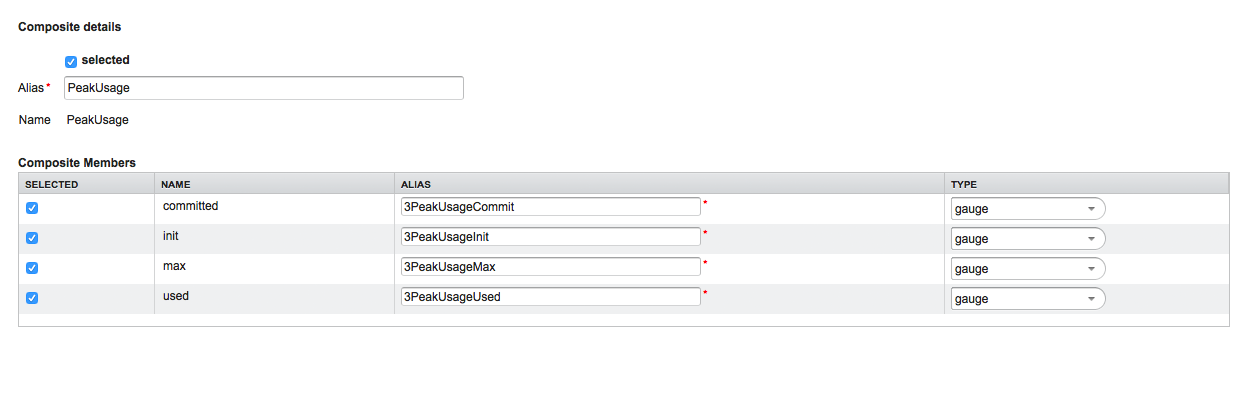
Select MBeans and Composite
The MBeans Configuration section is used to assign the MBean and Composite Data attributes to RRD domain specific data types and data source names.
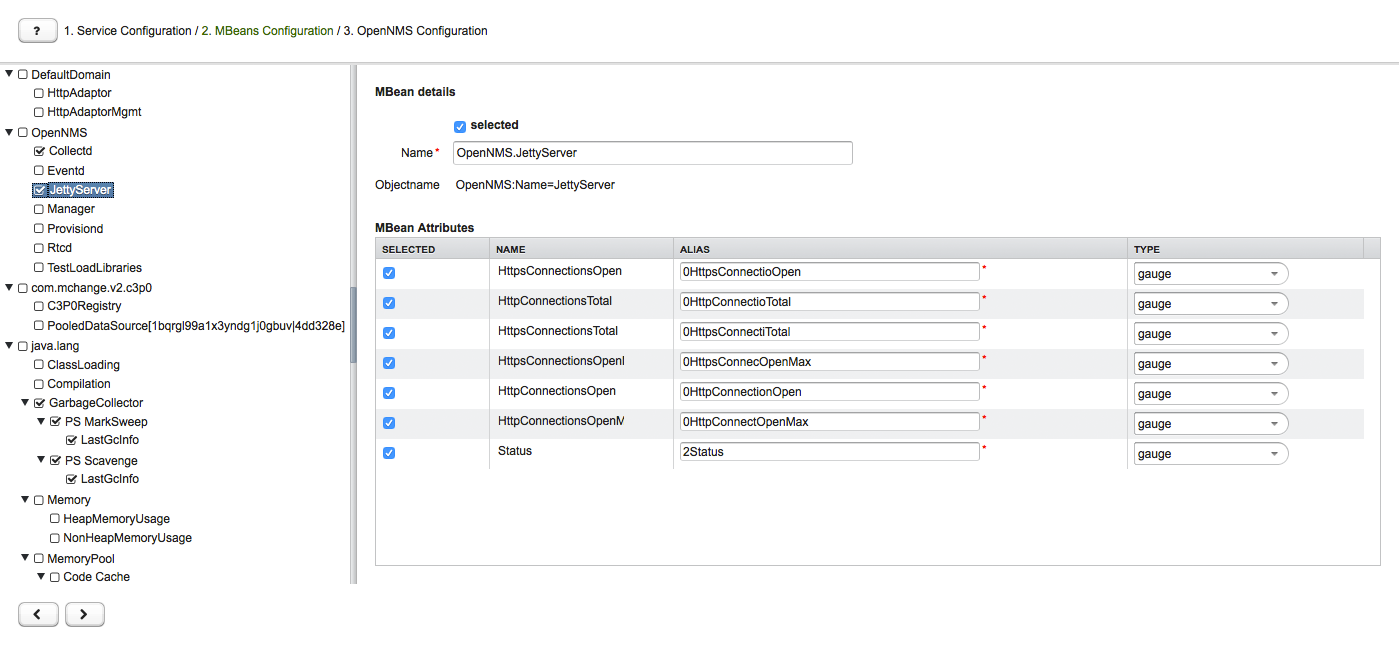
The left sidebar shows the tree with the JMX Domain, MBeans and Composite Data hierarchy retrieved from the MBean Server. To select or deselect all attributes use Mouse right click → select/deselect.
The right panel shows the MBean Attributes with the RRD specific mapping and allows to select or deselect specific MBean Attriubtes or Composite Data Attributes for the data collection configuration.
-
MBean Name or Composite Alias: Identifies the MBean or the Composite Data object
-
Selected: Enable/Disable the MBean attribute or Composite Member to be included in the data collection configuration
-
Name: Name of the MBean attribute or Composite Member
-
Alias: the data source name for persisting measurements in RRD or JRobin file
-
Type: Gauge or Counter data type for persisting measurements in RRD or JRobin file
The MBean Name, Composite Alias and Name are validated against special characters. For the Alias inputs are validated to be not longer then 19 characters and have to be unique in the data collection configuration.
Download and include configuration
The last step is generating the following configuration files for OpenNMS Horizon:
-
collectd-configuration.xml: Generated sample configuration assigned to a service with a matching data collection group
-
jmx-datacollection-config.xml: Generated JMX data collection configuration with the selected MBeans and Composite Data
-
snmp-graph.properties: Generated default RRD graph definition files for all selected metrics
The content of the configuration files can be copy & pasted or can be downloaded as ZIP archive.
| If the content of the configuration file exceeds 2,500 lines, the files can only be downloaded as ZIP archive. |
4.5.2. CLI based utility
The command line (CLI) based tool is not installed by default. It is available as Debian and RPM package in the official repositories.
Installation
yum install opennms-jmx-config-generatorapt-get install opennms-jmx-config-generatorIt is required to have the Java 8 Development Kit with Apache Maven installed.
The mvn binary has to be in the path environment.
After cloning the repository you have to enter the source folder and compile an executable JAR.
cd opennms/features/jmx-config-generator
mvn package
Inside the newly created target folder a file named jmxconfiggenerator-<VERSION>-onejar.jar is present.
This file can be invoked by:
java -jar target/jmxconfiggenerator-26.1.3-SNAPSHOT-onejar.jarUsage
After installing the the JMX Config Generator the tool’s wrapper script is located in the ${OPENNMS_HOME}/bin directory.
$ cd /path/to/opennms/bin
$ ./jmx-config-generator| When invoked without parameters the usage and help information is printed. |
The JMX Config Generator uses sub-commands for the different configuration generation tasks. Each of these sub-commands provide different options and parameters. The command line tool accepts the following sub-commands.
| Sub-command | Description |
|---|---|
|
Queries a MBean Server for certain MBeans and attributes. |
|
Generates a valid |
|
Generates a RRD graph definition file with matching graph definitions for a given |
The following global options are available in each of the sub-commands of the tool:
| Option/Argument | Description | Default |
|---|---|---|
|
Show help and usage information. |
false |
|
Enables verbose mode for debugging purposes. |
false |
Sub-command: query
This sub-command is used to query a MBean Server for it’s available MBean objects.
The following example queries the server myserver with the credentials myusername/mypassword on port 7199 for MBean objects in the java.lang domain.
./jmx-config-generator query --host myserver --username myusername --password mypassword --port 7199 "java.lang:*"
java.lang:type=ClassLoading
	description: Information on the management interface of the MBean
	class name: sun.management.ClassLoadingImpl
	attributes: (5/5)
		TotalLoadedClassCount
			id: java.lang:type=ClassLoading:TotalLoadedClassCount
			description: TotalLoadedClassCount
			type: long
			isReadable: true
			isWritable: false
			isIs: false
		LoadedClassCount
			id: java.lang:type=ClassLoading:LoadedClassCount
			description: LoadedClassCount
			type: int
			isReadable: true
			isWritable: false
			isIs: false

<output omitted>
The following command line options are available for the query sub-command.
| Option/Argument | Description | Default |
|---|---|---|
|
A filter criteria to query the MBean Server for.
The format is |
- |
|
Hostname or IP address of the remote JMX host. |
- |
|
Only show the ids of the attributes. |
false |
|
Set |
- |
|
Include attribute values. |
false |
|
Use JMXMP and not JMX over RMI. |
false |
|
Password for JMX authentication. |
- |
|
Port of JMX service. |
- |
|
Only lists the available domains. |
true |
|
Includes MBeans, even if they do not have attributes.
Either due to the |
false |
|
Custom connection URL |
- |
|
Username for JMX authentication. |
- |
|
Show help and usage information. |
false |
|
Enables verbose mode for debugging purposes. |
false |
Sub-command: generate-conf
This sub-command can be used to generate a valid jmx-datacollection-config.xml for a given set of MBean objects queried from a MBean Server.
The following example generate a configuration file myconfig.xml for MBean objects in the java.lang domain of the server myserver on port 7199 with the credentials myusername/mypassword.
You have to define either an URL or a hostname and port to connect to a JMX server.
jmx-config-generator generate-conf --host myserver --username myusername --password mypassword --port 7199 "java.lang:*" --output myconfig.xml
Dictionary entries loaded: '18'
The following options are available for the generate-conf sub-command.
| Option/Argument | Description | Default |
|---|---|---|
|
A list of attribute Ids to be included for the generation of the configuration file. |
- |
|
Path to a dictionary file for replacing attribute names and part of MBean attributes. The file should have for each line a replacement, e.g. Auxillary:Auxil. |
- |
|
Hostname or IP address of JMX host. |
- |
|
Use JMXMP and not JMX over RMI. |
false |
|
Output filename to write generated |
- |
|
Password for JMX authentication. |
- |
|
Port of JMX service |
- |
|
Prints the used dictionary to STDOUT.
May be used with |
false |
|
The Service Name used as JMX data collection name. |
anyservice |
|
Skip default JavaVM Beans. |
false |
|
Skip attributes with non-number values |
false |
|
Custom connection URL |
- |
|
Username for JMX authentication |
- |
|
Show help and usage information. |
false |
|
Enables verbose mode for debugging purposes. |
false |
The option --skipDefaultVM offers the ability to ignore the MBeans provided as standard by the JVM and just create configurations for the MBeans provided by the Java Application itself.
This is particularly useful if an optimized configuration for the JVM already exists.
If the --skipDefaultVM option is not set the generated configuration will include the MBeans of the JVM and the MBeans of the Java Application.
|
Check the file and see if there are alias names with more than 19 characters.
This errors are marked with NAME_CRASH_AS_19_CHAR_VALUE
|
Sub-command: generate-graph
This sub-command generates a RRD graph definition file for a given configuration file.
The following example generates a graph definition file mygraph.properties using the configuration in file myconfig.xml.
./jmx-config-generator generate-graph --input myconfig.xml --output mygraph.properties
reports=java.lang.ClassLoading.MBeanReport, \
java.lang.ClassLoading.0TotalLoadeClassCnt.AttributeReport, \
java.lang.ClassLoading.0LoadedClassCnt.AttributeReport, \
java.lang.ClassLoading.0UnloadedClassCnt.AttributeReport, \
java.lang.Compilation.MBeanReport, \
<output omitted>
The following options are available for this sub-command.
| Option/Argument | Description | Default |
|---|---|---|
|
Configuration file to use as input to generate the graph properties file |
- |
|
Output filename for the generated graph properties file. |
- |
|
Prints the default template. |
false |
|
Template file using Apache Velocity template engine to be used to generate the graph properties. |
- |
|
Show help and usage information. |
false |
|
Enables verbose mode for debugging purposes. |
false |
Graph Templates
The JMX Config Generator uses a template file to generate the graphs.
It is possible to use a user-defined template.
The option --template followed by a file lets the JMX Config Generator use the external template file as base for the graph generation.
The following example illustrates how a custom template mytemplate.vm is used to generate the graph definition file mygraph.properties using the configuration in file myconfig.xml.
./jmx-config-generator generate-graph --input myconfig.xml --output mygraph.properties --template mytemplate.vmThe template file has to be an Apache Velocity template. The following sample represents the template that is used by default:
reports=#foreach( $report in $reportsList )
${report.id}#if( $foreach.hasNext ), \
#end
#end

#foreach( $report in $reportsBody )

#[[###########################################]]#
#[[##]]# $report.id
#[[###########################################]]#
report.${report.id}.name=${report.name}
report.${report.id}.columns=${report.graphResources}
report.${report.id}.type=interfaceSnmp
report.${report.id}.command=--title="${report.title}" \
 --vertical-label="${report.verticalLabel}" \
#foreach($graph in $report.graphs )
 DEF:${graph.id}={rrd${foreach.count}}:${graph.resourceName}:AVERAGE \
 AREA:${graph.id}#${graph.coloreB} \
 LINE2:${graph.id}#${graph.coloreA}:"${graph.description}" \
 GPRINT:${graph.id}:AVERAGE:" Avg \\: %8.2lf %s" \
 GPRINT:${graph.id}:MIN:" Min \\: %8.2lf %s" \
 GPRINT:${graph.id}:MAX:" Max \\: %8.2lf %s\\n" \
#end

#end
The JMX Config Generator generates different types of graphs from the jmx-datacollection-config.xml.
The different types are listed below:
| Type | Description |
|---|---|
AttributeReport |
For each attribute of any MBean a graph will be generated. Composite attributes will be ignored. |
MbeanReport |
For each MBean a combined graph with all attributes of the MBeans is generated. Composite attributes will be ignored. |
CompositeReport |
For each composite attribute of every MBean a graph is generated. |
CompositeAttributeReport |
For each composite member of every MBean a combined graph with all composite attributes is generated. |
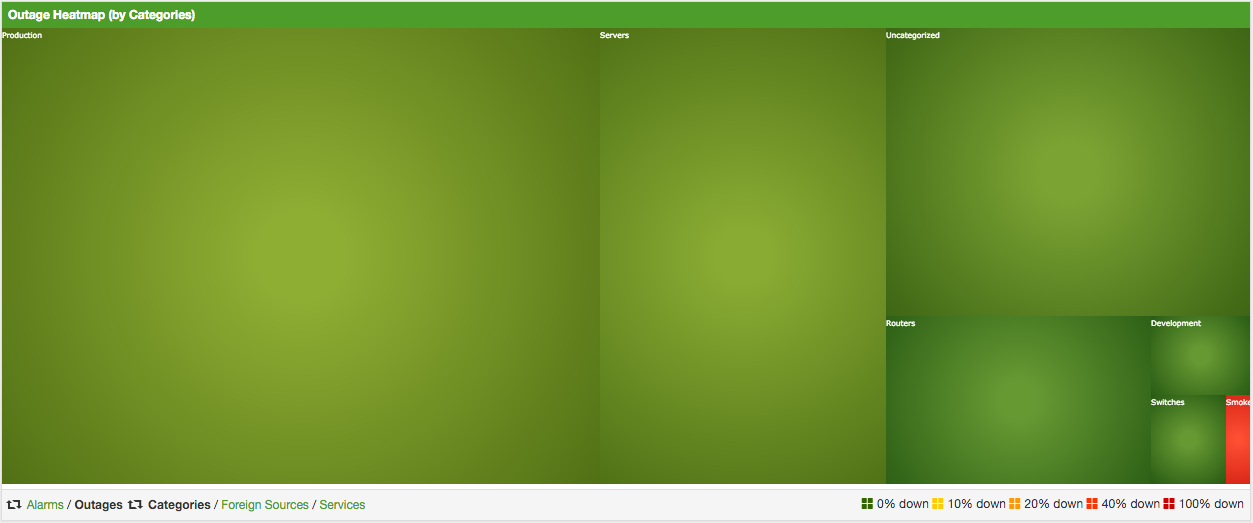
4.6. Heatmap
The Heatmap can be either be used to display unacknowledged alarms or to display ongoing outages of nodes. Each of this visualizations can be applied on categories, foreign sources or services of nodes. The sizing of an entity is calculated by counting the services inside the entity. Thus, a node with fewer services will appear in a smaller box than a node with more services.
The feature is by default deactivated and is configured through opennms.properties.
| Name | Type | Description | Default |
|---|---|---|---|
|
String |
There exist two options for using the heatmap: |
|
|
String |
This option defines which Heatmap is displayed by default.
Valid options are |
|
|
String |
The following option is used to filter for categories to be
displayed in the Heatmap. This option uses the Java regular
expression syntax. The default is |
|
|
String |
The following option is used to filter for foreign sources
to be displayed in the Heatmap. This option uses the Java
regular expression syntax. The default is |
|
|
String |
The following option is used to filter for services to be
displayed in the Heatmap. This option uses the Java regular
expression syntax. The default is |
|
|
Boolean |
This option configures whether only unacknowledged alarms will be taken into account when generating the alarm-based version of the Heatmap. |
|
|
String |
You can also place the Heatmap on the landing page by
setting this option to |
|
You can use negative lookahead expressions for excluding categories you wish not to be displayed in the heatmap,
e.g. by using an expression like ^(?!XY).* you can filter out entities with names starting with XY.
|
4.7. Trend
The Trend feature allows to display small inline charts of database-based statistics.
These chart are accessible in the Status menu of the OpenNMS' web application.
Furthermore it is also possible to configure these charts to be displayed on the OpenNMS' landing page.
To achieve this alter the org.opennms.web.console.centerUrl property to also include the entry /trend/trend-box.htm.

These charts can be configured and defined in the trend-configuration.xml file in your OpenNMS' etc directory.
The following sample defines a Trend chart for displaying nodes with ongoing outages.
   <trend-definition name="nodes">
        <title>Nodes</title> (1)
        <subtitle>w/ Outages</subtitle> (2)
        <visible>true</visible> (3)
        <icon>fa-fire</icon> (4)
        <trend-attributes> (5)
            <trend-attribute key="sparkWidth" value="100%"/>
            <trend-attribute key="sparkHeight" value="35"/>
            <trend-attribute key="sparkChartRangeMin" value="0"/>
            <trend-attribute key="sparkLineColor" value="white"/>
            <trend-attribute key="sparkLineWidth" value="1.5"/>
            <trend-attribute key="sparkFillColor" value="#88BB55"/>
            <trend-attribute key="sparkSpotColor" value="white"/>
            <trend-attribute key="sparkMinSpotColor" value="white"/>
            <trend-attribute key="sparkMaxSpotColor" value="white"/>
            <trend-attribute key="sparkSpotRadius" value="3"/>
            <trend-attribute key="sparkHighlightSpotColor" value="white"/>
            <trend-attribute key="sparkHighlightLineColor" value="white"/>
        </trend-attributes>
        <descriptionLink>outage/list.htm?outtype=current</descriptionLink> (6)
        <description>${intValue[23]} NODES WITH OUTAGE(S)</description> (7)
        <query> (8)
            <![CDATA[
                select (
                    select
                        count(distinct nodeid)
                    from
                        outages o, events e
                    where
                        e.eventid = o.svclosteventid
                        and iflostservice < E
                        and (ifregainedservice is null
                            or ifregainedservice > E)
                ) from (
                    select
                        now() - interval '1 hour' * (O + 1) AS S,
                        now() - interval '1 hour' * O as E
                    from
                        generate_series(0, 23) as O
                ) I order by S;
            ]]>
        </query>
</trend-definition>| 1 | title of the Trend chart, see below for supported variable substitutions |
| 2 | subtitle of the Trend chart, see below for supported variable substitutions |
| 3 | defines whether the chart is visible by default |
| 4 | icon for the chart, see Icons for viable options |
| 5 | options for inline chart, see jQuery Sparklines for viable options |
| 6 | the description link |
| 7 | the description text, see below for supported variable substitutions |
| 8 | the SQL statement for querying the chart’s values |
| Don’t forget to limit the SQL query’s return values! |
It is possible to use values or aggregated values in the title, subtitle and description fields. The following table describes the available variable substitutions.
| Name | Type | Description |
|---|---|---|
|
Integer |
integer maximum value |
|
Double |
maximum value |
|
Integer |
integer minimum value |
|
Double |
minimum value |
|
Integer |
integer average value |
|
Double |
average value |
|
Integer |
integer sum of values |
|
Double |
sum of value |
|
Integer |
array of integer result values for the given SQL query |
|
Double |
array of result values for the given SQL query |
|
Integer |
array of integer value changes for the given SQL query |
|
Double |
array of value changes for the given SQL query |
|
Integer |
last integer value |
|
Double |
last value |
|
Integer |
last integer value change |
|
Double |
last value change |
You can also display a single graph in your JSP files by including the file /trend/single-trend-box.jsp and specifying the name parameter.
<jsp:include page="/trend/single-trend-box.jsp" flush="false">
    <jsp:param name="name" value="example"/>
</jsp:include>
5. Service Assurance
This section will cover the basic functionalities how OpenNMS Horizon tests if a service or device available and measure his latency.
In OpenNMS Horizon this task is provided by a Service Monitor framework. The main component is Pollerd which provides the following functionality:
-
Track the status of a management resource or an application for availability calculations
-
Measure response times for service quality
-
Correlation of node and interface outages based on a Critical Service
The following image shows the model and representation of availability and response time.
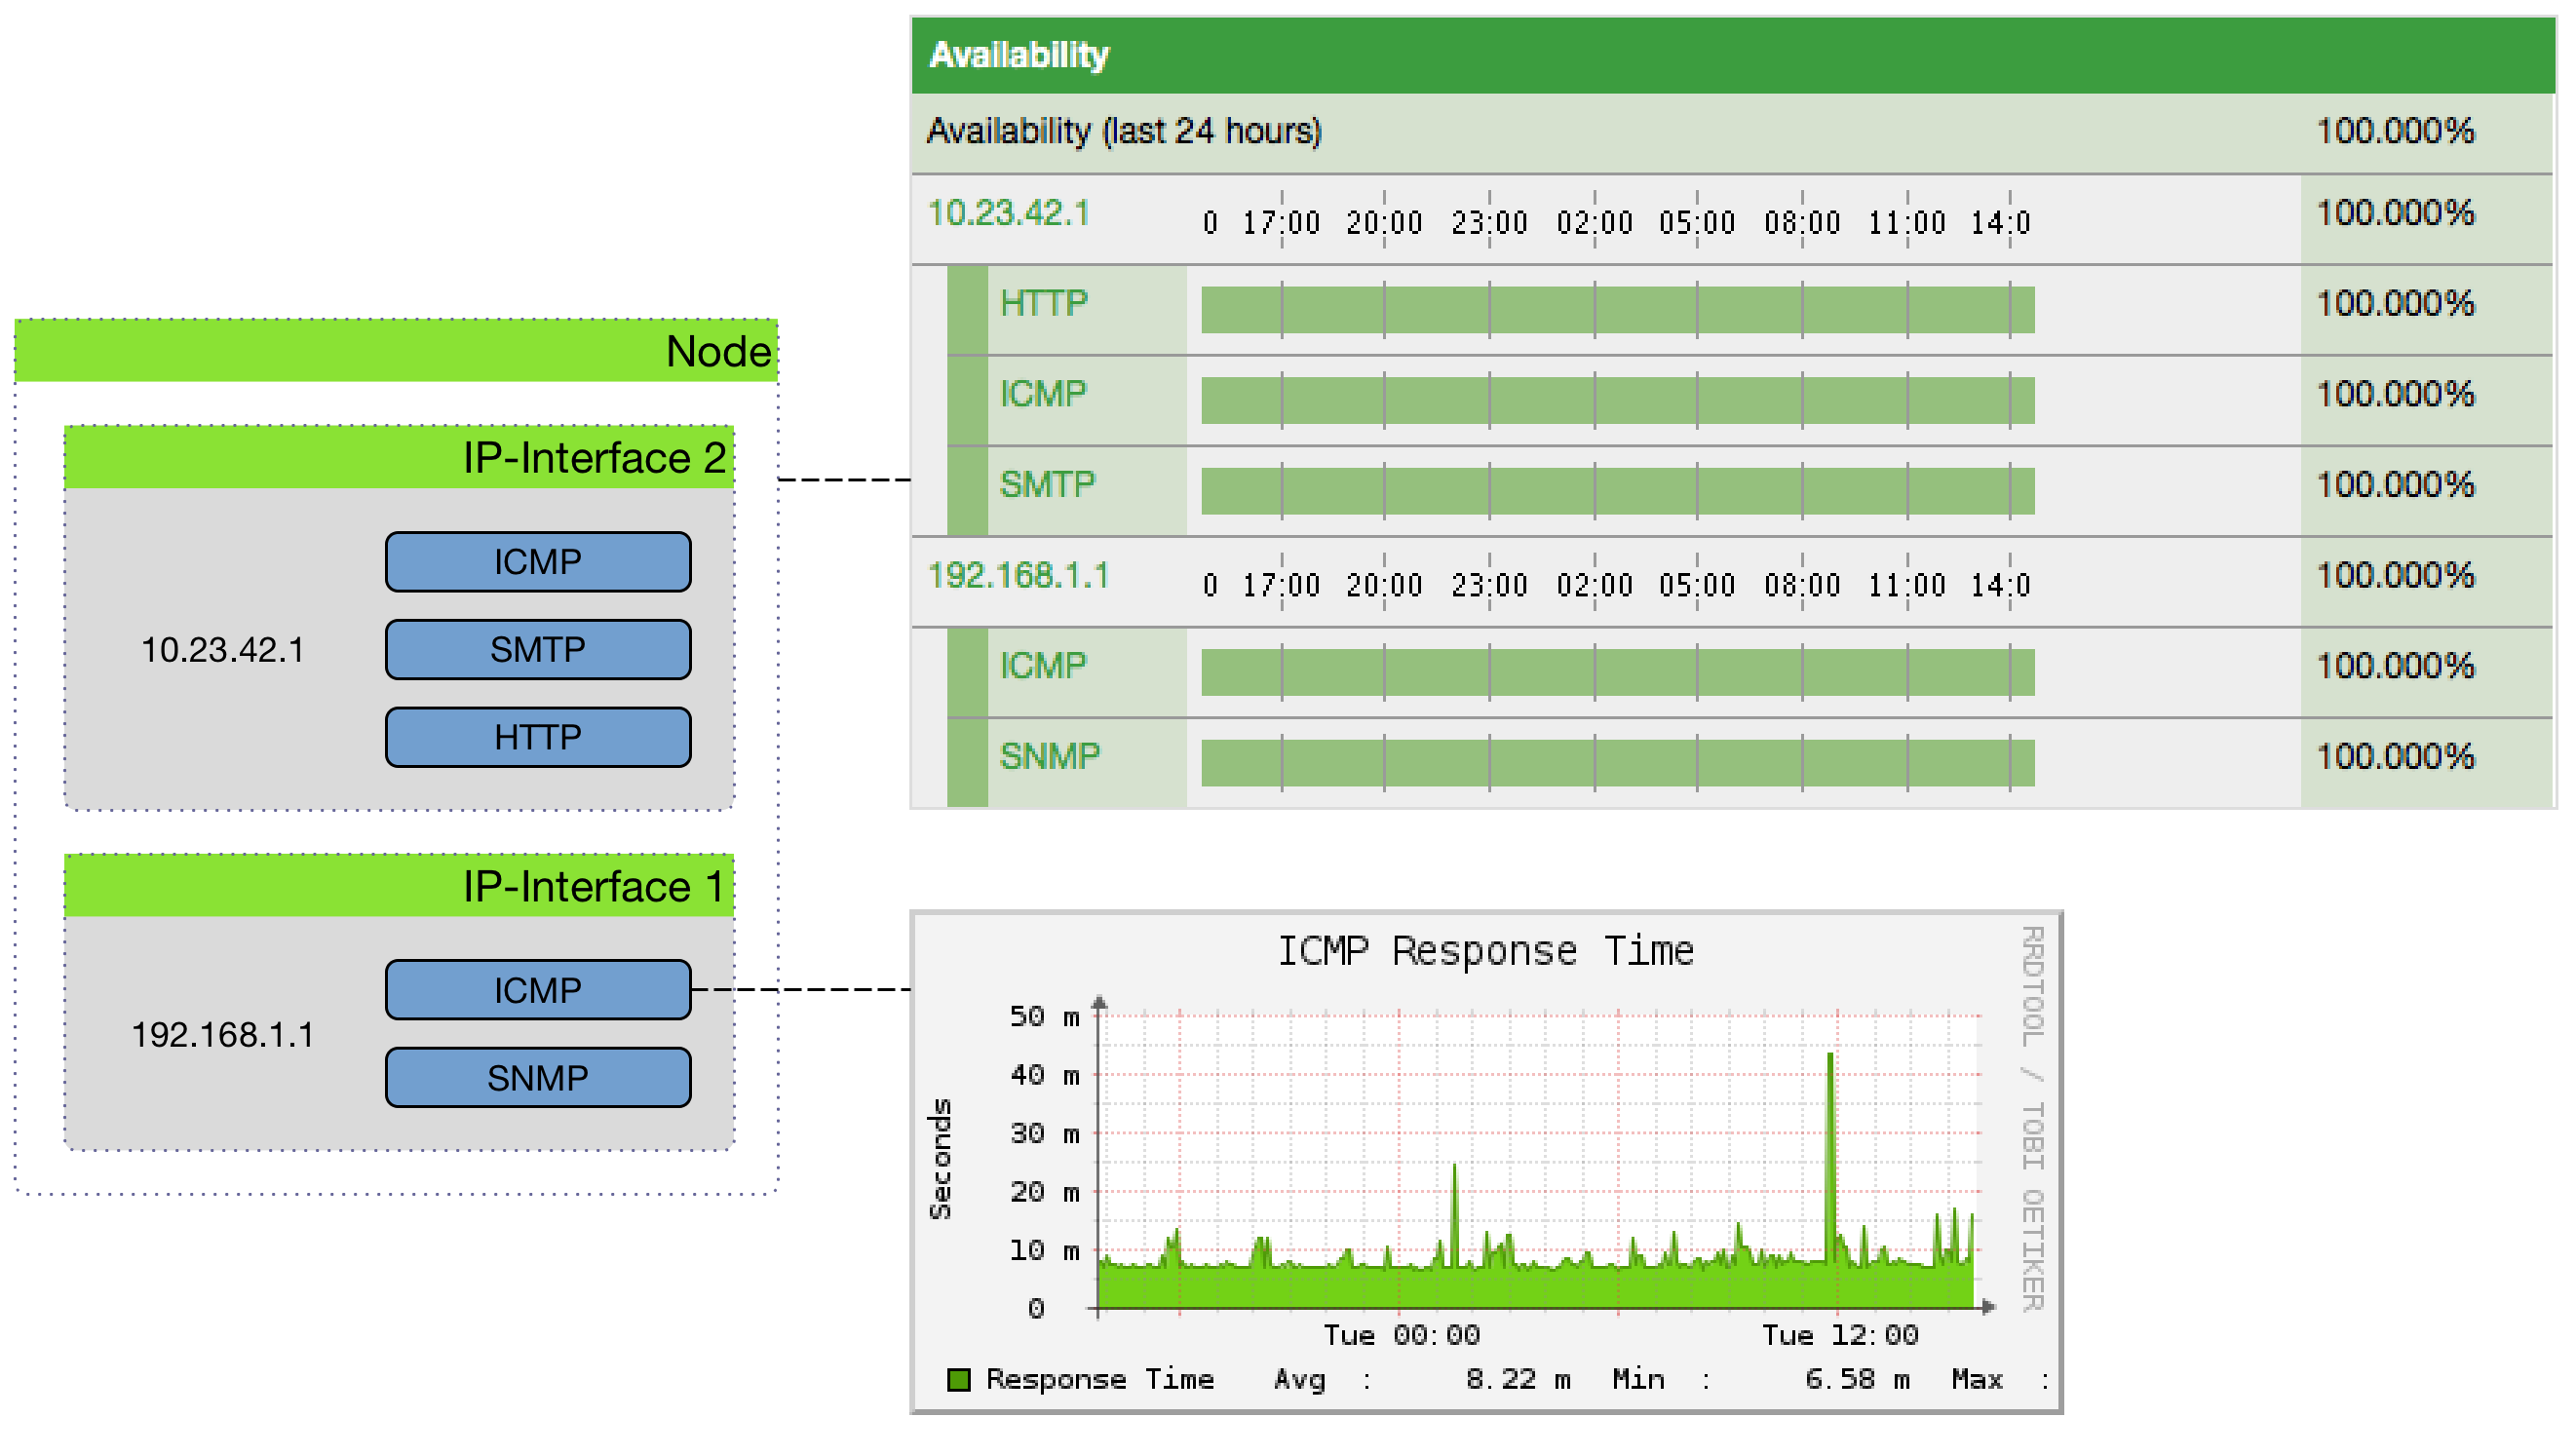
This information is based on Service Monitors which are scheduled and executed by Pollerd. A Service can have any arbitrary name and is associated with a Service Monitor. For example, we can define two Services with the name HTTP and HTTP-8080, both are associated with the HTTP Service Monitor but use a different TCP port configuration parameter. The following figure shows how Pollerd interacts with other components in OpenNMS and applications or agents to be monitored.
The availability is calculated over the last 24 hours and is shown in the Surveillance Views, SLA Categories and the Node Detail Page. Response times are displayed as Resource Graphs of the IP Interface on the Node Detail Page. Configuration parameters of the Service Monitor can be seen in the Service Page by clicking on the Service Name on the Node Detail Page. The status of a Service can be Up or Down.
| The Service Page also includes timestamps indicating the last time at which the service was polled and found to to be Up (Last Good) or Down (Last Fail). These fields can be used to validate that Pollerd is polling the services as expected. |
When a Service Monitor detects an outage, Pollerd sends an Event which is used to create an Alarm. Events can also be used to generate Notifications for on-call network or server administrators. The following images shows the interaction of Pollerd in OpenNMS Horizon.
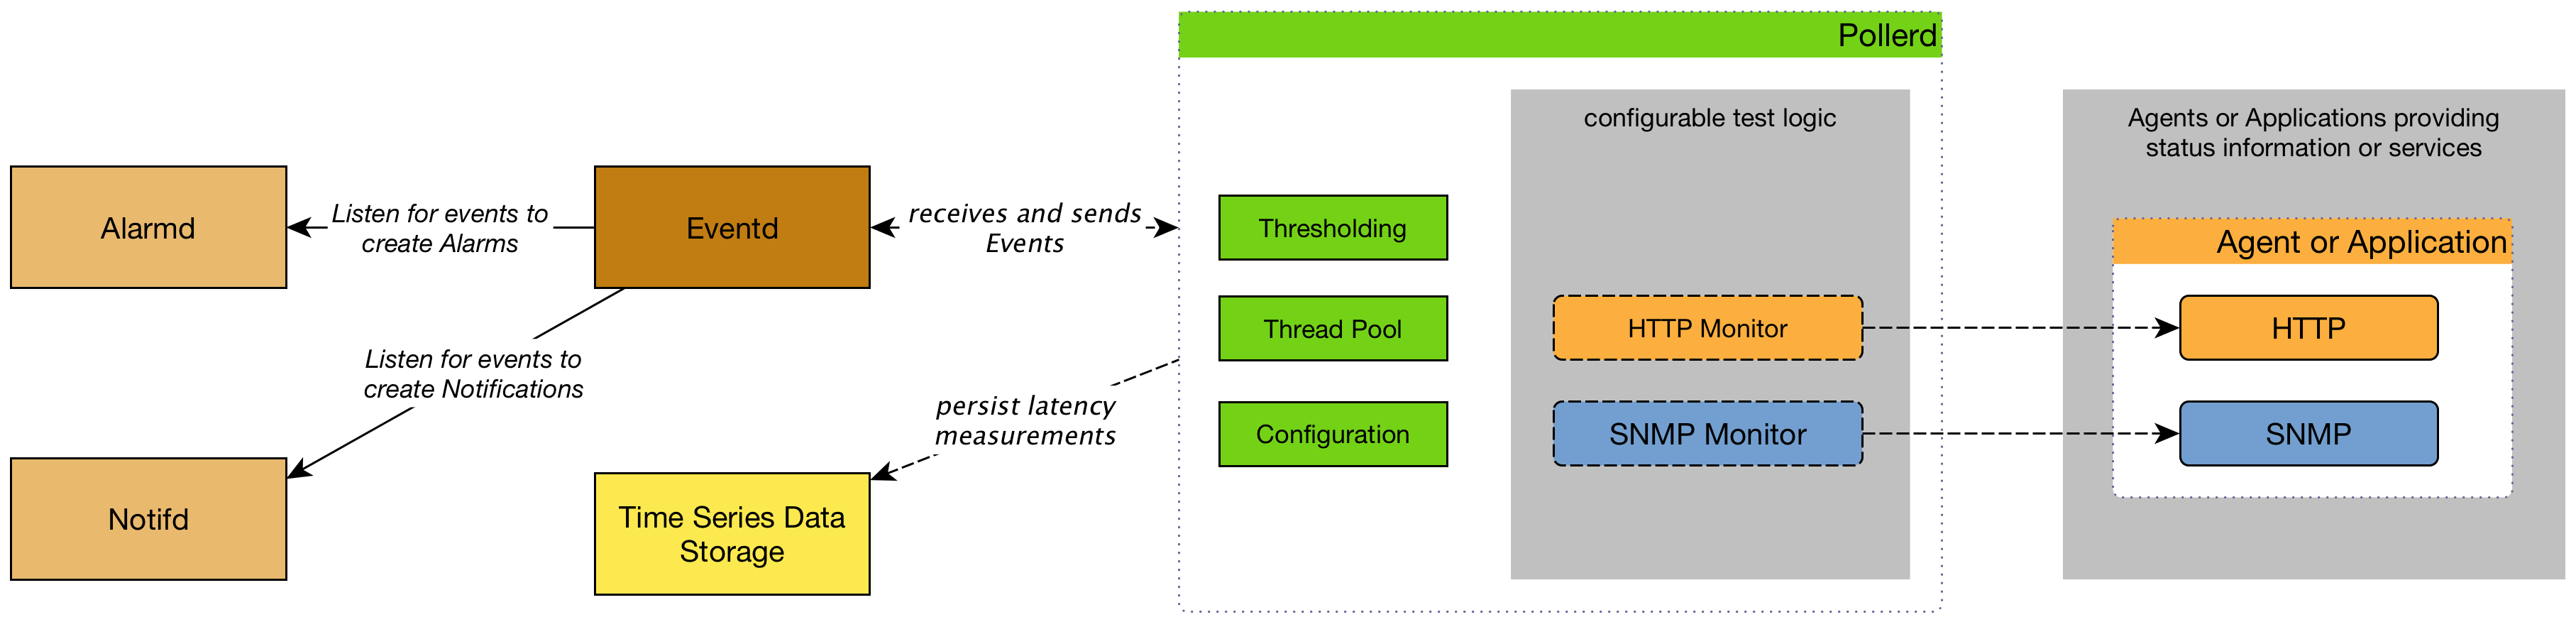
Pollerd can generate the following Events in OpenNMS Horizon:
| Event name | Description |
|---|---|
|
Critical Services are still up, just this service is lost. |
|
Service came back up |
|
Critical Service on an IP interface is down or all services are down. |
|
Critical Service on that interface came back up again |
|
All critical services on all IP interfaces are down from node. The whole host is unreachable over the network. |
|
Some of the Critical Services came back online. |
The behavior to generate interfaceDown and nodeDown events is described in the Critical Service section.
| This assumes that node-outage processing is enabled. |
5.1. Pollerd Configuration
| File | Description |
|---|---|
|
Configuration file for monitors and global daemon configuration |
|
Log file for all monitors and the global Pollerd |
|
RRD graph definitions for service response time measurements |
|
Event definitions for Pollerd, i.e. nodeLostService, interfaceDown or nodeDown |
To change the behavior for service monitoring, the poller-configuration.xml can be modified.
The configuration file is structured in the following parts:
-
Global daemon config: Define the size of the used Thread Pool to run Service Monitors in parallel. Define and configure the Critical Service for Node Event Correlation.
-
Polling packages: Package to allow grouping of configuration parameters for Service Monitors.
-
Downtime Model: Configure the behavior of Pollerd to run tests in case of an Outage is detected.
-
Monitor service association: Based on the name of the service, the implementation for application or network management protocols are assigned.
<poller-configuration threads="30" (1)
                      pathOutageEnabled="false" (2)
serviceUnresponsiveEnabled="false"> (3)| 1 | Size of the Thread Pool to run Service Monitors in parallel. |
| 2 | Enable or Disable Path Outage functionality based on a Critical Node in a network path. |
| 3 | In case of unresponsive service services a serviceUnresponsive event is generated and not an outage. This prevents the application of the Downtime Model in retesting the service after 30 seconds to help prevent false alarms. |
Configuration changes are applied by restarting OpenNMS and Pollerd. It is also possible to send an Event to Pollerd reloading the configuration. An Event can be sent on the CLI or the Web User Interface.
cd $OPENNMS_HOME/bin
./send-event.pl uei.opennms.org/internal/reloadDaemonConfig --parm 'daemonName Pollerd'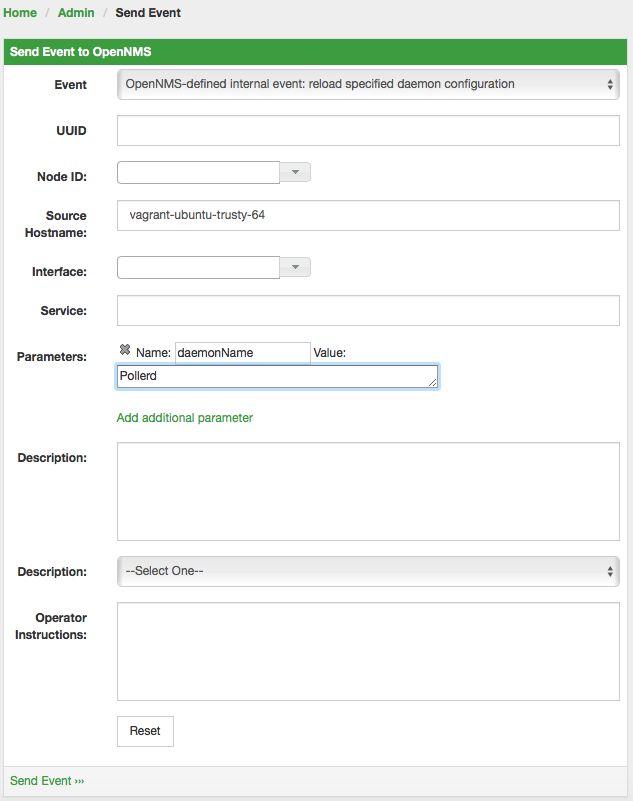
5.1.1. Meta-Data-DSL
Each parameter value can leverage dynamic configuration by using the Meta-Data-DSL.
During evaluation of an expression the following scopes are available:
-
Node meta-data
-
Interface meta-data
-
Service meta-data
5.2. Critical Service
Monitoring services on an IP network can be resource expensive, especially in cases where many of these services are not available. When a service is offline, or unreachable, the monitoring system spends most of it’s time waiting for retries and timeouts.
In order to improve efficiency, OpenNMS Horizon deems all services on a interface to be Down if the critical service is Down. By default OpenNMS Horizon uses ICMP as the critical service.
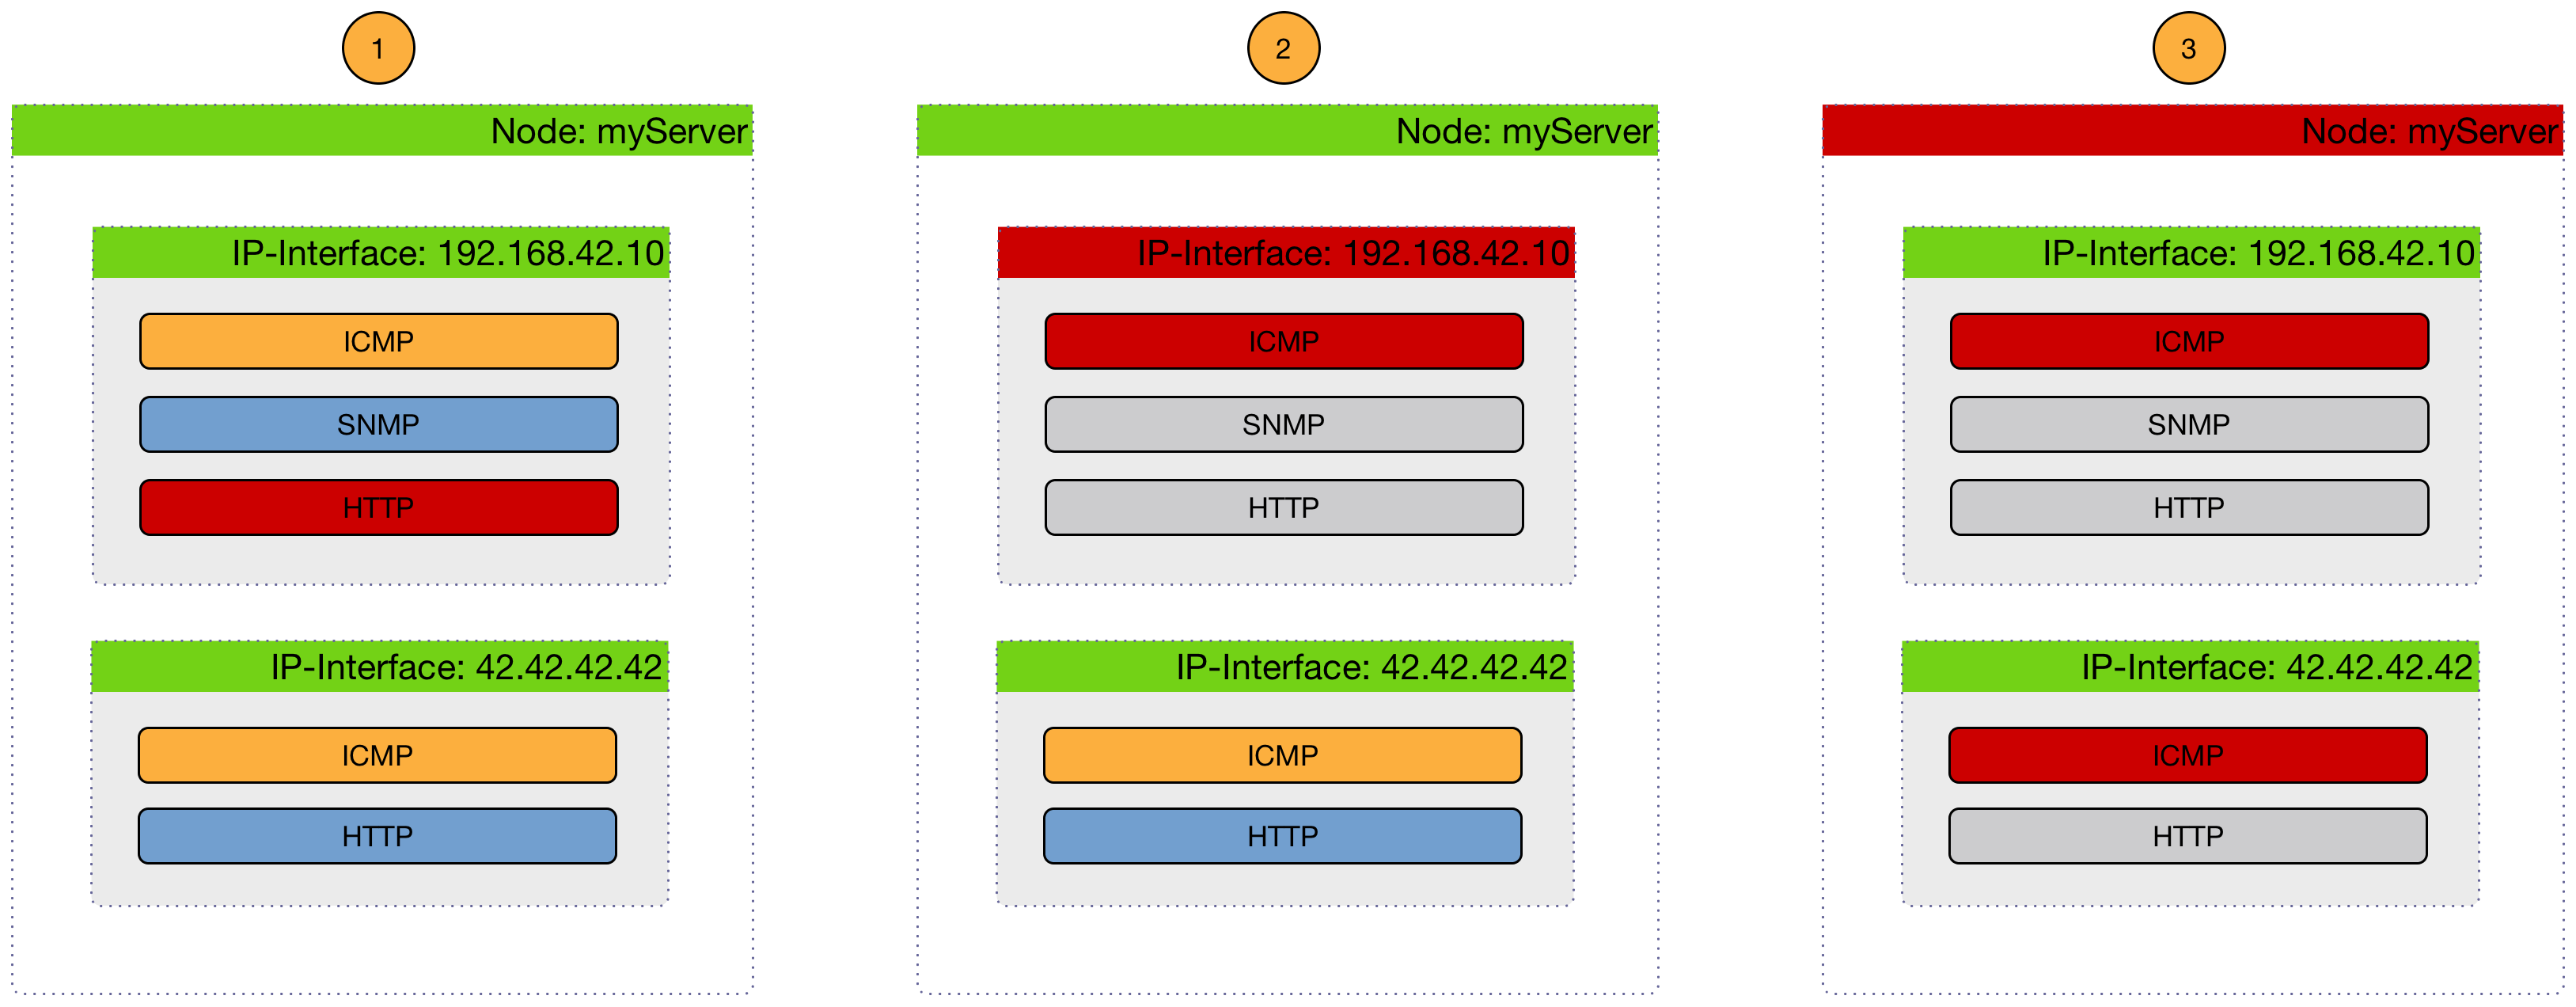
The following image shows, how a Critical Services is used to generate these events.
-
(1) Critical services are all Up on the Node and just a nodeLostService is sent.
-
(2) Critical service of one of many IP interface is Down and interfaceDown is sent. All other services are not tested and no events are sent, the services are assumed as unreachable.
-
(3) All Critical services on the Node are Down and just a nodeDown is sent. All other services on the other IP Interfaces are not tested and no events are sent, these services are assumed as unreachable.
The Critical Service is used to correlate outages from Services to a nodeDown or interfaceDown event.
It is a global configuration of Pollerd defined in poller-configuration.xml.
The OpenNMS Horizon default configuration enables this behavior.
<poller-configuration threads="30"
                      pathOutageEnabled="false"
                      serviceUnresponsiveEnabled="false">

  <node-outage status="on" (1)
               pollAllIfNoCriticalServiceDefined="true"> (2)
    <critical-service name="ICMP" /> (3)
</node-outage>| 1 | Enable Node Outage correlation based on a Critical Service |
| 2 | Optional: In case of nodes without a Critical Service this option controls the behavior.
If set to true then all services will be polled.
If set to false then the first service in the package that exists on the node will be polled until service is restored, and then polling will resume for all services. |
| 3 | Define Critical Service for Node Outage correlation |
5.3. Downtime Model
By default the monitoring interval for a service is 5 minutes. To detect also short services outages, caused for example by automatic network rerouting, the downtime model can be used. On a detected service outage, the interval is reduced to 30 seconds for 5 minutes. If the service comes back within 5 minutes, a shorter outage is documented and the impact on service availability can be less than 5 minutes. This behavior is called Downtime Model and is configurable.
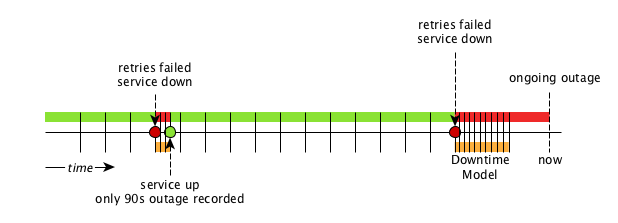
In figure Outages and Downtime Model there are two outages. The first outage shows a short outage which was detected as up after 90 seconds. The second outage is not resolved now and the monitor has not detected an available service and was not available in the first 5 minutes (10 times 30 second polling). The scheduler changed the polling interval back to 5 minutes.
<downtime interval="30000" begin="0" end="300000" /><!-- 30s, 0, 5m -->(1)
<downtime interval="300000" begin="300000" end="43200000" /><!-- 5m, 5m, 12h -->(2)
<downtime interval="600000" begin="43200000" end="432000000" /><!-- 10m, 12h, 5d -->(3)
<downtime interval="3600000" begin="432000000" delete="never"/><!-- 1h, 5d -->(4)| 1 | from 0 seconds after an outage is detected until 5 minutes, the polling interval will be set to 30 seconds |
| 2 | after 5 minutes of an ongoing outage until 12 hours, the polling interval will be set to 5 minutes |
| 3 | after 12 hours of an ongoing outage until 5 days, the polling interval will be set to 10 minutes |
| 4 | after 5 days of an ongoing outage the service will be polled only once a hour and we do not delete services |
The last downtime interval can have an attribute delete and allows you to influence the service lifecycle.
It defines the behavior that happens if a service doesn’t come back online after 5 days.
The following downtime attributes for delete can be used:
| Value | description |
|---|---|
|
services will never be deleted automatically |
|
only managed services will be deleted |
|
managed and unmanaged services will be deleted |
not set |
if |
5.4. Path Outages
An outage of a central network component can cause a lot of node outages.
Path Outages can be used to suppress Notifications based on how Nodes depend on each other in the network which are defined in a Critical Path.
The Critical Path needs to be configured from the network perspective of the monitoring system.
By default the Path Outage feature is disabled and has to be enabled in the poller-configuration.xml.
The following image shows an example network topology.
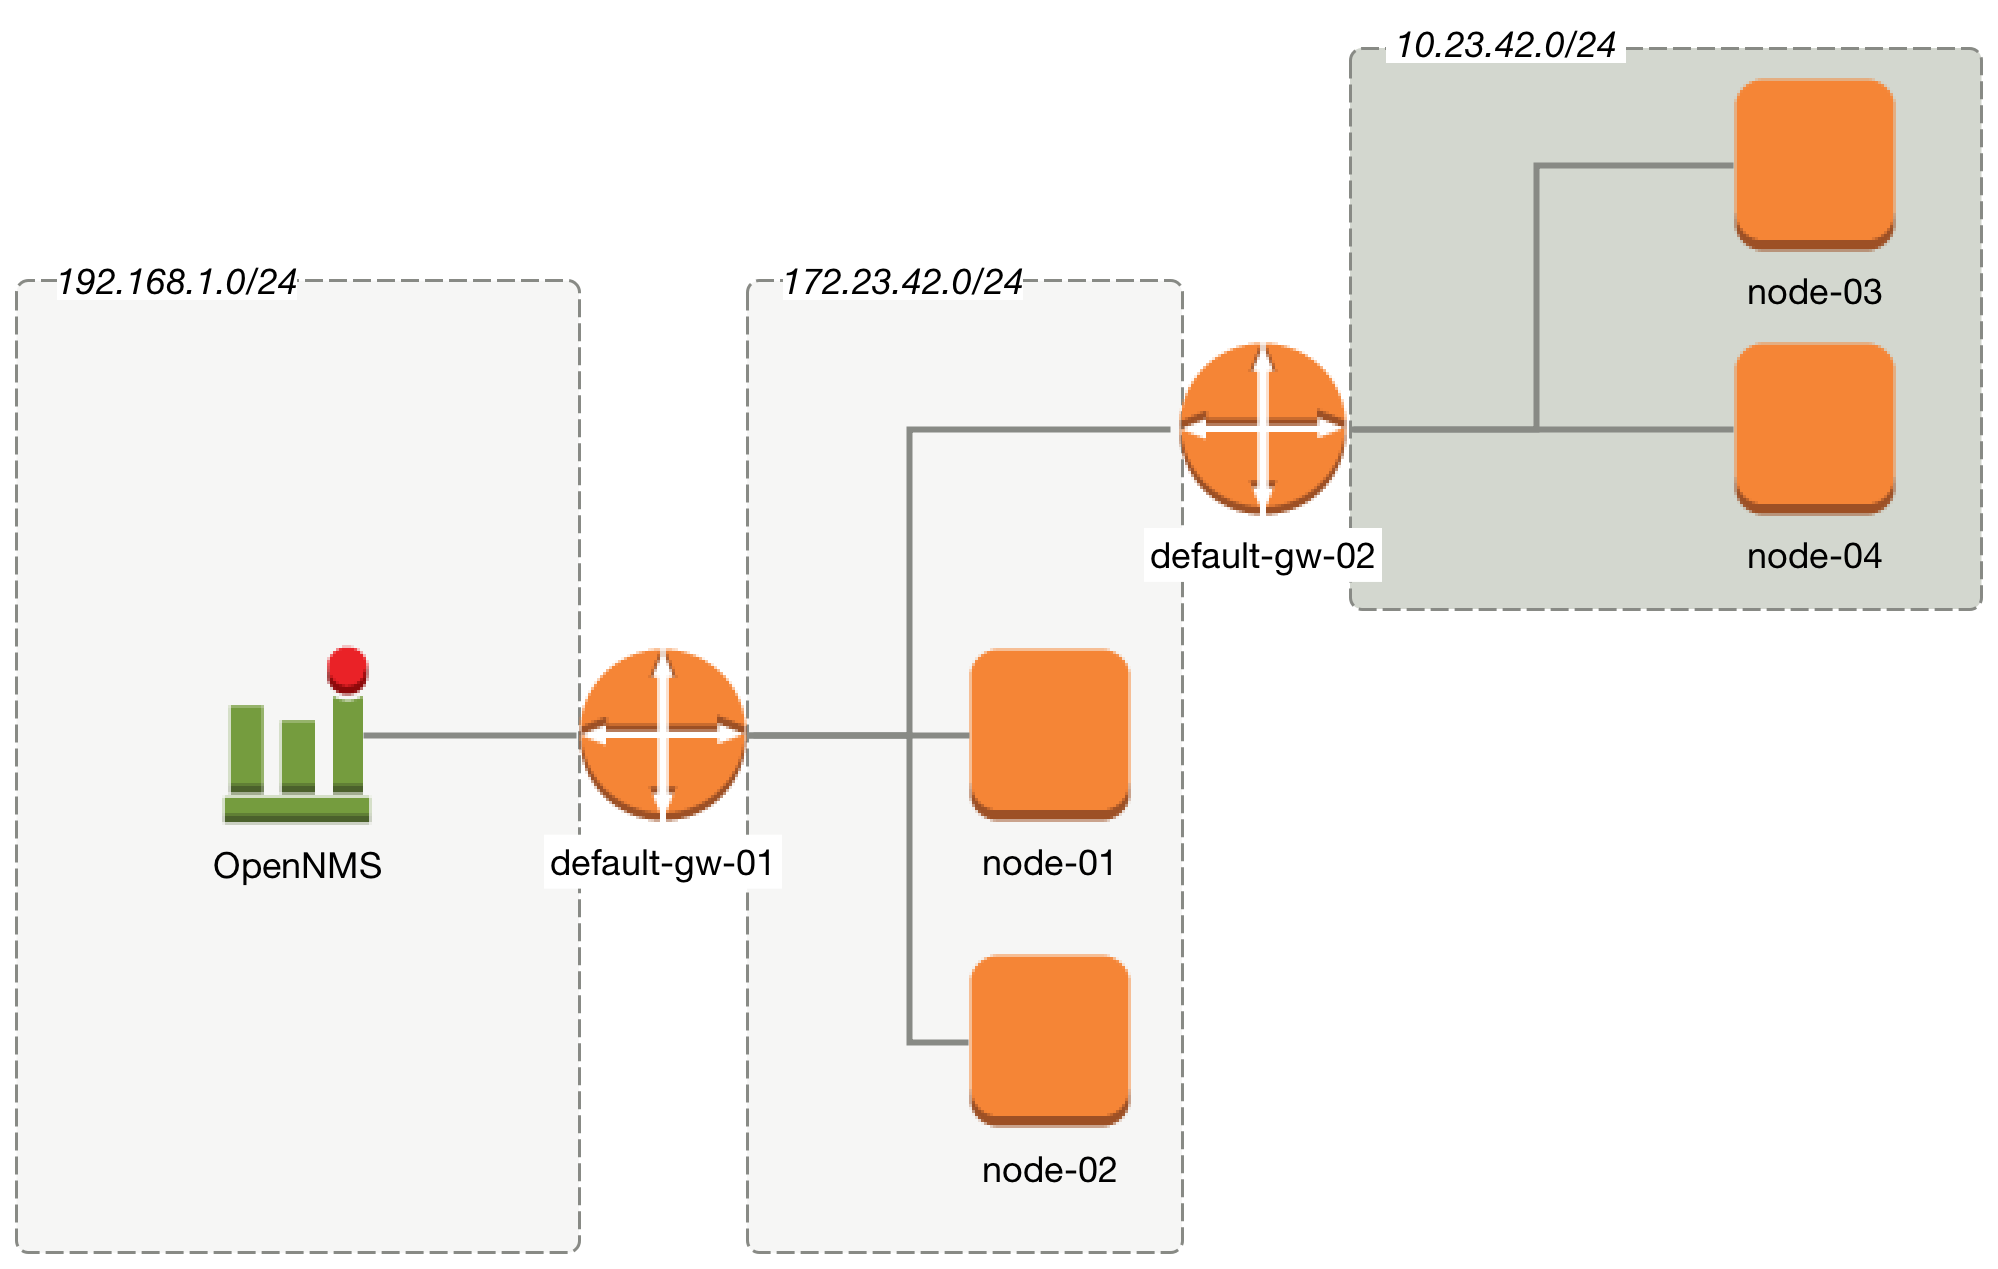
From the perspective of the monitoring system, a Router named default-gw-01 is on the Critical Path to reach two networks. If Router default-gw-01 is down, it is not possible to reach any node in the two networks behind and they will be all unreachable as well. In this case an administrator would like to have just one notification for default-gw-01 and not for all the other Nodes behind. Building this configuration in OpenNMS Horizon requires the following information:
-
Parent Foreign Source: The Foreign Source where the parent node is defined.
-
Parent Foreign ID: The Foreign ID of the parent Node where this node depends on.
-
The IP Interface selected as Primary is used as Critical IP
In this example we have created all Nodes in a Provisioning Requisition named Network-ACME and we use as the Foreign ID the same as the Node Label.
In the Web UI go to Admin → Configure OpenNMS → Manage Provisioning Requisitions → Edit the Requisition → Edit the Node → Path Outage to configure the network path by setting the Parent Foreign Source, Parent Foreign ID and Provisioned Node.
| Parent Foreign Source | Parent Foreign ID | Provisioned Node |
|---|---|---|
not defined |
not defined |
|
|
|
|
|
|
|
|
|
|
|
|
|
|
|
|
| The IP Interface which is set to Primary is selected as the Critical IP. In this example it is important the IP interface on default-gw-01 in the network 192.168.1.0/24 is set as Primary interface. The IP interface in the network 172.23.42.0/24 on default-gw-02 is set as Primary interface. |
5.5. Poller Packages
To define more complex monitoring configuration it is possible to group Service configurations into Polling Packages. They allow to assign to Nodes different Service Configurations. To assign a Polling Package to nodes the Rules/Filters syntax can be used. Each Polling Package can have its own Downtime Model configuration.
Multiple packages can be configured, and an interface can exist in more than one package. This gives great flexibility to how the service levels will be determined for a given device.
<package name="example1">(1)
  <filter>IPADDR != '0.0.0.0'</filter>(2)
  <include-range begin="1.1.1.1" end="254.254.254.254" />(3)
<include-range begin="::1" end="ffff:ffff:ffff:ffff:ffff:ffff:ffff:ffff" />(3)| 1 | Unique name of the polling package. |
| 2 | Filter can be based on IP address, categories or asset attributes of Nodes based on Rules/Filters. The filter is evaluated first and is required. This package is used for all IP Interfaces which don’t have 0.0.0.0 as an assigned IP address and is required. |
| 3 | Allow to specify if the configuration of Services is applied on a range of IP Interfaces (IPv4 or IPv6). |
Instead of the include-range it is possible to add one or more specific IP-Interfaces with:
<specific>192.168.1.59</specific>It is also possible to exclude IP Interfaces with:
<exclude-range begin="192.168.0.100" end="192.168.0.104"/>5.5.1. Response Time Configuration
The definition of Polling Packages allows to configure similar services with different polling intervals. All the response time measurements are persisted in RRD Files and require a definition. Each Polling Package contains a RRD definition
<package name="example1">
  <filter>IPADDR != '0.0.0.0'</filter>
  <include-range begin="1.1.1.1" end="254.254.254.254" />
  <include-range begin="::1" end="ffff:ffff:ffff:ffff:ffff:ffff:ffff:ffff" />
  <rrd step="300">(1)
    <rra>RRA:AVERAGE:0.5:1:2016</rra>(2)
    <rra>RRA:AVERAGE:0.5:12:1488</rra>(3)
    <rra>RRA:AVERAGE:0.5:288:366</rra>(4)
    <rra>RRA:MAX:0.5:288:366</rra>(5)
    <rra>RRA:MIN:0.5:288:366</rra>(6)
</rrd>| 1 | Polling interval for all services in this Polling Package is reflected in the step of size 300 seconds. All services in this package have to polled in 5 min interval, otherwise response time measurements are not correct persisted. |
| 2 | 1 step size is persisted 2016 times: 1 * 5 min * 2016 = 7 d, 5 min accuracy for 7 d. |
| 3 | 12 steps average persisted 1488 times: 12 * 5 min * 1488 = 62 d, aggregated to 60 min for 62 d. |
| 4 | 288 steps average persisted 366 times: 288 * 5 min * 366 = 366 d, aggregated to 24 h for 366 d. |
| 5 | 288 steps maximum from 24 h persisted for 366 d. |
| 6 | 288 steps minimum from 24 h persisted for 366 d. |
| The RRD configuration and the service polling interval has to be aligned. In other cases the persisted response time data is not correct displayed in the response time graph. |
| If the polling interval is changed afterwards, existing RRD files needs to be recreated with the new definitions. |
5.5.2. Overlapping Services
With the possibility of specifying multiple Polling Packages it is possible to use the same Service like ICMP multiple times.
The order how Polling Packages in the poller-configuration.xml are defined is important when IP Interfaces match multiple Polling Packages with the same Service configuration.
The following example shows which configuration is applied for a specific service:
<package name="less-specific">
  <filter>IPADDR != '0.0.0.0'</filter>
  <include-range begin="1.1.1.1" end="254.254.254.254" />
  <include-range begin="::1" end="ffff:ffff:ffff:ffff:ffff:ffff:ffff:ffff" />
  <rrd step="300">(1)
    <rra>RRA:AVERAGE:0.5:1:2016</rra>
    <rra>RRA:AVERAGE:0.5:12:1488</rra>
    <rra>RRA:AVERAGE:0.5:288:366</rra>
    <rra>RRA:MAX:0.5:288:366</rra>
    <rra>RRA:MIN:0.5:288:366</rra>
  </rrd>
  <service name="ICMP" interval="300000" user-defined="false" status="on">(2)
    <parameter key="retry" value="5" />(3)
    <parameter key="timeout" value="10000" />(4)
    <parameter key="rrd-repository" value="/var/lib/opennms/rrd/response" />
    <parameter key="rrd-base-name" value="icmp" />
    <parameter key="ds-name" value="icmp" />
  </service>
  <downtime interval="30000" begin="0" end="300000" />
  <downtime interval="300000" begin="300000" end="43200000" />
  <downtime interval="600000" begin="43200000" end="432000000" />
</package>

<package name="more-specific">
  <filter>IPADDR != '0.0.0.0'</filter>
  <include-range begin="192.168.1.1" end="192.168.1.254" />
  <include-range begin="2600::1" end="2600:::ffff" />
  <rrd step="30">(1)
    <rra>RRA:AVERAGE:0.5:1:20160</rra>
    <rra>RRA:AVERAGE:0.5:12:14880</rra>
    <rra>RRA:AVERAGE:0.5:288:3660</rra>
    <rra>RRA:MAX:0.5:288:3660</rra>
    <rra>RRA:MIN:0.5:288:3660</rra>
  </rrd>
  <service name="ICMP" interval="30000" user-defined="false" status="on">(2)
    <parameter key="retry" value="2" />(3)
    <parameter key="timeout" value="3000" />(4)
    <parameter key="rrd-repository" value="/var/lib/opennms/rrd/response" />
    <parameter key="rrd-base-name" value="icmp" />
    <parameter key="ds-name" value="icmp" />
  </service>
  <downtime interval="10000" begin="0" end="300000" />
  <downtime interval="300000" begin="300000" end="43200000" />
  <downtime interval="600000" begin="43200000" end="432000000" />
</package>| 1 | Polling interval in the packages are 300 seconds and 30 seconds |
| 2 | Different polling interval for the service ICMP |
| 3 | Different retry settings for the service ICMP |
| 4 | Different timeout settings for the service ICMP |
The last Polling Package on the service will be applied. This can be used to define a less specific catch all filter for a default configuration. A more specific Polling Package can be used to overwrite the default setting. In the example above all IP Interfaces in 192.168.1/24 or 2600:/64 will be monitored with ICMP with different polling, retry and timeout settings.
Which Polling Packages are applied to the IP Interface and Service can be found in the Web User Interface. The IP Interface and Service page show which Polling Package and Service configuration is applied for this specific service.
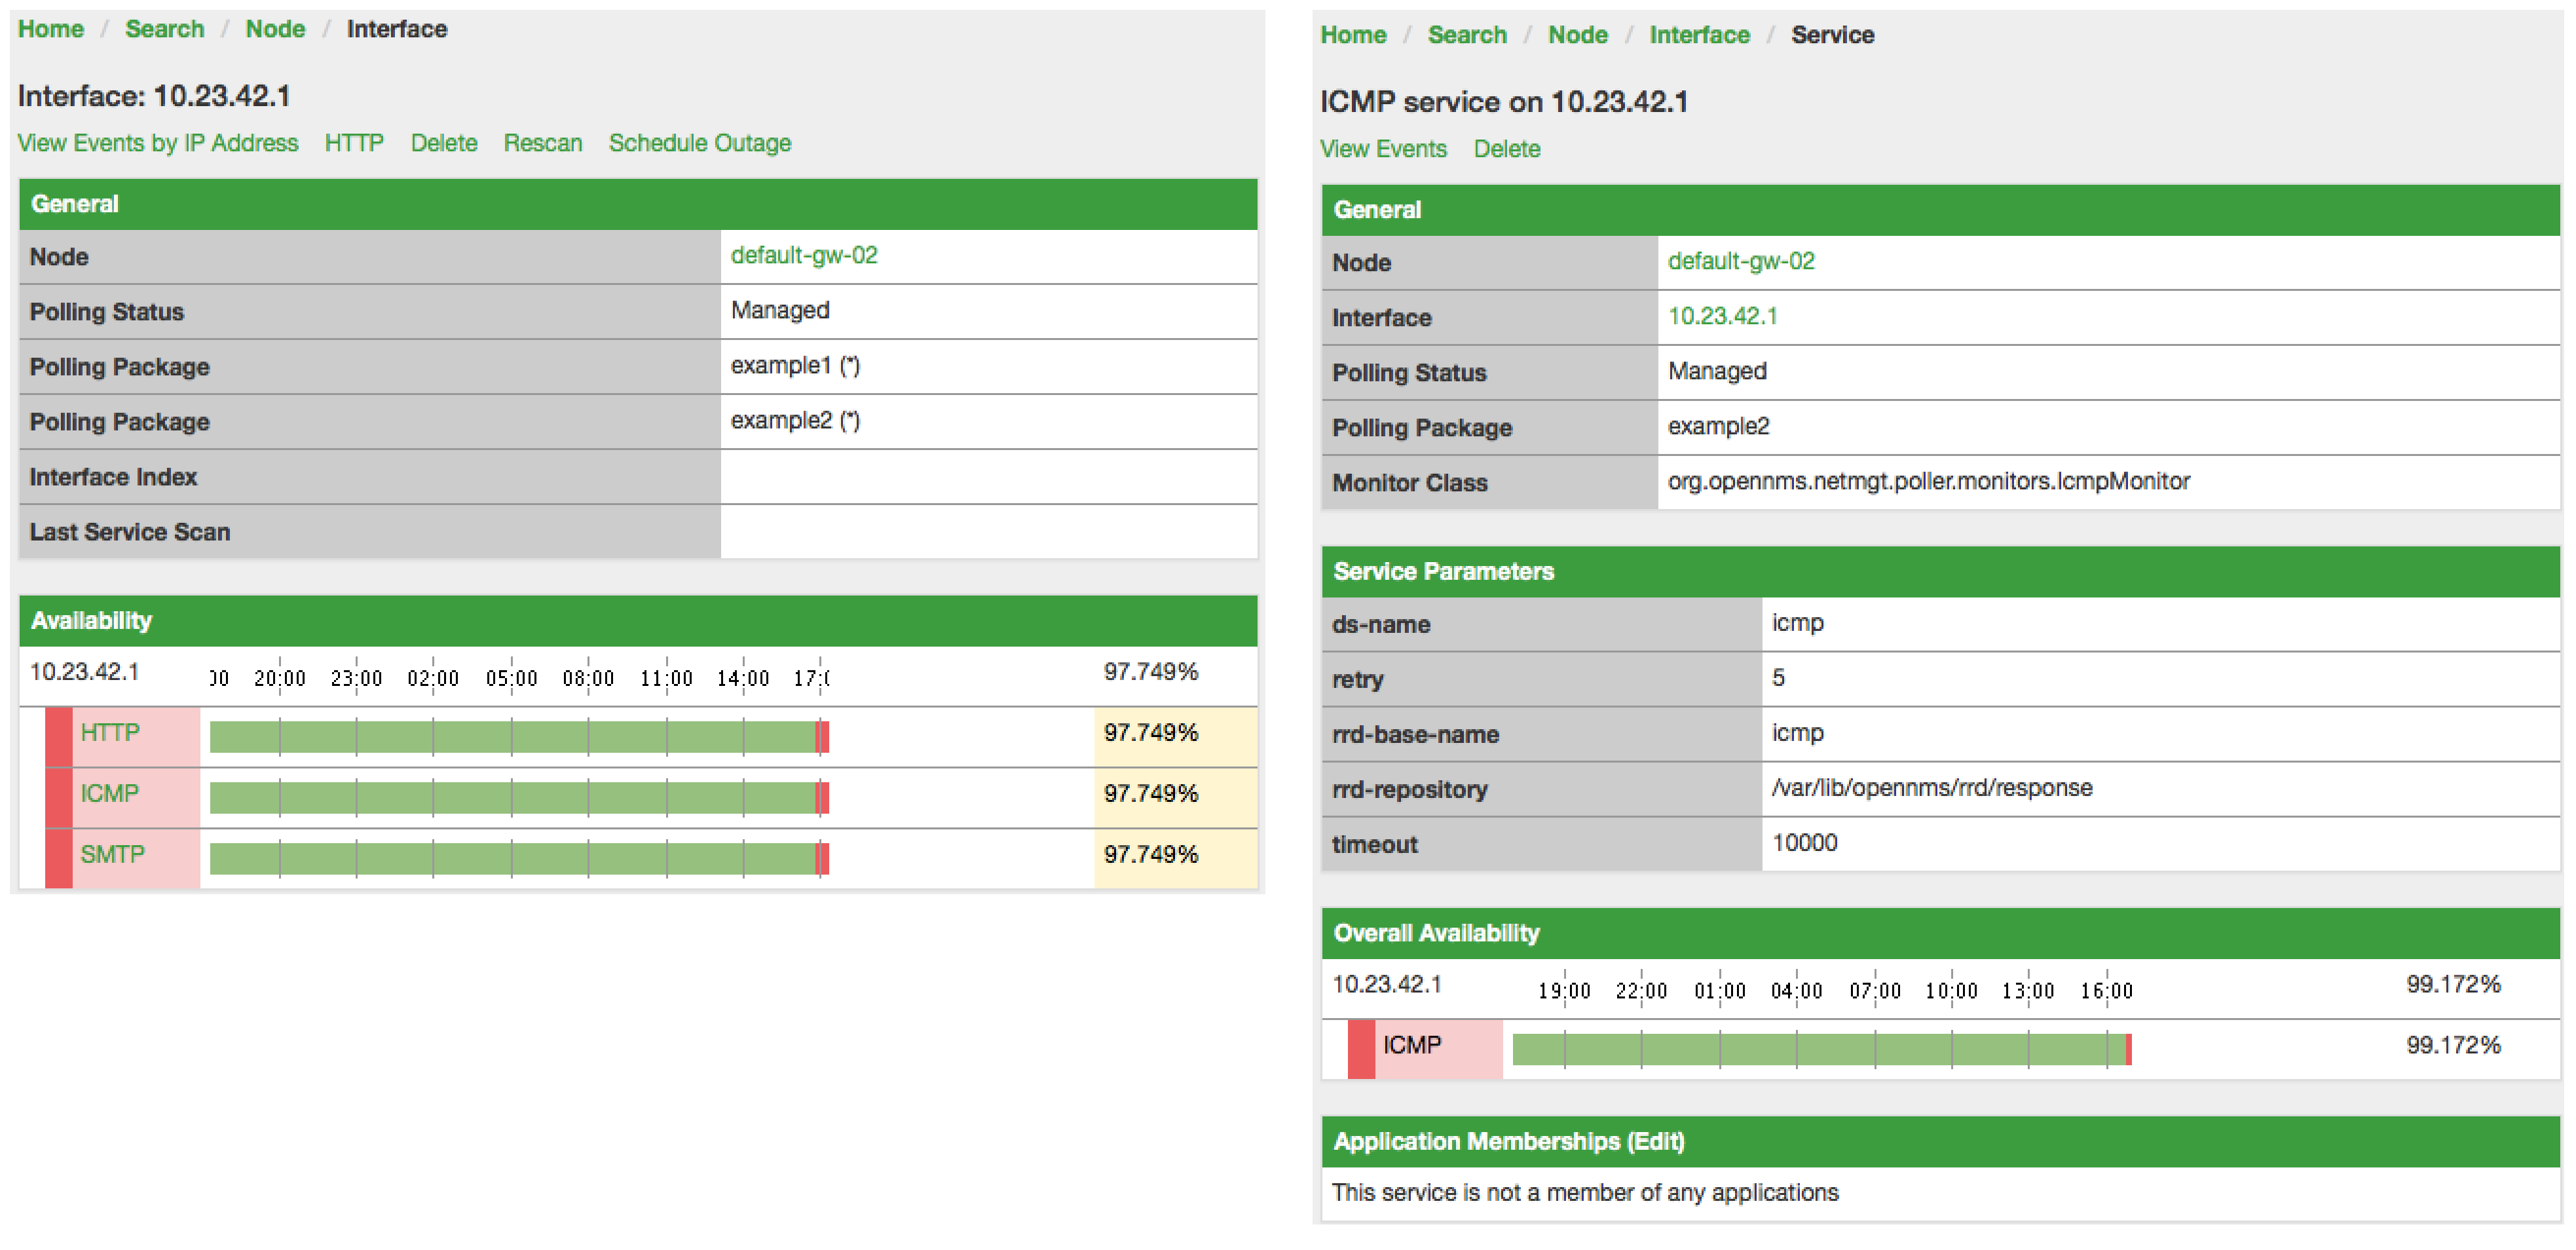
5.5.3. Service Patterns
Usually, the Poller used to monitor a Service is found by the matching the pollers name with the service name.
In addition, a matching poller can be found if an additional element pattern is specified for the poller.
If so, the poller is used for all services matching the RegEx pattern, too.
The RegEx pattern allows to specify named capture groups. There can be multiple capture groups inside of a pattern, but each must have a unique name. Please note, that the RegEx must be escaped or be wrapped in a CDATA-Tag inside the configuration XML to make it a valid property.
If a poller is matched using its pattern, the parts of the service name which matches the capture groups of the pattern are available as parameters to the Meta-Data-DSL using the context pattern and the capture group name as key.
Examples:
<pattern><![CDATA[^HTTP-(?<vhost>.*)$]]></pattern>-
Matches all services which names starts with
HTTP-followed by a host name. If the services is calledHTTP-www.example.com, the Meta-DSL expression${pattern:vhost}will resolved towww.example.com. <pattern><![CDATA[^HTTP-(?<vhost>.*?):(?<port>[0-9]+)$]]></pattern>"-
Matches all services which names starts with
HTTP-followed by a hostname and a port. There will be two variables (${pattern:vhost}and${pattern:port}) which can be used in the poller parameters.
The service pattern mechanism can be used to whenever there are multiple instances of a service on the same interface. By specifying a distinct service name to each instance, the services is identifiable, but there is no need to add a poller definition per service. Common use-cases for such services are HTTP Virtual Hosts, where multiple web applications run on the same web-server or BGP session monitoring where each router has multiple neighbours.
5.5.4. Test Services on manually
For troubleshooting it is possible to run a test via the Karaf Shell:
ssh -p 8101 admin@localhostOnce in the shell, you can print show the commands help as follows:
opennms> opennms:poll --help
DESCRIPTION
        opennms:poll

	Used to invoke a monitor against a host at a specified location

SYNTAX
        opennms:poll [options] host [attributes]

ARGUMENTS
        host
                Hostname or IP Address of the system to poll
                (required)
        attributes
                Monitor specific attributes in key=value form

OPTIONS
        --help
                Display this help message
        -l, --location
                Location
                (defaults to Default)
        -s, --system-id
                System ID
        -t, --ttl
                Time to live
        -P, --package
                Poller Package
        -S, --service
                Service name
        -n, --node-id
                Node Id for Service
        -c, --class
                Monitor Class
The following example runs the ICMP monitor on a specific IP Interface.
opennms> opennms:poll -S ICMP -P example1 10.23.42.1The output is verbose which allows debugging of Monitor configurations. Important output lines are shown as the following:
Package: example1 (1)
Service: ICMP (2)
Monitor: org.opennms.netmgt.poller.monitors.IcmpMonitor (3)
Parameter ds-name: icmp (4)
Parameter retry: 2 (5)
Parameter rrd-base-name: icmp (4)
Parameter rrd-repository: /opt/opennms/share/rrd/response (4)
Parameter timeout: 3000 (5)

Service is Up on 192.168.31.100 using org.opennms.netmgt.poller.monitors.IcmpMonitor: (6)
response-time: 407,0000 (7)| 1 | Service and Package of this test |
| 2 | Applied Service configuration from Polling Package for this test |
| 3 | Service Monitor used for this test |
| 4 | RRD configuration for response time measurement |
| 5 | Retry and timeout settings for this test |
| 6 | Polling result for the service polled against the IP address |
| 7 | Response time |
5.5.5. Test filters on Karaf Shell
Filters are ubiquitous in opennms configurations with <filter> syntax. This karaf shell can be used to verify filters. For more info, refer to Filters.
ssh -p 8101 admin@localhostOnce in the shell, print command help as follows
opennms> opennms:filter --help
DESCRIPTION
        opennms:filter
	Enumerates nodes/interfaces that match a give filter
SYNTAX
        opennms:filter filterRule
ARGUMENTS
        filterRule
                A filter Rule
For ex: Run a filter rule that match a location
opennms:filter "location='MINION'"Output is displayed as follows
nodeId=2 nodeLabel=00000000-0000-0000-0000-000000ddba11 location=MINION
	IpAddresses:
		127.0.0.1
Another ex: Run a filter that match a node location and for a given IP Address range. Refer to IPLIKE for more info on using IPLIKE syntax.
opennms:filter "location='Default' & (IPADDR IPLIKE 172.*.*.*)"Output is displayed as follows
nodeId=3 nodeLabel=label1 location=Default
	IpAddresses:
		172.10.154.1
		172.20.12.12
		172.20.2.14
		172.01.134.1
		172.20.11.15
		172.40.12.18

nodeId=5 nodeLabel=label2 location=Default
	IpAddresses:
		172.17.0.111

nodeId=6 nodeLabel=label3 location=Default
	IpAddresses:
		172.20.12.22
172.17.0.123| Node info displayed will have nodeId, nodeLabel, location and optional fileds like foreignId, foreignSource, categories when they exist. |
5.6. Service monitors
To support several specific applications and management agents, Pollerd executes Service Monitors. This section describes all available built-in Service Monitors which are available and can be configured to allow complex monitoring. For information how these can be extended, see Development Guide of the OpenNMS documentation.
5.6.1. Common Configuration Parameters
Application or Device specific Monitors are based on a generic API which provide common configuration parameters. These minimal configuration parameters are available in all Monitors and describe the behavior for timeouts, retries, etc.
| Parameter | Description | Required | Default value |
|---|---|---|---|
|
Number of attempts to test a Service to be up or down. |
optional |
|
|
Timeout for the isReachable method, in milliseconds. |
optional |
|
|
Invert the up/down behavior of the monitor |
optional |
|
In case the Monitor is using the SNMP Protocol the default configuration for timeout and retry are used from the SNMP Configuration (snmp-config.xml).
|
Minion Configuration Parameters
When nodes are configured with a non-default location, the associated Service Monitors are executed on a Minion configured with that same location. If there are many Minions at a given location, the Service Monitor may be executed on any of the Minions that are currently available. Users can choose to execute a Service Monitor on a specific Minion, by specifying the System ID of the Minion. This mechanism is used for monitoring the Minions individually.
The following parameters can be used to override this behavior and control where the Service Monitors are executed.
| Parameter | Description | Required | Default value |
|---|---|---|---|
|
Specify the location at which the Service Monitor should be executed. |
optional |
(The location of the associated node) |
|
Specify the System ID on which the Service Monitor should be executed |
optional |
(None) |
|
Use the foreign id of the associated node as the System ID |
optional |
|
| When specifying a System ID the location should also be set to the corresponding location for that system. |
5.6.2. Using Placeholders in Parameters
Some monitor parameters support placeholder substitution.
You can reference some node, interface, and asset record properties by enclosing them in { and }.
The supported properties are:
-
nodeId -
nodeLabel -
foreignSource -
foreignId -
ipAddr(oripAddress) -
all node asset record fields (e.g.
username,password)
Parameters that support placeholder substitution are marked 'Yes' in the 'Placeholder substitution' column of the Configuaration and Usage section of the monitor documentation.
5.6.3. ActiveMQMonitor
This monitor tests the availablity of an ActiveMQ Broker. The service is considered available if a successful connection is made.
Monitor facts
Class Name |
|
Remote Enabled |
true or false if the monitor can be used by the OpenNMS Horizon remote poller |
Configuration and Usage
| Parameter | Description | Required | Default value |
|---|---|---|---|
|
The ActiveMQ Broker URL to connect to. |
required |
|
|
The user name used to login to the ActiveMQ broker. |
optional |
|
|
The password used to authenticate the user on the ActiveMQ broker. |
optional |
|
|
A boolean to enable using the nodelabel when connecting to the ActiveMQ broker. |
optional |
|
|
A boolean to enable creating a JMS Session when connecting to the ActiveMQ broker. |
optional |
|
|
The client ID to use when connecting to the ActiveMQ broker. |
optional |
|
This monitor implements the Common Configuration Parameters.
Examples
Some example configuration how to configure the monitor in the poller-configuration.xml.
<parameter key="broker-url" value="failover://auto+ssl://192.168.1.1:61616/"/>
<parameter key="use-nodelabel" value="true"/>
5.6.4. AvailabilityMonitor
This monitor tests reachability of a node by using the isReachable method of the InetAddress java class. The service is considered available if isReachable returns true. See Oracle’s documentation for more details.
| This monitor is deprecated in favour of the IcmpMonitor monitor. You should only use this monitor on remote pollers running on unusual configurations (See below for more details). |
Monitor facts
Class Name |
|
Remote Enabled |
true |
Configuration and Usage
This monitor implements the Common Configuration Parameters.
Examples
<service name="AVAIL" interval="300000" user-defined="false" status="on">
  <parameter key="retry" value="2"/>
  <parameter key="timeout" value="5000"/>
</service>

<monitor service="AVAIL" class-name="org.opennms.netmgt.poller.monitors.AvailabilityMonitor"/>
IcmpMonitor vs AvailabilityMonitor
This monitor has been developped in a time when the IcmpMonitor monitor wasn’t remote enabled, to circumvent this limitation. Now, with the JNA ICMP implementation, the IcmpMonitor monitor is remote enabled under most configurations and this monitor shouldn’t be needed -unless you’re running your remote poller on such an unusual configuration (See also issue NMS-6735 for more information)-.
5.6.5. BgpSessionMonitor
This monitor checks if a BGP-Session to a peering partner (peer-ip) is functional. To monitor the BGP-Session the RFC1269 SNMP MIB is used and test the status of the session using the following OIDs is used:
BGP_PEER_STATE_OID = .1.3.6.1.2.1.15.3.1.2.<peer-ip>
BGP_PEER_ADMIN_STATE_OID = .1.3.6.1.2.1.15.3.1.3.<peer-ip>
BGP_PEER_REMOTEAS_OID = .1.3.6.1.2.1.15.3.1.9.<peer-ip>
BGP_PEER_LAST_ERROR_OID = .1.3.6.1.2.1.15.3.1.14.<peer-ip>
BGP_PEER_FSM_EST_TIME_OID = .1.3.6.1.2.1.15.3.1.16.<peer-ip>
The <peer-ip> is the far end IP address of the BGP session end point.
A SNMP get request for BGP_PEER_STATE_OID returns a result between 1 to 6.
The servicestates for OpenNMS Horizon are mapped as follows:
| Result | State description | Monitor state in OpenNMS Horizon |
|---|---|---|
|
Idle |
DOWN |
|
Connect |
DOWN |
|
Active |
DOWN |
|
OpenSent |
DOWN |
|
OpenConfirm |
DOWN |
|
Established |
UP |
Monitor facts
Class Name |
|
Remote Enabled |
false |
To define the mapping I used the description from RFC1771 BGP Finite State Machine.
Configuration and Usage
| Parameter | Description | Required | Default value |
|---|---|---|---|
|
IP address of the far end BGP peer session |
required |
|
This monitor implements the Common Configuration Parameters.
Examples
To monitor the session state Established it is necessary to add a service to your poller configuration in '$OPENNMS_HOME/etc/poller-configuration.xml', for example:
<!-- Example configuration poller-configuration.xml -->
<service name="BGP-Peer-99.99.99.99-AS65423" interval="300000"
         user-defined="false" status="on">
    <parameter key="retry" value="2" />
    <parameter key="timeout" value="3000" />
    <parameter key="port" value="161" />
    <parameter key="bgpPeerIp" value="99.99.99.99" />
</service>

<monitor service="BGP-Peer-99.99.99.99-AS65423" class-name="org.opennms.netmgt.poller.monitors.BgpSessionMonitor" />
Error code mapping
The BGP_PEER_LAST_ERROR_OID gives an error in HEX-code. To make it human readable a codemapping table is implemented:
| Error code | Error Message |
|---|---|
|
Message Header Error |
|
Message Header Error - Connection Not Synchronized |
|
Message Header Error - Bad Message Length |
|
Message Header Error - Bad Message Type |
|
OPEN Message Error |
|
OPEN Message Error - Unsupported Version Number |
|
OPEN Message Error - Bad Peer AS |
|
OPEN Message Error - Bad BGP Identifier |
|
OPEN Message Error - Unsupported Optional Parameter |
|
OPEN Message Error (deprecated) |
|
OPEN Message Error - Unacceptable Hold Time |
|
UPDATE Message Error |
|
UPDATE Message Error - Malformed Attribute List |
|
UPDATE Message Error - Unrecognized Well-known Attribute |
|
UPDATE Message Error - Missing Well-known Attribute |
|
UPDATE Message Error - Attribute Flags Error |
|
UPDATE Message Error - Attribute Length Error |
|
UPDATE Message Error - Invalid ORIGIN Attribute |
|
UPDATE Message Error (deprecated) |
|
UPDATE Message Error - Invalid NEXT_HOP Attribute |
|
UPDATE Message Error - Optional Attribute Error |
|
UPDATE Message Error - Invalid Network Field |
|
UPDATE Message Error - Malformed AS_PATH |
|
Hold Timer Expired |
|
Finite State Machine Error |
|
Cease |
|
Cease - Maximum Number of Prefixes Reached |
|
Cease - Administrative Shutdown |
|
Cease - Peer De-configured |
|
Cease - Administrative Reset |
|
Cease - Connection Rejected |
|
Cease - Other Configuration Change |
|
Cease - Connection Collision Resolution |
|
Cease - Out of Resources |
Instead of HEX-Code the error message will be displayed in the service down logmessage. To give some additional informations the logmessage contains also
BGP-Peer Adminstate
BGP-Peer Remote AS
BGP-Peer established time in seconds
Debugging
If you have problems to detect or monitor the BGP Session you can use the following command to figure out where the problem come from.
snmpwalk -v 2c -c <myCommunity> <myRouter2Monitor> .1.3.6.1.2.1.15.3.1.2.99.99.99.99Replace 99.99.99.99 with your BGP-Peer IP.
The result should be an Integer between 1 and 6.
5.6.6. BSFMonitor
This monitor runs a Bean Scripting Framework BSF compatible script to determine the status of a service. Users can write scripts to perform highly custom service checks. This monitor is not optimised for scale. It’s intended for a small number of custom checks or prototyping of monitors.
BSFMonitor vs SystemExecuteMonitor
The BSFMonitor avoids the overhead of fork(2) that is used by the SystemExecuteMonitor. BSFMonitor also grants access to a selection of OpenNMS Horizon internal methods and classes that can be used in the script.
Monitor facts
Class Name |
|
Remote Enabled |
false |
Configuration and Usage
| Parameter | Description | Required | Default value |
|---|---|---|---|
|
Path to the script file. |
required |
|
|
The BSF Engine to run the script in different languages like |
required |
|
|
one of |
optional |
|
|
The BSF language class, like |
optional |
file-name extension is interpreted by default |
|
comma-separated list |
optional |
|
This monitor implements the Common Configuration Parameters.
| Variable | Type | Description |
|---|---|---|
|
Map<String, Object> |
The map contains all various parameters passed to the monitor
from the service definition it the |
|
String |
The IP address that is currently being polled. |
|
int |
The Node ID of the node the |
|
String |
The Node Label of the node the |
|
String |
The name of the service that is being polled. |
|
BSFMonitor |
The instance of the BSFMonitor object calling the script. Useful for logging via its log(String sev, String fmt, Object... args) method. |
|
HashMap<String, String> |
The script is expected to put its results into this object.
The status indication should be set into the entry with key |
|
LinkedHashMap<String, Number> |
The script is expected to put one or more response times into this object. |
Additionally every parameter added to the service definition in poller-configuration.xml is available as a String object in the script.
The key attribute of the parameter represents the name of the String object and the value attribute represents the value of the String object.
| Please keep in mind, that these parameters are also accessible via the map bean. |
| Avoid non-character names for parameters to avoid problems in the script languages. |
Response Codes
The script has to provide a status code that represents the status of the associated service. The following status codes are defined:
| Code | Description |
|---|---|
OK |
Service is available |
UNK |
Service status unknown |
UNR |
Service is unresponsive |
NOK |
Service is unavailable |
Response time tracking
By default the BSFMonitor tracks the whole time the script file consumes as the response time. If the response time should be persisted the response time add the following parameters:
poller-configuration.xml<!-- where in the filesystem response times are stored -->
<parameter key="rrd-repository" value="/opt/opennms/share/rrd/response" />
<!-- name of the rrd file -->
<parameter key="rrd-base-name" value="minimalbshbase" />
<!-- name of the data source in the rrd file -->
<!-- by default "response-time" is used as ds-name -->
<parameter key="ds-name" value="myResponseTime" />It is also possible to return one or many response times directly from the script.
To add custom response times or override the default one, add entries to the times object.
The entries are keyed with a String that names the datasource and have as values a number that represents the response time.
To override the default response time datasource add an entry into times named response-time.
Timeout and Retry
The BSFMonitor does not perform any timeout or retry processing on its own. If retry and or timeout behaviour is required, it has to be implemented in the script itself.
Requirements for the script (run-types)
Depending on the run-type the script has to provide its results in different ways.
For minimal scripts with very simple logic run-type eval is the simple option.
Scripts running in eval mode have to return a String matching one of the status codes.
If your script is more than a one-liner, run-type exec is essentially required.
Scripts running in exec mode need not return anything, but they have to add a status entry with a status code to the results object.
Additionally, the results object can also carry a "reason":"message" entry that is used in non OK states.
Commonly used language settings
The BSF supports many languages, the following table provides the required setup for commonly used languages.
| Language | lang-class | bsf-engine | required library |
|---|---|---|---|
beanshell |
|
supported by default |
|
groovy |
|
groovy-all-[version].jar |
|
jython |
|
jython-[version].jar |
Example Bean Shell
poller-configuration.xml<service name="MinimalBeanShell" interval="300000" user-defined="true" status="on">
<parameter key="file-name" value="/tmp/MinimalBeanShell.bsh"/>
<parameter key="bsf-engine" value="bsh.util.BeanShellBSFEngine"/>
</service>
<monitor service="MinimalBeanShell" class-name="org.opennms.netmgt.poller.monitors.BSFMonitor" />MinimalBeanShell.bsh script filebsf_monitor.log("ERROR", "Starting MinimalBeanShell.bsf", null);
File testFile = new File("/tmp/TestFile");
if (testFile.exists()) {
return "OK";
} else {
results.put("reason", "file does not exist");
return "NOK";
}Example Groovy
To use the Groovy language an additional library is required.
Copy a compatible groovy-all.jar into to opennms/lib folder and restart OpenNMS Horizon.
That makes Groovy available for the BSFMonitor.
poller-configuration.xml with default run-type set to eval<service name="MinimalGroovy" interval="300000" user-defined="true" status="on">
<parameter key="file-name" value="/tmp/MinimalGroovy.groovy"/>
<parameter key="bsf-engine" value="org.codehaus.groovy.bsf.GroovyEngine"/>
</service>
<monitor service="MinimalGroovy" class-name="org.opennms.netmgt.poller.monitors.BSFMonitor" />MinimalGroovy.groovy script file for run-type evalbsf_monitor.log("ERROR", "Starting MinimalGroovy.groovy", null);
File testFile = new File("/tmp/TestFile");
if (testFile.exists()) {
return "OK";
} else {
results.put("reason", "file does not exist");
return "NOK";
}poller-configuration.xml with run-type set to exec<service name="MinimalGroovy" interval="300000" user-defined="true" status="on">
<parameter key="file-name" value="/tmp/MinimalGroovy.groovy"/>
<parameter key="bsf-engine" value="org.codehaus.groovy.bsf.GroovyEngine"/>
<parameter key="run-type" value="exec"/>
</service>
<monitor service="MinimalGroovy" class-name="org.opennms.netmgt.poller.monitors.BSFMonitor" />MinimalGroovy.groovy script file for run-type set to execbsf_monitor.log("ERROR", "Starting MinimalGroovy", null);
def testFile = new File("/tmp/TestFile");
if (testFile.exists()) {
results.put("status", "OK")
} else {
results.put("reason", "file does not exist");
results.put("status", "NOK");
}Example Jython
To use the Jython (Java implementation of Python) language an additional library is required.
Copy a compatible jython-x.y.z.jar into the opennms/lib folder and restart OpenNMS Horizon.
That makes Jython available for the BSFMonitor.
poller-configuration.xml with run-type exec<service name="MinimalJython" interval="300000" user-defined="true" status="on">
<parameter key="file-name" value="/tmp/MinimalJython.py"/>
<parameter key="bsf-engine" value="org.apache.bsf.engines.jython.JythonEngine"/>
<parameter key="run-type" value="exec"/>
</service>
<monitor service="MinimalJython" class-name="org.opennms.netmgt.poller.monitors.BSFMonitor" />MinimalJython.py script file for run-type set to execfrom java.io import File
bsf_monitor.log("ERROR", "Starting MinimalJython.py", None);
if (File("/tmp/TestFile").exists()):
results.put("status", "OK")
else:
results.put("reason", "file does not exist")
results.put("status", "NOK")
We have to use run-type exec here because Jython chokes on the import keyword in eval mode.
|
| As proof that this is really Python, notice the substitution of Python’s None value for Java’s null in the log call. |
Advanced examples
The following example references all beans that are exposed to the script, including a custom parameter.
poller-configuration.xml<service name="MinimalGroovy" interval="30000" user-defined="true" status="on">
<parameter key="file-name" value="/tmp/MinimalGroovy.groovy"/>
<parameter key="bsf-engine" value="org.codehaus.groovy.bsf.GroovyEngine"/>
<!-- custom parameters (passed to the script) -->
<parameter key="myParameter" value="Hello Groovy" />
<!-- optional for response time tracking -->
<parameter key="rrd-repository" value="/opt/opennms/share/rrd/response" />
<parameter key="rrd-base-name" value="minimalgroovybase" />
<parameter key="ds-name" value="minimalgroovyds" />
</service>
<monitor service="MinimalGroovy" class-name="org.opennms.netmgt.poller.monitors.BSFMonitor" />bsf_monitor.log("ERROR", "Starting MinimalGroovy", null);
//list of all available objects from the BSFMonitor
Map<String, Object> map = map;
bsf_monitor.log("ERROR", "---- map ----", null);
bsf_monitor.log("ERROR", map.toString(), null);
String ip_addr = ip_addr;
bsf_monitor.log("ERROR", "---- ip_addr ----", null);
bsf_monitor.log("ERROR", ip_addr, null);
int node_id = node_id;
bsf_monitor.log("ERROR", "---- node_id ----", null);
bsf_monitor.log("ERROR", node_id.toString(), null);
String node_label = node_label;
bsf_monitor.log("ERROR", "---- node_label ----", null);
bsf_monitor.log("ERROR", node_label, null);
String svc_name = svc_name;
bsf_monitor.log("ERROR", "---- svc_name ----", null);
bsf_monitor.log("ERROR", svc_name, null);
org.opennms.netmgt.poller.monitors.BSFMonitor bsf_monitor = bsf_monitor;
bsf_monitor.log("ERROR", "---- bsf_monitor ----", null);
bsf_monitor.log("ERROR", bsf_monitor.toString(), null);
HashMap<String, String> results = results;
bsf_monitor.log("ERROR", "---- results ----", null);
bsf_monitor.log("ERROR", results.toString(), null);
LinkedHashMap<String, Number> times = times;
bsf_monitor.log("ERROR", "---- times ----", null);
bsf_monitor.log("ERROR", times.toString(), null);
// reading a parameter from the service definition
String myParameter = myParameter;
bsf_monitor.log("ERROR", "---- myParameter ----", null);
bsf_monitor.log("ERROR", myParameter, null);
// minimal example
def testFile = new File("/tmp/TestFile");
if (testFile.exists()) {
bsf_monitor.log("ERROR", "Done MinimalGroovy ---- OK ----", null);
return "OK";
} else {
results.put("reason", "file does not exist");
bsf_monitor.log("ERROR", "Done MinimalGroovy ---- NOK ----", null);
return "NOK";
}5.6.7. CiscoIpSlaMonitor
This monitor can be used to monitor IP SLA configurations on your Cisco devices. This monitor supports the following SNMP OIDS from CISCO-RTT-MON-MIB:
RTT_ADMIN_TAG_OID = .1.3.6.1.4.1.9.9.42.1.2.1.1.3
RTT_OPER_STATE_OID = .1.3.6.1.4.1.9.9.42.1.2.9.1.10
RTT_LATEST_OPERSENSE_OID = .1.3.6.1.4.1.9.9.42.1.2.10.1.2
RTT_ADMIN_THRESH_OID = .1.3.6.1.4.1.9.9.42.1.2.1.1.5
RTT_ADMIN_TYPE_OID = .1.3.6.1.4.1.9.9.42.1.2.1.1.4
RTT_LATEST_OID = .1.3.6.1.4.1.9.9.42.1.2.10.1.1
The monitor can be run in two scenarios. The first one tests the RTT_LATEST_OPERSENSE which is a sense code for the completion status of the latest RTT operation. If the RTT_LATEST_OPERSENSE returns ok(1) the service is marked as up.
The second scenario is to monitor the configured threshold in the IP SLA config. If the RTT_LATEST_OPERSENSE returns with overThreshold(3) the service is marked down.
Monitor facts
Class Name |
|
Remote Enabled |
false |
Configuration and Usage
| Parameter | Description | Required | Default value |
|---|---|---|---|
|
The |
required |
|
|
Boolean indicates if just the status or configured threshold should be monitored. |
required |
`` |
This monitor implements the Common Configuration Parameters.
Example for HTTP and ICMP echo reply
In this example we configure an IP SLA entry to monitor Google’s website with HTTP GET from the Cisco device.
We use 8.8.8.8 as our DNS resolver.
In our example our SLA says we should reach Google’s website within 200ms.
To advise co-workers that this monitor entry is used for monitoring, I set the owner to OpenNMS.
The tag is used to identify the entry later in the SNMP table for monitoring.
ip sla monitor 1
 type http operation get url http://www.google.de name-server 8.8.8.8
 timeout 3000
 threshold 200
 owner OpenNMS
 tag Google Website
ip sla monitor schedule 3 life forever start-time now
In the second example we configure a IP SLA to test if the IP address from www.opennms.org is reachable with ICMP from the perspective of the Cisco device. Like the example above we have a threshold and a timeout.
ip sla 1
 icmp-echo 64.146.64.212
 timeout 3000
 threshold 150
 owner OpenNMS
 tag OpenNMS Host
ip sla schedule 1 life forever start-time now| It´s not possible to reconfigure an IP SLA entry. If you want to change parameters, you have to delete the whole configuration and reconfigure it with your new parameters. Backup your Cisco configuration manually or take a look at RANCID. |
To monitor both of the entries the configuration in poller-configuration.xml requires two service definition entries:
<service name="IP-SLA-WEB-Google" interval="300000"
  user-defined="false" status="on">
    <parameter key="retry" value="2" />
    <parameter key="timeout" value="3000" />
    <parameter key="admin-tag" value="Google Website" />
    <parameter key="ignore-thresh" value="false" />(1)
</service>
<service name="IP-SLA-PING-OpenNMS" interval="300000"
  user-defined="false" status="on">
    <parameter key="retry" value="2" />
    <parameter key="timeout" value="3000" />
    <parameter key="admin-tag" value="OpenNMS Host" />
    <parameter key="ignore-thresh" value="true" />(2)
</service>

<monitor service="IP-SLA-WEB-Google" class-name="org.opennms.netmgt.poller.monitors.CiscoIpSlaMonitor" />
<monitor service="IP-SLA-PING-OpenNMS" class-name="org.opennms.netmgt.poller.monitors.CiscoIpSlaMonitor" />| 1 | Service is up if the IP SLA state is ok(1) |
| 2 | Service is down if the IP SLA state is overThreshold(3) |
5.6.8. CiscoPingMibMonitor
This poller monitor’s purpose is to create conceptual rows (entries) in the ciscoPingTable on Cisco IOS devices that support the CISCO-PING-MIB. These entries direct the remote IOS device to ping an IPv4 or IPv6 address with a configurable set of parameters. After the IOS device has completed the requested ping operations, the poller monitor queries the IOS device to determine the results. If the results indicate success according to the configured parameters in the service configuration, then the monitored service is reported as available and the results are available for optional time-series (RRD) storage. If the results indicate failure, the monitored service is reported unavailable with a descriptive reason code. If something goes wrong during the setup of the entry or the subsequent querying of its status, the monitored service is reported to be in an unknown state.
Unlike most poller monitors, the CiscoPingMibMonitor does not interpret the timeout and retries parameters to determine when a poll attempt has timed out or whether it should be attempted again.
The packet-count and packet-timeout parameters instead service this purpose from the perspective of the remote IOS device.
|
 ciscoPingEntry             1.3.6.1.4.1.9.9.16.1.1.1
 ciscoPingSerialNumber      1.3.6.1.4.1.9.9.16.1.1.1.1
 ciscoPingProtocol          1.3.6.1.4.1.9.9.16.1.1.1.2
 ciscoPingAddress           1.3.6.1.4.1.9.9.16.1.1.1.3
 ciscoPingPacketCount       1.3.6.1.4.1.9.9.16.1.1.1.4
 ciscoPingPacketSize        1.3.6.1.4.1.9.9.16.1.1.1.5
 ciscoPingPacketTimeout     1.3.6.1.4.1.9.9.16.1.1.1.6
 ciscoPingDelay             1.3.6.1.4.1.9.9.16.1.1.1.7
 ciscoPingTrapOnCompletion  1.3.6.1.4.1.9.9.16.1.1.1.8
 ciscoPingSentPackets       1.3.6.1.4.1.9.9.16.1.1.1.9
 ciscoPingReceivedPackets   1.3.6.1.4.1.9.9.16.1.1.1.10
 ciscoPingMinRtt            1.3.6.1.4.1.9.9.16.1.1.1.11
 ciscoPingAvgRtt            1.3.6.1.4.1.9.9.16.1.1.1.12
 ciscoPingMaxRtt            1.3.6.1.4.1.9.9.16.1.1.1.13
 ciscoPingCompleted         1.3.6.1.4.1.9.9.16.1.1.1.14
 ciscoPingEntryOwner        1.3.6.1.4.1.9.9.16.1.1.1.15
 ciscoPingEntryStatus       1.3.6.1.4.1.9.9.16.1.1.1.16
 ciscoPingVrfName           1.3.6.1.4.1.9.9.16.1.1.1.17
Prerequisites
-
One or more Cisco devices running an IOS image of recent vintage; any 12.2 or later image is probably fine. Even very low-end devices appear to support the CISCO-PING-MIB.
-
The IOS devices that will perform the remote pings must be configured with an SNMP write community string whose source address access-list includes the address of the OpenNMS Horizon server and whose MIB view (if any) includes the OID of the ciscoPingTable.
-
The corresponding SNMP write community string must be specified in the
write-communityattribute of either the top-level<snmp-config>element ofsnmp-config.xmlor a<definition>child element that applies to the SNMP-primary interface of the IOS device(s) that will perform the remote pings.
Scalability concerns
This monitor spends a fair amount of time sleeping while it waits for the remote IOS device to complete the requested ping operations.
The monitor is pessimistic in calculating the delay between creation of the ciscoPingTable entry and its first attempt to retrieve the results of that entry’s ping operations — it will always wait at least (packet-count * (packet-timeout + packet-delay)) milliseconds before even checking whether the remote pings have completed.
It’s therefore prone to hogging poller threads if used with large values for the packet-count, packet-timeout, and/or packet-delay parameters.
Keep these values as small as practical to avoid tying up poller threads unnecessarily.
This monitor always uses the current time in whole seconds since the UNIX epoch as the instance identifier of the ciscoPingTable entries that it creates. The object that holds this identifier is a signed 32-bit integer type, precluding a finer resolution. It’s probably a good idea to mix in the least-significant byte of the millisecond-accurate time as a substitute for that of the whole-second-accurate value to avoid collisions. IOS seems to clean up entries in this table within a manner of minutes after their ping operations have completed.
Monitor facts
Class Name |
|
Remote Enabled |
false |
Configuration and Usage
| Parameter | Description | Required | Default value |
|---|---|---|---|
|
SNMP protocol version (1, 2c, or 3) to use for operations performed by this service monitor. Do not use with out a very good reason to do so. |
optional |
from |
|
Number of ping packets that the remote IOS device should send. |
optional |
|
|
Size, in bytes, of each ping packet that the remote IOS device should send. |
optional |
|
|
Timeout, in milliseconds, of each ping packet sent by the remote IOS device. |
optional |
|
|
Delay, in milliseconds, between ping packets sent by the remote IOS device. |
optional |
|
|
String value to set as the value of ciscoPingEntryOwner of entries created for this service. |
optional |
|
|
String value to set as the VRF (VLAN) name in whose context the remote IOS device should perform the pings for this service. |
optional |
empty String |
|
Numeric database identifier of the node whose primary SNMP interface should be used
as the proxy for this service. If specified along with the related
|
optional |
|
|
|
optional |
|
|
IP address of the interface that should be used as the proxy for this service.
Effective only if none of |
optional |
|
|
IP address that the remote IOS device should ping. A value of |
optional |
|
|
A whole-number percentage of pings that must succeed (from the perspective of the
remote IOS device) in order for this service to be considered available. As an
example, if |
optional |
|
|
Base directory of an RRD repository in which to store this service monitor’s response-time samples |
optional |
|
|
Name of the RRD datasource (DS) name in which to store this service monitor’s
response-time samples; rrd-base-name Base name of the RRD file (minus the |
optional |
|
This monitor implements the Common Configuration Parameters.
This is optional just if you can use variables in the configuration.
| Variable | Description |
|---|---|
|
This value will be substituted with the IP address of the interface on which the monitored service appears. |
Example: Ping the same non-routable address from all routers of customer Foo
A service provider’s client, Foo Corporation, has network service at multiple locations. At each Foo location, a point-of-sale system is statically configured at IPv4 address 192.168.255.1. Foo wants to be notified any time a point-of-sale system becomes unreachable. Using an OpenNMS Horizon remote location monitor is not feasible. All of Foo Corporation’s CPE routers must be Cisco IOS devices in order to achieve full coverage in this scenario.
One approach to this requirement is to configure all of Foo Corporation’s premise routers to be in the surveillance categories Customer_Foo, CPE, and Routers, and to use a filter to create a poller package that applies only to those routers.
We will use the special value ${ipaddr} for the proxy-ip-addr parameter so that the remote pings will be provisioned on each Foo CPE router.
Since we want each Foo CPE router to ping the same IP address 192.168.255.1, we statically list that value for the target-ip-addr address.
<package name="ciscoping-foo-pos">
  <filter>catincCustomer_Foo & catincCPE & catincRouters & nodeSysOID LIKE '.1.3.6.1.4.1.9.%'</filter>
  <include-range begin="0.0.0.0" end="254.254.254.254" />
  <rrd step="300">
    <rra>RRA:AVERAGE:0.5:1:2016</rra>
    <rra>RRA:AVERAGE:0.5:12:1488</rra>
    <rra>RRA:AVERAGE:0.5:288:366</rra>
    <rra>RRA:MAX:0.5:288:366</rra>
    <rra>RRA:MIN:0.5:288:366</rra>
  </rrd>
  <service name="FooPOS" interval="300000" user-defined="false" status="on">
    <parameter key="rrd-repository" value="/opt/opennms/share/rrd/response" />
    <parameter key="rrd-base-name" value="ciscoping" />
    <parameter key="ds-name" value="ciscoping" />
    <parameter key="proxy-ip-addr" value="${ipaddr}" />
    <parameter key="target-ip-addr" value="192.168.255.1" />
  </service>
  <downtime interval="30000" begin="0" end="300000" /><!-- 30s, 0, 5m -->
  <downtime interval="300000" begin="300000" end="43200000" /><!-- 5m, 5m, 12h -->
  <downtime interval="600000" begin="43200000" end="432000000" /><!-- 10m, 12h, 5d -->
  <downtime begin="432000000" delete="true" /><!-- anything after 5 days delete -->
</package>

<monitor service="FooPOS" class-name="org.opennms.netmgt.poller.monitors.CiscoPingMibMonitor" />
Example: Ping from a single IOS device routable address of each router of customer Bar
A service provider’s client, Bar Limited, has network service at multiple locations. While OpenNMS Horizon' world-class service assurance is generally sufficient, Bar also wants to be notified any time a premise router at one of their locations unreachable from the perspective of an IOS device in Bar’s main data center. Some or all of the Bar Limited CPE routers may be non-Cisco devices in this scenario.
To meet this requirement, our approach is to configure Bar Limited’s premise routers to be in the surveillance categories Customer_Bar, CPE, and Routers, and to use a filter to create a poller package that applies only to those routers.
This time, though, we will use the special value ${ipaddr} not in the proxy-ip-addr parameter but in the target-ip-addr parameter so that the remote pings will be performed for each Bar CPE router.
Since we want the same IOS device 20.11.5.11 to ping the CPE routers, we statically list that value for the proxy-ip-addr address.
Example poller-configuration.xml additions
<package name="ciscoping-bar-cpe">
  <filter>catincCustomer_Bar & catincCPE & catincRouters</filter>
  <include-range begin="0.0.0.0" end="254.254.254.254" />
  <rrd step="300">
    <rra>RRA:AVERAGE:0.5:1:2016</rra>
    <rra>RRA:AVERAGE:0.5:12:1488</rra>
    <rra>RRA:AVERAGE:0.5:288:366</rra>
    <rra>RRA:MAX:0.5:288:366</rra>
    <rra>RRA:MIN:0.5:288:366</rra>
  </rrd>
  <service name="BarCentral" interval="300000" user-defined="false" status="on">
    <parameter key="rrd-repository" value="/opt/opennms/share/rrd/response" />
    <parameter key="rrd-base-name" value="ciscoping" />
    <parameter key="ds-name" value="ciscoping" />
    <parameter key="proxy-ip-addr" value="20.11.5.11" />
    <parameter key="target-ip-addr" value="${ipaddr}" />
  </service>
  <downtime interval="30000" begin="0" end="300000" /><!-- 30s, 0, 5m -->
  <downtime interval="300000" begin="300000" end="43200000" /><!-- 5m, 5m, 12h -->
  <downtime interval="600000" begin="43200000" end="432000000" /><!-- 10m, 12h, 5d -->
  <downtime begin="432000000" delete="true" /><!-- anything after 5 days delete -->
</package>

<monitor service="BarCentral" class-name="org.opennms.netmgt.poller.monitors.CiscoPingMibMonitor" />
5.6.9. CitrixMonitor
This monitor is used to test if a Citrix® Server or XenApp Server® is providing the Independent Computing Architecture (ICA) protocol on TCP 1494.
The monitor opens a TCP socket and tests the greeting banner returns with ICA, otherwise the service is unavailable.
Monitor facts
Class Name |
|
Remote Enabled |
true |
Configuration and Usage
| Parameter | Description | Required | Default value |
|---|---|---|---|
|
TCP port where the ICA protocol is listening. |
optional |
|
This monitor implements the Common Configuration Parameters.
| If you have configure the Metaframe Presentation Server Client using Session Reliability, the TCP port is 2598 instead of 1494. You can find additional information on CTX104147. It is not verified if the monitor works in this case. |
Examples
The following example configures OpenNMS Horizon to monitor the ICA protocol on TCP 1494 with 2 retries and waiting 5 seconds for each retry.
<service name="Citrix-TCP-ICA" interval="300000" user-defined="false" status="on">
    <parameter key="retry" value="2" />
    <parameter key="timeout" value="5000" />
</service>

<monitor service="Citrix-TCP-ICA" class-name="org.opennms.netmgt.poller.monitors.CitrixMonitor" />
5.6.10. DhcpMonitor
This monitor is used to check the availability and functionality of DHCP servers.
The monitor class DhcpMonitor is executed by Pollerd and opens the background process listening for incoming DHCP responses.
A DHCP server is tested by sending a DISCOVER message.
If the DHCP server responds with an OFFER the service is marked as up.
The background listening process is only started if the DhcpMonitor is used.
The behavior for testing the DHCP server can be modified in the poller-configuration.xml configuration file.
Make sure no DHCP client is running on the OpenNMS Horizon server and using port UDP/67 and UDP/68.
If UDP/67 and UDP/68 are already in use, you will find warning messages in your log files.
You can test if a process is listening on UDP/68 with sudo ss -lnpu sport = :68.
|
Monitor facts
Class Name |
|
Remote Enabled |
true |
This monitor implements the Common Configuration Parameters.
DhcpMonitor configuration
Parameter |
Description |
Required |
Default value |
|
The MAC address which OpenNMS Horizon uses for a dhcp request |
optional |
|
|
Puts the poller in |
optional |
|
|
This parameter will usually be set to the IP address of the OpenNMS Horizon server,
if |
optional |
|
|
When extendedMode is false, the DHCP poller will send a DISCOVER and expect an OFFER in return. When extendedMode is true, the DHCP poller will first send a DISCOVER. If no valid response is received it will send an INFORM. If no valid response is received it will then send a REQUEST. OFFER, ACK, and NAK are all considered valid responses in extendedMode. |
optional |
|
|
This parameter only applies to REQUEST queries sent to the DHCP server when extendedMode is true. The IP address specified will be requested in the query. |
optional |
|
|
The location to write RRD data. Generally, you will not want to change this from default |
required |
|
|
The name of the RRD file to write (minus the extension, .rrd or .jrb) |
required |
|
|
This is the name as reference for this particular data source in the RRD file |
required |
|
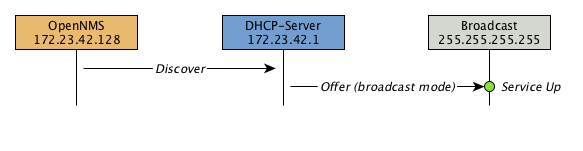
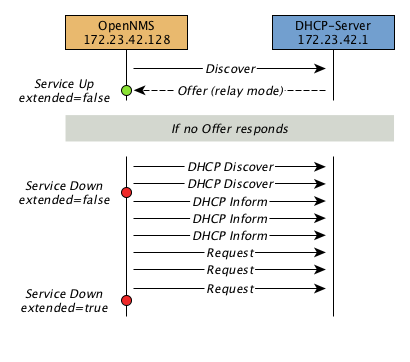
Example testing DHCP server in the same subnet
Example configuration how to configure the monitor in the poller-configuration.xml.
The monitor will try to send in maximum 3 DISCOVER messages and waits 3 seconds for the DHCP server OFFER message.
poller-configuration.xml<service name="DHCP" interval="300000" user-defined="false" status="on">
<parameter key="retry" value="2" />
<parameter key="timeout" value="3000" />
<parameter key="relayMode" value="false"/>
<parameter key="extendedMode" value="false"/>
<parameter key="rrd-repository" value="/opt/opennms/share/rrd/response" />
<parameter key="rrd-base-name" value="dhcp" />
<parameter key="ds-name" value="dhcp" />
</service>
<monitor service="DHCP" class-name="org.opennms.netmgt.poller.monitors.DhcpMonitor"/>Example testing DHCP server in a different subnet in extended mode
You can use the same monitor in poller-configuration.xml as in the example above.
myIpAddress.<service name="DHCP" interval="300000" user-defined="false" status="on">
<parameter key="retry" value="2" />
<parameter key="timeout" value="3000" />
<parameter key="relayMode" value="true"/>
<parameter key="extendedMode" value="false"/>
<parameter key="myIpAddress" value="1.2.3.4"/>
<parameter key="rrd-repository" value="/opt/opennms/share/rrd/response" />
<parameter key="rrd-base-name" value="dhcp" />
<parameter key="ds-name" value="dhcp" />
</service>
<monitor service="DHCP" class-name="org.opennms.netmgt.poller.monitors.DhcpMonitor"/>
If in extendedMode, the time required to complete the poll for an unresponsive node is increased by a factor of 3.
Thus it is a good idea to limit the number of retries to a small number.
|
5.6.11. DiskUsageMonitor
The DiskUsageMonitor monitor can be used to test the amount of free space available on certain storages of a node.
The monitor gets information about the available free storage spaces available by inspecting the hrStorageTable of the HOST-RESOURCES-MIB.
A storage’s description (as found in the corresponding hrStorageDescr object) must match the criteria specified by the disk and match-type parameters to be monitored.
A storage’s available free space is calculated using the corresponding hrStorageSize and hrStorageUsed objects.
The hrStorageUsed doesn’t account for filesystem reserved blocks (i.e. for the super-user), so DiskUsageMonitor will report the service as
unavailable only when the amount of free disk space is actually lower than free minus the percentage of reserved filesystem blocks.
|
This monitor uses SNMP to accomplish its work. Therefore systems against which it is to be used must have an SNMP agent supporting the HOST-RESOURCES-MIB installed and configured. Most modern SNMP agents, including most distributions of the Net-SNMP agent and the SNMP service that ships with Microsoft Windows, support this MIB. Out-of-box support for HOST-RESOURCES-MIB among commercial Unix operating systems may be somewhat spotty.
Monitor facts
Class Name |
|
Remote Enabled |
false, relies on SNMP configuration. |
Configuration and Usage
| Parameter | Description | Required | Default value |
|---|---|---|---|
|
A pattern that a storage’s description (hrStorageDescr) must match to be taken into account. |
required |
|
|
The minimum amount of free space that storages matching the criteria must have available. This parameter is evaluated as a percent of the storage’s reported maximum capacity. |
optional |
|
|
The way how the pattern specified by the |
optional |
|
|
Destination port where the SNMP requests shall be sent. |
optional |
|
|
Deprecated.
Same as |
optional |
|
This monitor implements the Common Configuration Parameters.
Examples
<!-- Make sure there's at least 5% of free space available on storages ending with "/home" -->
<service name="DiskUsage-home" interval="300000" user-defined="false" status="on">
  <parameter key="timeout" value="3000" />
  <parameter key="retry" value="2" />
  <parameter key="disk" value="/home" />
  <parameter key="match-type" value="endsWith" />
  <parameter key="free" value="5" />
</service>
<monitor service="DiskUsage-home" class-name="org.opennms.netmgt.poller.monitors.DiskUsageMonitor" />
DiskUsageMonitor vs thresholds
Storages' available free space can also be monitored using thresholds if you are already collecting these data.
5.6.12. DnsMonitor
This monitor is build to test the availability of the DNS service on remote IP interfaces. The monitor tests the service availability by sending a DNS query for A resource record types against the DNS server to test.
The monitor is marked as up if the DNS Server is able to send a valid response to the monitor. For multiple records it is possible to test if the number of responses are within a given boundary.
The monitor can be simulated with the command line tool host:
~ % host -v -t a www.google.com 8.8.8.8
Trying "www.google.com"
Using domain server:
Name: 8.8.8.8
Address: 8.8.8.8#53
Aliases:

;; ->>HEADER<<- opcode: QUERY, status: NOERROR, id: 9324
;; flags: qr rd ra; QUERY: 1, ANSWER: 5, AUTHORITY: 0, ADDITIONAL: 0

;; QUESTION SECTION:
;www.google.com.			IN	A

;; ANSWER SECTION:
www.google.com.		283	IN	A	74.125.232.17
www.google.com.		283	IN	A	74.125.232.20
www.google.com.		283	IN	A	74.125.232.19
www.google.com.		283	IN	A	74.125.232.16
www.google.com.		283	IN	A	74.125.232.18

Received 112 bytes from 8.8.8.8#53 in 41 ms
TIP: This monitor is intended for testing the availability of a DNS service. If you want to monitor the DNS resolution of some of your nodes from a client’s perspective, please use the DNSResolutionMonitor.
Monitor facts
Class Name |
|
Remote Enabled |
true |
Configuration and Usage
| Parameter | Description | Required | Default value |
|---|---|---|---|
|
Number of retries before the service is marked as down |
optional |
|
|
Time in milliseconds to wait for the A Record response from the server |
optional |
|
|
UDP Port for the DNS server |
optional |
|
|
DNS A Record for lookup test |
optional |
|
|
A comma-separated list of numeric DNS response codes that will be considered fatal if
present in the server’s response. Default value is |
optional |
|
|
Minmal number of records in the DNS server respone for the given lookup |
optional |
|
|
Maximal number of records in the DNS server respone for the given lookup |
optional |
|
This monitor implements the Common Configuration Parameters.
Examples
The given examples shows how to monitor if the IP interface from a given DNS server resolves a DNS request.
This service should be bound to a DNS server which should be able to give a valid DNS respone for DNS request www.google.com.
The service is up if the DNS server gives between 1 and 10 A record responses.
<service name="DNS-www.google.com" interval="300000" user-defined="false" status="on">
    <parameter key="lookup" value="www.google.com" />
    <parameter key="fatal-response-code" value="2" />
    <parameter key="min-answers" value="1" />
    <parameter key="max-answers" value="10" />
</service>

<monitor service="DNS-www.google.com" class-name="org.opennms.netmgt.poller.monitors.DnsMonitor" />
5.6.13. DNSResolutionMonitor
The DNS resolution monitor, tests if the node label of an OpenNMS Horizon node can be resolved. This monitor uses the name resolver configuration from the poller configuration or from the operating system where OpenNMS Horizon is running on. It can be used to test a client behavior for a given host name. For example: Create a node with the node label www.google.com and an IP interface. Assigning the DNS resolution monitor on the IP interface will test if www.google.com can be resolved using the DNS configuration defined by the poller. The response from the A record lookup can be any address, it is not verified with the IP address on the OpenNMS Horizon IP interface where the monitor is assigned to. This monitor implements placeholder substitution in parameter values.
Monitor facts
Class Name |
|
Remote Enabled |
true |
Configuration and Usage
| Parameter | Description | Required | Default value | Placeholder substitution |
|---|---|---|---|---|
|
Type of record for the node label test. |
optional |
|
No |
|
Alternate DNS record types to search for. |
optional |
`` |
No |
|
Alternate DNS record to lookup |
optional |
The node label. |
Yes |
|
The DNS server to query for the records. |
optional |
Use name server from host system running OpenNMS Horizon |
Yes |
This monitor implements the Common Configuration Parameters.
Examples
The following example shows the possibilities monitoring IPv4 and/or IPv6 for the service configuration:
<!-- Assigned service test if the node label is resolved for an A record -->
<service name="DNS-Resolution-v4" interval="300000" user-defined="false" status="on">
    <parameter key="retry" value="2"/>
    <parameter key="timeout" value="2000"/>
    <parameter key="resolution-type" value="v4"/>
    <parameter key="rrd-repository" value="/opt/opennms/share/rrd/response"/>
    <parameter key="rrd-base-name" value="dns-res-v4"/>
    <parameter key="ds-name" value="dns-res-v4"/>
</service>

<!-- Assigned service test if www.google.com is resolved for an A record -->
<service name="DNS-Resolution-v4-lookup" interval="300000" user-defined="false" status="on">
    <parameter key="retry" value="2"/>
    <parameter key="timeout" value="2000"/>
    <parameter key="resolution-type" value="v4"/>
    <parameter key="lookup" value="www.google.com"/>
</service>

<!-- Assigned service test if the node label is resolved for an AAAA record using a specific DNS server -->
<service name="DNS-Resolution-v6" interval="300000" user-defined="false" status="on">
    <parameter key="retry" value="2"/>
    <parameter key="timeout" value="2000"/>
    <parameter key="resolution-type" value="v6"/>
    <parameter key="rrd-repository" value="/opt/opennms/share/rrd/response"/>
    <parameter key="rrd-base-name" value="dns-res-v6"/>
    <parameter key="ds-name" value="dns-res-v6"/>
    <parameter key="nameserver" value="8.8.8.8"/>
</service>

<!-- Use parameter substitution for nameserver and lookup parameter values -->
<service name="DNS-Resolution-Sub" interval="300000" user-defined="false" status="on">
    <parameter key="retry" value="2"/>
    <parameter key="timeout" value="2000"/>
    <parameter key="resolution-type" value="v6"/>
    <parameter key="rrd-repository" value="/opt/opennms/share/rrd/response"/>
    <parameter key="rrd-base-name" value="dns-res-v6"/>
    <parameter key="ds-name" value="dns-res-v6"/>
    <parameter key="nameserver" value="{ipAddr}"/>
    <parameter key="lookup" value="{nodeLabel}"/>
</service>

<!-- Assigned service test if the node label is resolved for an AAAA record AND A record -->
<service name="DNS-Resolution-v4-and-v6" interval="300000" user-defined="false" status="on">
    <parameter key="retry" value="2"/>
    <parameter key="timeout" value="2000"/>
    <parameter key="resolution-type" value="both"/>
    <parameter key="rrd-repository" value="/opt/opennms/share/rrd/response"/>
    <parameter key="rrd-base-name" value="dns-res-both"/>
    <parameter key="ds-name" value="dns-res-both"/>
</service>

<!-- Assigned service test if the node label is resolved for an AAAA record OR A record -->
<service name="DNS-Resolution-v4-or-v6" interval="300000" user-defined="false" status="on">
    <parameter key="retry" value="2"/>
    <parameter key="timeout" value="2000"/>
    <parameter key="resolution-type" value="either"/>
    <parameter key="rrd-repository" value="/opt/opennms/share/rrd/response"/>
    <parameter key="rrd-base-name" value="dns-res-either"/>
    <parameter key="ds-name" value="dns-res-either"/>
</service>

<!-- Assigned service test if the node label is resolved for an CNAME record AND MX record -->
<service name="DNS-Resolution-CNAME-and-MX" interval="300000" user-defined="false" status="on">
    <parameter key="retry" value="2"/>
    <parameter key="timeout" value="2000"/>
    <parameter key="record-types" value="CNAME,MX"/>
    <parameter key="lookup" value="www.google.comm"/>
    <parameter key="rrd-repository" value="/opt/opennms/share/rrd/response"/>
    <parameter key="rrd-base-name" value="dns-res-cname-mx"/>
    <parameter key="ds-name" value="dns-res-cname-mx"/>
</service>

<monitor service="DNS-Resolution-v4" class-name="org.opennms.netmgt.poller.monitors.DNSResolutionMonitor" />
<monitor service="DNS-Resolution-v4-lookup" class-name="org.opennms.netmgt.poller.monitors.DNSResolutionMonitor" />
<monitor service="DNS-Resolution-v6" class-name="org.opennms.netmgt.poller.monitors.DNSResolutionMonitor" />
<monitor service="DNS-Resolution-Sub" class-name="org.opennms.netmgt.poller.monitors.DNSResolutionMonitor" />
<monitor service="DNS-Resolution-v4-and-v6" class-name="org.opennms.netmgt.poller.monitors.DNSResolutionMonitor" />
<monitor service="DNS-Resolution-v4-or-v6" class-name="org.opennms.netmgt.poller.monitors.DNSResolutionMonitor" />
<monitor service="DNS-Resolution-CNAME-and-MX" class-name="org.opennms.netmgt.poller.monitors.DNSResolutionMonitor" />
To have response time graphs for the name resolution you have to configure RRD graphs for the given ds-names (dns-res-v4, dns-res-v6, dns-res-both, dns-res-either, dns-res-cname-mx) in '$OPENNMS_HOME/etc/response-graph.properties'.
DNSResolutionMonitor vs DnsMonitor
The DNSResolutionMonitor is used to measure the availability and record outages of a name resolution from client perspective. The service is mainly used for websites or similar public available resources. It can be used in combination with the Page Sequence Monitor to give a hint if a website isn’t available for DNS reasons.
The DnsMonitor on the other hand is a test against a specific DNS server. In OpenNMS Horizon the DNS server is the node and the DnsMonitor will send a lookup request for a given A record to the DNS server IP address. The service goes down if the DNS server doesn’t have a valid A record in his zone database or as some other issues resolving A records.
5.6.14. FtpMonitor
The FtpMonitor is able to validate ftp connection dial-up processes. The monitor can test ftp server on multiple ports and specific login data.
The service using the FtpMonitor is up if the FTP server responds with return codes between 200 and 299. For special cases the service is also marked as up for 425 and 530.
This monitor implements placeholder substitution in parameter values.
Monitor facts
Class Name |
|
Remote Enabled |
|
Configuration and Usage
| Parameter | Description | Required | Default value | Placeholder substitution |
|---|---|---|---|---|
|
Number of attempts to get a valid FTP response/response-text |
optional |
|
No |
|
A list of TCP ports to which connection shall be tried. |
optional |
|
No |
|
This parameter is meant to be used together with the |
optional |
|
Yes |
|
This parameter is meant to be used together with the |
optional |
|
Yes |
This monitor implements the Common Configuration Parameters.
Examples
Some example configuration how to configure the monitor in the 'poller-configuration.xml'
<service name="FTP" interval="300000" user-defined="false" status="on">
 <parameter key="retry" value="1"/>
 <parameter key="timeout" value="3000"/>
 <parameter key="port" value="21"/>
 <parameter key="userid" value=""/>
 <parameter key="password" value=""/>
</service>

<service name="FTP-With-Auth-From-Asset" interval="300000" user-defined="false" status="on">
 <parameter key="retry" value="1"/>
 <parameter key="timeout" value="3000"/>
 <parameter key="port" value="21"/>
 <parameter key="userid" value="{username}"/>
 <parameter key="password" value="{password}"/>
</service>

<service name="FTP-Customer" interval="300000" user-defined="false" status="on">
 <parameter key="retry" value="1"/>
 <parameter key="timeout" value="3000"/>
 <parameter key="port" value="21"/>
 <parameter key="userid" value="Customer"/>
 <parameter key="password" value="MySecretPassword"/>
</service>

<monitor service="FTP" class-name="org.opennms.netmgt.poller.monitors.FtpMonitor"/>
<monitor service="FTP-With-Auth-From-Asset" class-name="org.opennms.netmgt.poller.monitors.FtpMonitor"/>
<monitor service="FTP-Customer" class-name="org.opennms.netmgt.poller.monitors.FtpMonitor"/>
Hint
Comment from FtpMonitor source
Also want to accept the following ERROR message generated by some FTP servers following a QUIT command without a previous successful login: "530 QUIT : User not logged in. Please login with USER and PASS first."
Also want to accept the following ERROR message generated by some FTP servers following a QUIT command without a previously successful login: "425 Session is disconnected."
See also: http://tools.ietf.org/html/rfc959
5.6.15. HostResourceSwRunMonitor
This monitor test the running state of one or more processes. It does this via SNMP by inspecting the hrSwRunTable of the HOST-RESOURCES-MIB. The test is done by matching a given process as hrSwRunName against the numeric value of the hrSwRunState.
This monitor uses SNMP to accomplish its work. Therefore systems against which it is to be used must have an SNMP agent installed and configured. Furthermore, the SNMP agent on the system must support the HOST-RESOURCES-MIB. Most modern SNMP agents, including most distributions of the Net-SNMP agent and the SNMP service that ships with Microsoft Windows, support this MIB. Out-of-box support for HOST-RESOURCES-MIB among commercial Unix operating systems may be somewhat spotty.
Monitor facts
Class Name |
|
Remote Enabled |
false |
Configuration and Usage
| Parameter | Description | Required | Default value |
|---|---|---|---|
|
The port of the SNMP agent of the server to test. |
optional |
|
|
The name of the process to be monitored. This parameter’s value is case-sensitive and is evaluated as an exact match. |
required |
|
|
If the process name appears multiple times in the hrSwRunTable, and this parameter is set to
|
optional |
|
|
The maximum allowable value of hrSWRunStatus among |
optional |
|
|
The numeric object identifier (OID) from which process names are queried. Defaults to
hrSwRunName and should never be changed under normal
circumstances. That said, changing it to hrSwRunParameters ( |
optional |
|
|
The numeric object identifier (OID) from which run status is queried. Defaults to hrSwRunStatus and should never be changed under normal circumstances. |
optional |
|
This monitor implements the Common Configuration Parameters.
Examples
The following example shows how to monitor the process called httpd running on a server using this monitor.
The configuration in poller-configuration.xml has to be defined as the following:
<service name="Process-httpd" interval="300000" user-defined="false" status="on">
    <parameter key="retry" value="3"/>
    <parameter key="timeout" value="3000"/>
    <parameter key="service-name" value="httpd"/>(1)
    <parameter key="run-level" value="3"/>(2)
    <parameter key="match-all" value="true"/>(3)
</service>

<monitor service="Process-httpd" class-name="org.opennms.netmgt.poller.monitors.HostResourceSwRunMonitor"/>| 1 | Name of the process on the system |
| 2 | Test the state if the process is in a valid state, i.e. have a run-level no higher than notRunnable(3) |
| 3 | If the httpd process runs multiple times the test is done for each instance of the process. |
5.6.16. HttpMonitor
The HTTP monitor tests the response of an HTTP server on a specific HTTP 'GET' command. During the poll, an attempt is made to connect on the specified port(s). The monitor can test web server on multiple ports. By default the test is made against port 80, 8080 and 8888. If the connection request is successful, an HTTP 'GET' command is sent to the interface. The response is parsed and a return code extracted and verified. This monitor implements placeholder substitution in parameter values.
Monitor facts
Class Name |
|
Remote Enabled |
true |
Configuration and Usage
| Parameter | Description | Required | Default value | Placeholder substitution |
|---|---|---|---|---|
|
Authentication credentials to perform basic authentication. |
optional |
|
Yes |
|
Additional headers to be sent along with the request. |
optional |
|
No |
|
Specify the Host header’s value. |
optional |
|
No |
|
If the |
optional |
|
No |
|
This parameter is meant to be used together with the |
optional |
|
Yes |
|
A list of TCP ports to which connection shall be tried. |
optional |
|
No |
|
Number of attempts to get a valid HTTP response/response-text |
optional |
|
No |
|
If the |
optional |
|
No |
|
A comma-separated list of acceptable HTTP response code ranges.
Example: |
optional |
If the |
No |
|
Text to look for in the response body. This will be matched against every line, and it will
be considered a success at the first match. If there is a |
optional |
|
No |
|
URL to be retrieved via the HTTP 'GET' command |
optional |
|
Yes |
|
This parameter is meant to be used together with the |
optional |
|
Yes |
|
Allows you to set the User-Agent HTTP header (see also RFC2616 section 14.43). |
optional |
|
Yes |
|
When set to true, full communication between client and the webserver will be logged
(with a log level of |
optional |
|
No |
This monitor implements the Common Configuration Parameters.
Examples
<!-- Test HTTP service on port 80 only -->
<service name="HTTP" interval="300000" user-defined="false" status="on">
  <parameter key="retry" value="2"/>
  <parameter key="timeout" value="3000"/>
  <parameter key="port" value="80"/>
  <parameter key="url" value="/"/>
</service>

<!-- Test for virtual host opennms.com running -->
<service name="OpenNMSdotCom" interval="300000" user-defined="false" status="on">
  <parameter key="retry" value="1"/>
  <parameter key="timeout" value="3000"/>
  <parameter key="port" value="80"/>
  <parameter key="host-name" value="opennms.com"/>
  <parameter key="url" value="/solutions"/>
  <parameter key="response" value="200-202,299"/>
  <parameter key="response-text" value="~.*[Cc]onsulting.*"/>
</service>

<!-- Test for instance of OpenNMS 1.2.9 running -->
<service name="OpenNMS-129" interval="300000" user-defined="false" status="on">
  <parameter key="retry" value="1"/>
  <parameter key="timeout" value="3000"/>
  <parameter key="port" value="8080"/>
  <parameter key="url" value="/opennms/event/list"/>
  <parameter key="basic-authentication" value="admin:admin"/>
  <parameter key="response" value="200"/>
</service>

<!-- Test for instance of OpenNMS 1.2.9 with parameter substitution in basic-authentication parameter -->
<service name="OpenNMS-22" interval="300000" user-defined="false" status="on">
  <parameter key="retry" value="1"/>
  <parameter key="timeout" value="3000"/>
  <parameter key="port" value="8080"/>
  <parameter key="url" value="/opennms/event/list"/>
  <parameter key="basic-authentication" value="{username}:{password}"/>
  <parameter key="response" value="200"/>
</service>
<monitor service="HTTP" class-name="org.opennms.netmgt.poller.monitors.HttpMonitor" />
<monitor service="OpenNMSdotCom" class-name="org.opennms.netmgt.poller.monitors.HttpMonitor" />
<monitor service="OpenNMS-129" class-name="org.opennms.netmgt.poller.monitors.HttpMonitor" />
<monitor service="OpenNMS-22" class-name="org.opennms.netmgt.poller.monitors.HttpMonitor" />
Testing filtering proxies with HttpMonitor
In case a filtering proxy server is set up to allow retrieval of some URLs but deny others, the HttpMonitor can be used to verify this behavior.
As an example a proxy server is running on TCP port 3128, and serves http://www.opennms.org/ but never http://www.myspace.com/. To test this behaviour, the HttpMonitor can be configured as the following:
<service name="HTTP-Allow-opennms.org" interval="300000" user-defined="false" status="on">
  <parameter key="retry" value="1"/>
  <parameter key="timeout" value="3000"/>
  <parameter key="port" value="3128"/>
  <parameter key="url" value="http://www.opennms.org/"/>
  <parameter key="response" value="200-399"/>
</service>

<service name="HTTP-Block-myspace.com" interval="300000" user-defined="false" status="on">
  <parameter key="retry" value="1"/>
  <parameter key="timeout" value="3000"/>
  <parameter key="port" value="3128"/>
  <parameter key="url" value="http://www.myspace.com/"/>
  <parameter key="response" value="400-599"/>
</service>

<monitor service="HTTP-Allow-opennms.org" class-name="org.opennms.netmgt.poller.monitors.HttpMonitor"/>
<monitor service="HTTP-Block-myspace.com" class-name="org.opennms.netmgt.poller.monitors.HttpMonitor"/>
5.6.17. HttpPostMonitor
If it is required to HTTP POST any arbitrary content to a remote URI, the HttpPostMonitor can be used. A use case is to HTTP POST to a SOAP endpoint. This monitor implements placeholder substitution in parameter values.
Monitor facts
Class Name |
|
Remote Enabled |
|
Configuration and Usage
| Parameter | Description | Required | Default value | Placeholder substitution |
|---|---|---|---|---|
|
The body of the POST, for example properly escaped XML. |
required |
|
No |
|
The password to use for HTTP BASIC auth. |
optional |
|
Yes |
|
The username to use for HTTP BASIC auth. |
optional |
|
Yes |
|
Additional headers to be sent along with the request. Example of valid
parameter’s names are |
optional |
|
No |
|
A string that is matched against the response of the HTTP POST.
If the output contains the banner, the service is determined as up.
Specify a regex by starting with |
optional |
|
Yes |
|
Set the character set for the POST. |
optional |
|
No |
|
Set the mimetype for the POST. |
optional |
|
No |
|
The port for the web server where the POST is send to. |
optional |
|
No |
|
The connection scheme to use. |
optional |
|
No |
|
Enables or disables the SSL ceritificate validation. |
optional |
|
No |
|
The uri to use during the POST. |
optional |
|
Yes |
|
Should the system wide proxy settings be used? The system proxy settings can be configured in system properties |
optional |
|
No |
This monitor implements the Common Configuration Parameters.
Examples
The following example would create a POST that contains the payload Word.
<service name="MyServlet" interval="300000" user-defined="false" status="on">
  <parameter key="banner" value="Hello"/>
  <parameter key="port" value="8080"/>
  <parameter key="uri" value="/MyServlet">
  <parameter key="payload" value="World"/>
  <parameter key="retry" value="1"/>
  <parameter key="timeout" value="30000"/>
</service>
<monitor service="MyServlet" class-name="org.opennms.netmgt.poller.monitors.HttpPostMonitor"/>
The resulting POST looks like this:
POST /MyServlet HTTP/1.1
Content-Type: text/xml; charset=utf-8
Host: <ip_addr_of_interface>:8080
Connection: Keep-Alive

World
5.6.18. HttpsMonitor
The HTTPS monitor tests the response of an SSL-enabled HTTP server. The HTTPS monitor is an SSL-enabled extension of the HTTP monitor with a default TCP port value of 443. All HttpMonitor parameters apply, so please refer to HttpMonitor’s documentation for more information. This monitor implements placeholder substitution in parameter values.
Monitor facts
Class Name |
|
Remote Enabled |
true |
Configuration and Usage
| Parameter | Description | Required | Default value |
|---|---|---|---|
|
A list of TCP ports to which connection shall be tried. |
optional |
|
Examples
<!-- Test HTTPS service on port 8443 -->
<service name="HTTPS" interval="300000" user-defined="false" status="on">
  <parameter key="retry" value="2"/>
  <parameter key="timeout" value="3000"/>
  <parameter key="port" value="8443"/>
  <parameter key="url" value="/"/>
</service>

<monitor service="HTTPS" class-name="org.opennms.netmgt.poller.monitors.HttpsMonitor" />
5.6.19. IcmpMonitor
The ICMP monitor tests for ICMP service availability by sending echo request ICMP messages. The service is considered available when the node sends back an echo reply ICMP message within the specified amount of time.
Monitor facts
Class Name |
|
Remote Enabled |
true with some restrictions (see below) |
Configuration and Usage
| Parameter | Description | Required | Default value |
|---|---|---|---|
|
Time in milliseconds to wait for a response. |
optional |
|
|
Whether to set the "Don’t Fragment" bit on outgoing packets |
optional |
|
|
DSCP traffic-control value. |
optional |
|
|
Number of bytes of the ICMP packet to send. |
optional |
|
|
Enables ICMP thresholding. |
optional |
|
This monitor implements the Common Configuration Parameters.
Examples
<service name="ICMP" interval="300000" user-defined="false" status="on">
  <parameter key="retry" value="2"/>
  <parameter key="timeout" value="3000"/>
  <parameter key="rrd-repository" value="/var/lib/opennms/rrd/response"/>
  <parameter key="rrd-base-name" value="icmp"/>
  <parameter key="ds-name" value="icmp"/>
</service>
<monitor service="ICMP" class-name="org.opennms.netmgt.poller.monitors.IcmpMonitor"/>
<!-- Advanced example: set DSCP bits and send a large packet with allow-fragmentation=false -->
<service name="ICMP" interval="300000" user-defined="false" status="on">
<parameter key="retry" value="2"/>
<parameter key="timeout" value="3000"/>
<parameter key="dscp" value="0x1C"/> <!-- AF32: Class 3, Medium drop probability -->
<parameter key="allow-fragmentation" value="false"/>
<parameter key="packet-size" value="2048"/>
<parameter key="rrd-repository" value="/var/lib/opennms/rrd/response"/>
<parameter key="rrd-base-name" value="icmp"/>
<parameter key="ds-name" value="icmp"/>
</service>
<monitor service="ICMP" class-name="org.opennms.netmgt.poller.monitors.IcmpMonitor"/>Note on Remote Poller
The IcmpMonitor needs the JNA ICMP implementation to function on remote poller. Though, corner cases exist where the IcmpMonitor monitor won’t work on remote poller. Examples of such corner cases are: Windows when the remote poller isn’t running has administrator, and Linux on ARM / Rasperry Pi. JNA is the default ICMP implementation used in the remote poller.
5.6.20. ImapMonitor
This monitor checks if an IMAP server is functional. The test is done by initializing a very simple IMAP conversation. The ImapMonitor establishes a TCP connection, sends a logout command and test the IMAP server responses.
The behavior can be simulated with telnet:
telnet mail.myserver.de 143
Trying 62.108.41.197...
Connected to mail.myserver.de.
Escape character is '^]'.
* OK [CAPABILITY IMAP4rev1 LITERAL+ SASL-IR LOGIN-REFERRALS ID ENABLE IDLE STARTTLS LOGINDISABLED] Dovecot ready. (1)
ONMSPOLLER LOGOUT (2)
* BYE Logging out (3)
ONMSPOLLER OK Logout completed.
Connection closed by foreign host.
| 1 | Test IMAP server banner, it has to start * OK to be up |
| 2 | Sending a ONMSPOLLER LOGOUT |
| 3 | Test server responds with, it has to start with * BYE to be up |
If one of the tests in the sample above fails the service is marked down.
Monitor facts
Class Name |
|
Remote Enabled |
false |
Configuration and Usage
| Parameter | Description | Required | Default value |
|---|---|---|---|
|
Number of attempts to get a valid IMAP response |
optional |
|
|
The port of the IMAP server. |
optional |
|
This monitor implements the Common Configuration Parameters.
Examples
Some example configuration how to configure the monitor in the poller-configuration.xml
<!-- Test IMAP service on port 143 only -->
<service name="IMAP" interval="300000" user-defined="false" status="on">
  <parameter key="retry" value="1"/>
  <parameter key="port" value="143"/>
  <parameter key="timeout" value="3000"/>
</service>

<monitor service="IMAP" class-name="org.opennms.netmgt.poller.monitors.ImapMonitor" />
5.6.21. ImapsMonitor
The IMAPS monitor tests the response of an SSL-enabled IMAP server. The IMAPS monitor is an SSL-enabled extension of the IMAP monitor with a default TCP port value of 993. All ImapMonitor parameters apply, so please refer to ImapMonitor’s documentation for more information.
Monitor facts
Class Name |
|
Remote Enabled |
true |
Configuration and Usage
| Parameter | Description | Required | Default value |
|---|---|---|---|
|
The destination port where connections shall be attempted. |
optional |
|
This monitor implements the Common Configuration Parameters.
Examples
<!-- IMAPS service at OpenNMS.org is on port 9993 -->
<service name="IMAPS" interval="300000" user-defined="false" status="on">
  <parameter key="port" value="9993"/>
  <parameter key="version" value="3"/>
  <parameter key="retry" value="2"/>
  <parameter key="timeout" value="3000"/>
  <parameter key="rrd-repository" value="/var/lib/opennms/rrd/response"/>
  <parameter key="rrd-base-name" value="imaps"/>
  <parameter key="ds-name" value="imaps"/>
</service>

<monitor service="IMAPS" class-name="org.opennms.netmgt.poller.monitors.ImapsMonitor" />
5.6.22. JCifsMonitor
This monitor allows to test a file sharing service based on the CIFS/SMB protocol. This monitor implements placeholder substitution in parameter values.
This monitor is not installed by default.
You have to install opennmms-plugin-protocol-cifs from your OpenNMS Horizon installation repository.
|
With the JCIFS monitor you have different possibilities to test the availability of the JCIFS service:
With the JCifsMonitor it is possible to run tests for the following use cases:
-
share is available in the network
-
a given file exists in the share
-
a given folder exists in the share
-
a given folder should contain at least one (1) file
-
a given folder folder should contain no (0) files
-
by testing on files and folders, you can use a regular expression to ignore specific file and folder names from the test
A network resource in SMB like a file or folder is addressed as a UNC Path.
\\server\share\folder\file.txt
The Java implementation jCIFS, which implements the CIFS/SMB network protocol, uses SMB URLs to access the network resource. The same resource as in our example would look like this as an SMB URL:
smb://workgroup;user:password@server/share/folder/file.txt
The JCifsMonitor can not test:
-
file contains specific content
-
a specific number of files in a folder, for example folder should contain exactly / more or less than x files
-
Age or modification time stamps of files or folders
-
Permissions or other attributes of files or folders
Monitor facts
Class Name |
|
Remote Enabled |
false |
Configuration and Usage
| Parameter | Description | Required | Default value | Placeholder substitution |
|---|---|---|---|---|
|
Number of retries before the service is marked as down. |
optional |
|
No |
|
Windows domain where the user is located. You don’t have to use the domain parameter if you use local user accounts. |
optional |
empty String |
Yes |
|
Username to access the resource over a network |
optional |
empty String |
Yes |
|
Password for the user |
optional |
empty String |
Yes |
|
Path to the resource you want to test |
required |
empty String |
No |
|
The test mode which has the following options |
optional |
|
No |
|
Override the IP address of the SMB url to check shares on different file servers. |
optional |
empty String |
No |
|
Ignore specific files in folder with regular expression. This parameter will just be applied on
|
optional |
|
No |
| Due to limitations in the JCifs library, only global timeouts can be used reliably. |
This monitor implements the Common Configuration Parameters.
It makes little sense to have retries higher than 1.
It is a waste of resources during the monitoring.
|
Please consider, if you are accessing shares with Mac OSX you have some side effects with the hidden file '.DS_Store.'
It could give you false positives in monitoring, you can use then the folderIgnoreFiles parameter.
|
Example test existence of a file
This example shows how to configure the JCifsMonitor to test if a file share is available over a network. For this example we have access to a share for error logs and we want to get an outage if we have any error log files in our folder. The share is named log. The service should go back to normal if the error log file is deleted and the folder is empty.
<service name="CIFS-ErrorLog" interval="30000" user-defined="true" status="on">
    <parameter key="retry" value="1" />
    <parameter key="timeout" value="3000" />
    <parameter key="domain" value="contoso" />(1)
    <parameter key="username" value="MonitoringUser" />(2)
    <parameter key="password" value="MonitoringPassword" />(3)
    <parameter key="path" value="/fileshare/log/" />(4)
    <parameter key="mode" value="folder_empty" />(5)
</service>

<monitor service="CIFS-ErrorLog" class-name="org.opennms.netmgt.poller.monitors.JCifsMonitor" />| 1 | Name of the SMB or Microsoft Windows Domain |
| 2 | User for accessing the share |
| 3 | Password for accessing the share |
| 4 | Path to the folder inside of the share as part of the SMB URL |
| 5 | Mode is set to folder_empty |
5.6.23. JDBCMonitor
The JDBCMonitor checks that it is able to connect to a database and checks if it is able to get the database catalog from that database management system (DBMS). It is based on the JDBC technology to connect and communicate with the database. This monitor implements placeholder substitution in parameter values.
Monitor facts
Class Name |
|
Remote Enabled |
true |
Configuration and Usage
| Parameter | Description | Required | Default value | Placeholder substitution |
|---|---|---|---|---|
|
JDBC driver class to use |
required |
|
No |
|
JDBC Url to connect to. |
required |
|
Yes |
|
Database user |
required |
|
Yes |
|
Database password |
required |
|
Yes |
|
How many retries should be performed before failing the test |
optional |
|
No |
| The OPENNMS_JDBC_HOSTNAME is replaced in the url parameter with the IP or resolved hostname of the interface the monitored service is assigned to. |
This monitor implements the Common Configuration Parameters.
Provide the database driver
The JDBCMonitor is based on JDBC and requires a JDBC driver to communicate with any database.
Due to the fact that OpenNMS Horizon itself uses a PostgreSQL database, the PostgreSQL JDBC driver is available out of the box.
For all other database systems a compatible JDBC driver has to be provided to OpenNMS Horizon as a jar-file.
To provide a JDBC driver place the driver-jar in the opennms/lib folder of your OpenNMS Horizon.
To use the JDBCMonitor from a remote poller, the driver-jar has to be provided to the Remote Poller too.
This may be tricky or impossible when using the Java Webstart Remote Poller, because of code signing requirements.
Examples
The following example checks if the PostgreSQL database used by OpenNMS Horizon is available.
<service name="OpenNMS-DBMS" interval="30000" user-defined="true" status="on">
  <parameter key="driver" value="org.postgresql.Driver"/>
  <parameter key="url" value="jdbc:postgresql://OPENNMS_JDBC_HOSTNAME:5432/opennms"/>
  <parameter key="user" value="opennms"/>
  <parameter key="password" value="opennms"/>
</service>

<monitor service="OpenNMS-DBMS" class-name="org.opennms.netmgt.poller.monitors.JDBCMonitor" />
5.6.24. JDBCStoredProcedureMonitor
The JDBCStoredProcedureMonitor checks the result of a stored procedure in a remote database. The result of the stored procedure has to be a boolean value (representing true or false). The service associated with this monitor is marked as up if the stored procedure returns true and it is marked as down in all other cases. It is based on the JDBC technology to connect and communicate with the database. This monitor implements placeholder substitution in parameter values.
Monitor facts
Class Name |
|
Remote Enabled |
false |
Configuration and Usage
| Parameter | Description | Required | Default value | Placeholder substitution |
|---|---|---|---|---|
|
JDBC driver class to use |
required |
|
No |
|
JDBC Url to connect to. |
required |
|
Yes |
|
Database user |
required |
|
Yes |
|
Database password |
required |
|
Yes |
|
How many retries should be performed before failing the test |
optional |
|
No |
|
Name of the database stored procedure to call |
required |
|
No |
|
Name of the database schema in which the stored procedure is |
optional |
|
No |
| The OPENNMS_JDBC_HOSTNAME is replaced in the url parameter with the IP or resolved hostname of the interface the monitored service is assigned to. |
This monitor implements the Common Configuration Parameters.
Provide the database driver
The JDBCStoredProcedureMonitor is based on JDBC and requires a JDBC driver to communicate with any database.
Due to the fact that OpenNMS Horizon itself uses a PostgreSQL database, the PostgreSQL JDBC driver is available out of the box.
For all other database systems a compatible JDBC driver has to be provided to OpenNMS Horizon as a jar-file.
To provide a JDBC driver place the driver-jar in the opennms/lib folder of your OpenNMS Horizon.
To use the JDBCStoredProcedureMonitor from a remote poller, the driver-jar has to be provided to the Remote Poller too.
This may be tricky or impossible when using the Java Webstart Remote Poller, because of code signing requirements.
Examples
The following example checks a stored procedure added to the PostgreSQL database used by OpenNMS Horizon. The stored procedure returns true as long as less than 250000 events are in the events table of OpenNMS Horizon.
CREATE OR REPLACE FUNCTION eventlimit_sp() RETURNS boolean AS
$BODY$DECLARE
num_events integer;
BEGIN
	SELECT COUNT(*) into num_events from events;
	RETURN num_events > 250000;
END;$BODY$
LANGUAGE plpgsql VOLATILE NOT LEAKPROOF
COST 100;
<service name="OpenNMS-DB-SP-Event-Limit" interval="300000" user-defined="true" status="on">
<parameter key="driver" value="org.postgresql.Driver"/>
<parameter key="url" value="jdbc:postgresql://OPENNMS_JDBC_HOSTNAME:5432/opennms"/>
<parameter key="user" value="opennms"/>
<parameter key="password" value="opennms"/>
<parameter key="stored-procedure" value="eventlimit_sp"/>
<parameter key="schema" value="public"/>
</service>
<monitor service="OpenNMS-DB-SP-Event-Limit" class-name="org.opennms.netmgt.poller.monitors.JDBCStoredProcedureMonitor"/>5.6.25. JDBCQueryMonitor
The JDBCQueryMonitor runs an SQL query against a database and is able to verify the result of the query. A read-only connection is used to run the SQL query, so the data in the database is not altered. It is based on the JDBC technology to connect and communicate with the database. This monitor implements placeholder substitution in parameter values.
Monitor facts
Class Name |
|
Remote Enabled |
false |
Configuration and Usage
| Parameter | Description | Required | Default value | Placeholder substitution |
|---|---|---|---|---|
|
JDBC driver class to use |
required |
|
No |
|
JDBC URL to connect to |
required |
|
Yes |
|
Database user |
required |
|
Yes |
|
Database password |
required |
|
Yes |
|
The SQL query to run |
required |
|
No |
|
What evaluation action to perform |
required |
|
No |
|
The result column to evaluate against when using compare_string method |
required |
|
No |
|
Operator to use for the evaluation |
required |
|
No |
|
The operand to compare against the SQL query result |
required |
depends on the action |
No |
|
The message to use if the service is down. Both operands and the operator are added to the message too. |
optional |
generic message depending on the action |
No |
|
How many retries should be performed before failing the test |
optional |
|
No |
| The OPENNMS_JDBC_HOSTNAME is replaced in the url parameter with the IP or resolved hostname of the interface the monitored service is assigned to. |
This monitor implements the Common Configuration Parameters.
| Parameter | Description | Default operand |
|---|---|---|
|
The number of returned rows is compared, not a value of the resulting rows |
|
|
Strings are always checked for equality with the operand |
|
|
An integer from a column of the first result row is compared |
|
| Parameter | XML entity to use in XML configs |
|---|---|
|
|
|
|
|
|
|
|
|
|
|
|
Evaluating the action - operator - operand
Only the first result row returned by the SQL query is evaluated. The evaluation can be against the value of one column or the number of rows returned by the SQL query.
Provide the database driver
The JDBCQueryMonitor is based on JDBC and requires a JDBC driver to communicate with any database.
Due to the fact that OpenNMS Horizon itself uses a PostgreSQL database, the PostgreSQL JDBC driver is available out of the box.
For all other database systems a compatible JDBC driver has to be provided to OpenNMS Horizon as a jar-file.
To provide a JDBC driver place the driver-jar in the opennms/lib folder of your OpenNMS Horizon.
To use the JDBCQueryMonitor from a remote poller, the driver-jar has to be provided to the Remote Poller too.
This may be tricky or impossible when using the Java Webstart Remote Poller, because of code signing requirements.
Examples
Row Count
The following example checks if the number of events in the OpenNMS Horizon database is fewer than 250,000.
<service name="OpenNMS-DB-Event-Limit" interval="30000" user-defined="true" status="on">
<parameter key="driver" value="org.postgresql.Driver"/>
<parameter key="url" value="jdbc:postgresql://OPENNMS_JDBC_HOSTNAME:5432/opennms"/>
<parameter key="user" value="opennms"/>
<parameter key="password" value="opennms"/>
<parameter key="query" value="select eventid from events" />
<parameter key="action" value="row_count" />
<parameter key="operand" value="250000" />
<parameter key="operator" value="<" />
<parameter key="message" value="too many events in OpenNMS database" />
</service>
<monitor service="OpenNMS-DB-Event-Limit" class-name="org.opennms.netmgt.poller.monitors.JDBCQueryMonitor" />String Comparison
The following example checks if the queried string matches against a defined operand.
<service name="MariaDB-Galera" interval="300000" user-defined="false" status="on">
  <parameter key="driver" value="org.mariadb.jdbc.Driver"/>
  <parameter key="user" value="opennms"/>
  <parameter key="password" value="********"/>
  <parameter key="url" value="jdbc:mysql://OPENNMS_JDBC_HOSTNAME"/>
  <parameter key="query" value="SELECT VARIABLE_VALUE FROM INFORMATION_SCHEMA.GLOBAL_STATUS WHERE VARIABLE_NAME = 'wsrep_cluster_status'"/>
  <parameter key="column" value="VARIABLE_VALUE"/>
  <parameter key="action" value="compare_string"/>
  <parameter key="operator" value="="/>
  <parameter key="operand" value="Primary"/>
  <parameter key="message" value="Galera Node is not in primary component"/>
</service>

<monitor service="MariaDB-Galera" class-name="org.opennms.netmgt.poller.monitors.JDBCQueryMonitor" />
5.6.26. JmxMonitor
The JMX monitor allows to test service availability of Java applications. The monitor offers the following functionalities:
-
test the application’s connectivity via JMX
-
existence of management beans
-
test the status of a single or multiple management beans and evaluate their value
Monitor facts
Class Name |
|
Remote Enabled |
|
Configuration and Usage
| Parameter | Description | Required | Default value |
|---|---|---|---|
|
Number of attempts to get a response |
optional |
|
|
Time in milliseconds to wait for a response |
optional |
|
|
Destination port where the JMX requests shall be sent |
optional |
from |
|
Set this to |
optional |
|
|
Protocol used in the JMX connection string |
optional |
|
|
Path used in JMX connection string |
optional |
|
|
RMI port |
optional |
|
|
Use an alternative JMX URL scheme |
optional |
|
|
Defines a mbeans objectname to access. The ´<variable>´ name is arbitrary. |
optional |
|
|
Tests a mbeans attribute value. The ´<variable>´ name is arbitrary. |
optional |
|
Examples
<service name="JMX-Connection-Test" interval="300000" user-defined="false" status="on">
    <parameter key="retry" value="3"/>
    <parameter key="timeout" value="3000"/>
    <parameter key="port" value="18980"/>
</service>
<monitor service="JMX-Connection-Test" class-name="org.opennms.netmgt.poller.monitors.JmxMonitor"/><service name="JMX-BeanValue-Test" interval="300000" user-defined="false" status="on">
<parameter key="retry" value="3"/>
<parameter key="timeout" value="3000"/>
<parameter key="port" value="18980"/>
<parameter key="beans.connected" value="org.opennms.workflow:name=client.onms.connected"/>
<parameter key="tests.isConnected" value="connected.get("Value") == true"/>
</service>
<monitor service="JMX-BeanValue-Test" class-name="org.opennms.netmgt.poller.monitors.Jsr160Monitor"/>| Reserved XML characters like >, <, " need to be escaped. |
5.6.27. JolokiaBeanMonitor
The JolokiaBeanMonitor is a JMX monitor specialized for the use with the Jolokia framework. If it is required to execute a method via JMX or poll an attribute via JMX, the JolokiaBeanMonitor can be used. It requires a fully installed and configured Jolokia agent to be deployed in the JVM container. If required it allows attribute names, paths, and method parameters to be provided additional arguments to the call. To determine the status of the service the JolokiaBeanMonitor relies on the output to be matched against a banner. If the banner is part of the output the status is interpreted as up. If the banner is not available in the output the status is determined as down. Banner matching supports regular expression and substring match. This monitor implements placeholder substitution in parameter values.
Monitor facts
Class Name |
|
Remote Enabled |
false |
Configuration and Usage
| Parameter | Description | Required | Default value | Placeholder substitution |
|---|---|---|---|---|
|
The bean name to query against. |
required |
|
No |
|
The name of the JMX attribute to scrape. |
optional ( |
|
No |
|
The attribute path. |
optional |
|
No |
|
The username to use for HTTP BASIC auth. |
optional |
|
Yes |
|
The password to use for HTTP BASIC auth. |
optional |
|
Yes |
|
A string that is match against the output of the system-call. If the output contains the banner,
the service is determined as up. Specify a regex by starting with |
optional |
|
Yes |
|
Method input |
optional |
|
Yes |
|
Method input |
optional |
|
Yes |
|
The name of the bean method to execute, output will be compared to banner. |
optional ( |
|
Yes |
|
The port of the jolokia agent. |
optional |
|
No |
|
The jolokia agent url. Defaults to "http://<ipaddr>:<port>/jolokia" |
optional |
|
Yes |
This monitor implements the Common Configuration Parameters.
| Variable | Description |
|---|---|
|
IP-address of the interface the service is bound to. |
|
Port the service it bound to. |
Examples
Some example configuration how to configure the monitor in the poller-configuration.xml
<parameter key="url" value="http://${ipaddr}:${port}/jolokia"/>
<parameter key="url" value="https://${ipaddr}:${port}/jolokia"/>
AttrName vs MethodName
The JolokiaBeanMonitor has two modes of operation. It can either scrape an attribute from a bean, or execute a method and compare output to a banner. The method execute is useful when your application has its own test methods that you would like to trigger via OpenNMS Horizon.
The args to execute a test method called "superTest" that take in a string as input would look like this:
<parameter key="beanname" value="MyBean" />
<parameter key="methodname" value="superTest" />
<parameter key="input1" value="someString"/>
The args to scrape an attribute from the same bean would look like this:
<parameter key="beanname" value="MyBean" />
<parameter key="attrname" value="upTime" />
5.6.28. LdapMonitor
The LDAP monitor tests for LDAP service availability. The LDAP monitor first tries to establish a TCP connection on the specified port. Then, if it succeeds, it will attempt to establish an LDAP connection and do a simple search. If the search returns a result within the specified timeout and attempts, the service will be considered available. The scope of the LDAP search is limited to the immediate subordinates of the base object. The LDAP search is anonymous by default. The LDAP monitor makes use of the com.novell.ldap.LDAPConnection class. This monitor implements placeholder substitution in parameter values.
Monitor facts
Class Name |
|
Remote Enabled |
true |
Configuration and Usage
| Parameter | Description | Required | Default value | Placeholder substitution |
|---|---|---|---|---|
|
The distinguished name to use if authenticated search is needed. |
optional |
|
Yes |
|
The password to use if authenticated search is needed. |
optional |
|
Yes |
|
The destination port where connection shall be attempted. |
optional |
|
No |
|
Number of attempts to get a search result. |
optional |
|
No |
|
The base distinguished name to search from. |
optional |
|
No |
|
The LDAP search’s filter. |
optional |
|
No |
|
The version of the LDAP protocol to use, specified as an integer. Note: Only LDAPv3 is supported at the moment. |
optional |
|
No |
This monitor implements the Common Configuration Parameters.
Examples
<!-- OpenNMS.org -->
<service name="LDAP" interval="300000" user-defined="false" status="on">
  <parameter key="port" value="389"/>
  <parameter key="version" value="3"/>
  <parameter key="searchbase" value="dc=opennms,dc=org"/>
  <parameter key="searchfilter" value="uid=ulf"/>
  <parameter key="retry" value="2"/>
  <parameter key="timeout" value="3000"/>
  <parameter key="rrd-repository" value="/var/lib/opennms/rrd/response"/>
  <parameter key="rrd-base-name" value="ldap"/>
  <parameter key="ds-name" value="ldap"/>
</service>
<monitor service="LDAP" class-name="org.opennms.netmgt.poller.monitors.LdapMonitor"/>
5.6.29. LdapsMonitor
The LDAPS monitor tests the response of an SSL-enabled LDAP server. The LDAPS monitor is an SSL-enabled extension of the LDAP monitor with a default TCP port value of 636. All LdapMonitor parameters apply, so please refer to LdapMonitor’s documentation for more information. This monitor implements the same placeholder substitution in parameter values as LdapMonitor.
Monitor facts
Class Name |
|
Remote Enabled |
true |
Configuration and Usage
| Parameter | Description | Required | Default value |
|---|---|---|---|
|
The destination port where connections shall be attempted. |
optional |
|
This monitor implements the Common Configuration Parameters.
Examples
<!-- LDAPS service at OpenNMS.org is on port 6636 -->
<service name="LDAPS" interval="300000" user-defined="false" status="on">
  <parameter key="port" value="6636"/>
  <parameter key="version" value="3"/>
  <parameter key="searchbase" value="dc=opennms,dc=org"/>
  <parameter key="searchfilter" value="uid=ulf"/>
  <parameter key="retry" value="2"/>
  <parameter key="timeout" value="3000"/>
  <parameter key="rrd-repository" value="/var/lib/opennms/rrd/response"/>
  <parameter key="rrd-base-name" value="ldaps"/>
  <parameter key="ds-name" value="ldaps"/>
</service>

<monitor service="LDAPS" class-name="org.opennms.netmgt.poller.monitors.LdapsMonitor" />
5.6.30. MemcachedMonitor
This monitor allows to monitor Memcached, a distributed memory object caching system. To monitor the service availability the monitor tests if the Memcached statistics can be requested. The statistics are processed and stored in RRD files. The following metrics are collected:
| Metric | Description |
|---|---|
uptime |
Seconds the Memcached server has been running since last restart. |
rusageuser |
User time seconds for the server process. |
rusagesystem |
System time seconds for the server process. |
curritems |
Number of items in this servers cache. |
totalitems |
Number of items stored on this server. |
bytes |
Number of bytes currently used for caching items. |
limitmaxbytes |
Maximum configured cache size. |
currconnections |
Number of open connections to this Memcached. |
totalconnections |
Number of successful connect attempts to this server since start. |
connectionstructure |
Number of internal connection handles currently held by the server. |
cmdget |
Number of GET commands received since server startup. |
cmdset |
Number of SET commands received since server startup. |
gethits |
Number of successful GET commands (cache hits) since startup. |
getmisses |
Number of failed GET requests, because nothing was cached. |
evictions |
Number of objects removed from the cache to free up memory. |
bytesread |
Number of bytes received from the network. |
byteswritten |
Number of bytes send to the network. |
threads |
Number of threads used by this server. |
Monitor facts
Class Name |
|
Remote Enabled |
true |
Configuration and Usage
| Parameter | Description | Required | Default value |
|---|---|---|---|
|
Number of attempts to establish the Memcached connnection. |
optional |
|
|
TCP port connecting to Memcached. |
optional |
|
This monitor implements the Common Configuration Parameters.
Examples
The following example shows a configuration in the poller-configuration.xml.
<service name="Memcached" interval="300000" user-defined="false" status="on">
  <parameter key="port" value="11211" />
  <parameter key="retry" value="2" />
  <parameter key="timeout" value="3000" />
  <parameter key="rrd-repository" value="/opt/opennms/share/rrd/response" />
  <parameter key="ds-name" value="memcached" />
  <parameter key="rrd-base-name" value="memcached" />
</service>

<monitor service="Memcached" class-name="org.opennms.netmgt.poller.monitors.MemcachedMonitor" />
5.6.31. NetScalerGroupHealthMonitor
This monitor is designed for Citrix® NetScaler® loadbalancing checks. It checks if more than x percent of the servers assigned to a specific group on a loadbalanced service are active. The required data is gathered via SNMP from the NetScaler®. The status of the servers is determined by the NetScaler®. The provided service it self is not part of the check. The basis of this monitor is the SnmpMonitorStrategy. A valid SNMP configuration in OpenNMS Horizon for the NetScaler® is required.
| A NetScaler® can manage several groups of servers per application. This monitor just covers one group at a time. If there are multiple groups to check, define one monitor per group. |
| This monitor is not checking the loadbalanced service it self. |
Monitor facts
Class Name |
|
Remote Enabled |
false |
Configuration and Usage
| Parameter | Description | Required | Default value |
|---|---|---|---|
|
The name of the server group to check |
required |
|
|
The percentage of active servers vs total server of the group as an integer |
optional |
|
This monitor implements the Common Configuration Parameters.
Examples
The following example checks a server group called central_webfront_http.
If at least 70% of the servers are active, the service is up.
If less then 70% of the servers are active the service is down.
A configuration like the following can be used for the example in the poller-configuration.xml.
<service name="NetScaler_Health" interval="300000" user-defined="false" status="on">
   <parameter key="group-name" value="central_webfront_http" />
   <parameter key="group-health" value="70" />
</service>

<monitor service="NetScaler_Health" class-name="org.opennms.netmgt.poller.monitors.NetScalerGroupHealthMonitor” />
Details about the used SNMP checks
The monitor checks the status of the server group based on the NS-ROOT-MIB using the svcGrpMemberState.
svcGrpMemberState is part of the serviceGroupMemberTable.
The serviceGroupMemberTable is indexed by svcGrpMemberGroupName and svcGrpMemberName.
A initial lookup for the group-name is performed.
Based on the lookup the serviceGroupMemberTable is walked with the numeric representation of the server group.
The monitor interprets just the server status code 7-up as active server.
Other status codes like 2-unknown or 3-busy are counted for total amount of servers.
5.6.32. NrpeMonitor
This monitor allows to test plugins and checks running on the Nagios Remote Plugin Executor (NRPE) framework. The monitor allows to test the status output of any available check command executed by NRPE. Between OpenNMS Horizon and Nagios are some conceptional differences. In OpenNMS Horizon a service can only be available or not available and the response time for the service is measured. Nagios on the other hand combines service availability, performance data collection and thresholding in one check command. For this reason a Nagios check command can have more states then OK and CRITICAL. Using the NrpeMonitor marks all check command results other than OK as down. The full output of the check command output message is passed into the service down event in OpenNMS Horizon.
NRPE configuration on the server is required and the check command has to be configured, e.g. command[check_apt]=/usr/lib/nagios/plugins/check_apt
|
OpenNMS Horizon executes every NRPE check in a Java thread without fork() a process and it is more resource friendly.
Nevertheless it is possible to run NRPE plugins which combine a lot of external programs like sed, awk or cut.
Be aware, each command end up in forking additional processes.
|
Monitor facts
Class Name |
|
Remote Enabled |
false |
Configuration and Usage
| Parameter | Description | Required | Default value |
|---|---|---|---|
|
Number of retries before the service is marked as down. |
optional |
|
|
The {check_name} of the command configured as `command[{check_name}]="/path/to/plugin/check-script" |
required |
empty |
|
Port to access NRPE on the remote server. |
optional |
|
|
Padding for sending the command to the NRPE agent. |
optional |
|
|
Enable encryption of network communication. NRPE uses SSL with anonymous DH and the following cipher suite TLS_DH_anon_WITH_AES_128_CBC_SHA |
optional |
|
This monitor implements the Common Configuration Parameters.
Example: Using check_apt with NRPE
This examples shows how to configure the NrpeMonitor running the check_apt command on a configured NRPE.
command[check_apt]=/usr/lib/nagios/plugins/check_apt<service name="NRPE-Check-APT" interval="300000" user-defined="false" status="on">
<parameter key="retry" value="3" />
<parameter key="timeout" value="3000" />
<parameter key="port" value="5666" />
<parameter key="command" value="check_apt" />
<parameter key="padding" value="2" />
</service>
<monitor service="NRPE-Check-APT" class-name="org.opennms.netmgt.poller.monitors.NrpeMonitor" />5.6.33. NtpMonitor
The NTP monitor tests for NTP service availability. During the poll an NTP request query packet is generated. If a response is received, it is parsed and validated. If the response is a valid NTP response, the service is considered available.
Monitor facts
Class Name |
|
Remote Enabled |
true |
Configuration and Usage
| Parameter | Description | Required | Default value |
|---|---|---|---|
|
The destination port where the NTP request shall be sent. |
optional |
|
|
Number of attempts to get a response. |
optional |
|
|
Time in milliseconds to wait for a response. |
optional |
|
This monitor implements the Common Configuration Parameters.
Examples
<!-- Fast NTP server -->
<service name="NTP" interval="300000" user-defined="false" status="on">
  <parameter key="retry" value="2"/>
  <parameter key="timeout" value="1000"/>
  <parameter key="rrd-repository" value="/var/lib/opennms/rrd/response"/>
  <parameter key="rrd-base-name" value="ntp"/>
  <parameter key="ds-name" value="ntp"/>
</service>
<monitor service="NTP" class-name="org.opennms.netmgt.poller.monitors.NtpMonitor"/>
5.6.34. OmsaStorageMonitor
With OmsaStorageMonitor you are able to monitor your Dell OpenManaged servers RAID array status. The following OIDs from the STORAGEMANAGEMENT-MIB are supported by this monitor:
virtualDiskRollUpStatus                     .1.3.6.1.4.1.674.10893.1.20.140.1.1.19
arrayDiskLogicalConnectionVirtualDiskNumber .1.3.6.1.4.1.674.10893.1.20.140.3.1.5
arrayDiskNexusID                            .1.3.6.1.4.1.674.10893.1.20.130.4.1.26
arrayDiskLogicalConnectionArrayDiskNumber   .1.3.6.1.4.1.674.10893.1.20.140.3.1.3
arrayDiskState                              .1.3.6.1.4.1.674.10893.1.20.130.4.1.4
To test the status of the disk array the virtualDiskRollUpStatus is used.
If the result of the virtualDiskRollUpStatus is not 3 the monitors is marked as down.
| Result | State description | Monitor state in OpenNMS Horizon |
|---|---|---|
|
other |
DOWN |
|
unknown |
DOWN |
|
ok |
UP |
|
non-critical |
DOWN |
|
critical |
DOWN |
|
non-recoverable |
DOWN |
| You’ll need to know the maximum number of possible logical disks you have in your environment. For example: If you have 3 RAID arrays, you need for each logical disk array a service poller. |
To give more detailed information in case of an disk array error, the monitor tries to identify the problem using the other OIDs. This values are used to enrich the error reason in the service down event. The disk array state is resolved to a human readable value by the following status table.
| Value | Status |
|---|---|
|
Ready |
|
Failed |
|
Online |
|
Offline |
|
Degraded |
|
Recovering |
|
Removed |
|
Resynching |
|
Rebuilding |
|
noMedia |
|
Formating |
|
Running Diagnostics |
|
Initializing |
Monitor facts
Class Name |
|
Remote Enabled |
|
Configuration and Usage
| Parameter | Description | Required | Default value |
|---|---|---|---|
|
The disk index of your RAID array |
optional |
|
|
The TCP port OpenManage is listening |
optional |
from |
This monitor implements the Common Configuration Parameters.
Examples
Some example configuration how to configure the monitor in the poller-configuration.xml.
The RAID array monitor for your first array is configured with virtualDiskNumber = 1 and can look like this:
<service name="OMSA-Disk-Array-1" interval="300000" user-defined="false" status="on">
 <parameter key="retry" value="3"/>
 <parameter key="timeout" value="6000"/>
 <parameter key="virtualDiskNumber" value="1"/>
</service>

<monitor service="OMSA-Disk-Array-1" class-name="org.opennms.netmgt.poller.monitors.OmsaStorageMonitor"/>
If there is more than one RAID array to monitor you need an additional configuration.
In this case virtualDiskNumber = 2.
<service name="OMSA-Disk-Array-2" interval="300000" user-defined="false" status="on">
 <parameter key="retry" value="3"/>
 <parameter key="timeout" value="6000"/>
 <parameter key="virtualDiskNumber" value="2"/>
</service>

<monitor service="OMSA-Disk-Array-2" class-name="org.opennms.netmgt.poller.monitors.OmsaStorageMonitor"/>
5.6.35. OpenManageChassisMonitor
The OpenManageChassis monitor tests the status of a Dell chassis by querying its SNMP agent. The monitor polls the value of the node’s SNMP OID .1.3.6.1.4.1.674.10892.1.300.10.1.4.1 (MIB-Dell-10892::chassisStatus). If the value is OK (3), the service is considered available.
As this monitor uses SNMP, the queried nodes must have proper SNMP configuration in snmp-config.xml.
Monitor facts
Class Name |
|
Remote Enabled |
false |
Configuration and Usage
| Parameter | Description | Required | Default value |
|---|---|---|---|
|
The port to which connection shall be tried. |
optional |
from |
This monitor implements the Common Configuration Parameters.
Examples
<!-- Overriding default SNMP config -->
<service name="OMA-Chassis" interval="300000" user-defined="false" status="on">
  <parameter key="retry" value="3"/>
  <parameter key="timeout" value="5000"/>
</service>

<monitor service="OMA-Chassis" class-name="org.opennms.netmgt.poller.monitors.OpenManageChassisMonitor" />
Dell MIBs
Dell MIBs can be found here. Download the DCMIB<version>.zip or DCMIB<version>.exe file corresponding to the version of your OpenManage agents. The latest one should be good enough for all previous version though.
5.6.36. PageSequenceMonitor
The PageSequenceMonitor (PSM) allows OpenNMS to monitor web applications. This monitor has several configuration options regarding IPv4, IPv6 and how to deal with name resolution. To add flexibility, the node label and IP address can be passed as variable into the monitor. This allows running the monitor with node dependent configuration. Beyond testing a web application with a single URL it can also test a path through a web application. A test path through an web application can look like this:
-
login to a certain web application
-
Execute an action while being logged in
-
Log off
The service is considered as up if all this is working ok. If there’s an error somewhere, your application will need attention and the service changes the state to down.
Monitor facts
Class Name |
|
Remote Enabled |
true |
Configuration and Usage
The configuration for this monitor consists of several parts.
First is the overall configuration for retries and timeouts.
These parameters are global for the whole path through the web application.
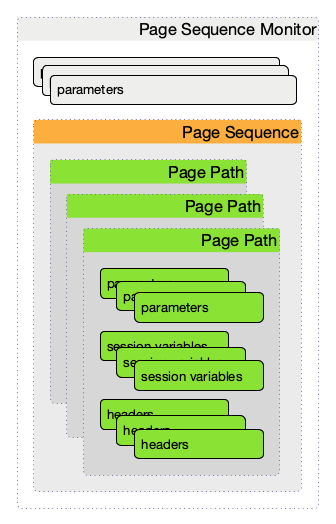
The overall layout of the monitor configuration is more complex. Additionally, it is possible to configure a page sequence containing a path through a web application.
| Parameter | Description | Required | Default value |
|---|---|---|---|
|
The number of retries per page. |
optional |
|
|
Defines a timer to wait before a retry attempt is made.
It is only used if at least one (1) retry is configured.
If |
optional |
|
|
Definition of the page-sequence to execute, see table with Page Sequence Parameter |
required |
|
|
The retry parameter for the entire page sequence. |
optional |
|
|
Should the system wide proxy settings be used? The system proxy settings can be configured via system properties |
optional |
|
This monitor implements the Common Configuration Parameters.
| Parameter | Description | Required | Default |
|---|---|---|---|
|
The name of the page-sequence. (Is this relevant/used?) |
optional |
|
|
HTTP method for example GET or POST |
|
|
|
HTTP protocol version number, 0.9, 1.0 or 1.1 |
optional |
|
|
Set the user agent field in HTTP header to identify the OpenNMS monitor |
optional |
|
|
Set the virtual host field in HTTP header. In case of an HTTPS request, this is also the virtual domain to send as part of the TLS negotiation, known as server name indication (SNI) (See: RFC3546 section 3.1) |
|
|
|
The relative URL to call in the request. |
required |
|
|
Define the URL scheme as |
optional |
|
|
Set user info field in the HTTP header |
|
|
|
Set host field in HTTP header |
optional |
|
|
Communication requires a connection to an IPv6 address. ( |
|
|
|
Communication requires a connection to an IPv4 address. ( |
|
|
|
Enable or disable SSL certificate verification for HTTPS tests. Please use this option carefully, for self-signed certificates import the CA certificate in the JVM and don’t just disable it. |
optional |
|
|
Port of the web server connecting to |
optional |
|
|
?? |
|
|
|
Text to look for in the response body. This is a Regular Expression matched against every line, and it will be considered a failure at the first match and sets the service with this monitor Down. |
|
|
|
The failure message is used to construct the reason code.
|
|
|
|
Text to look for in the response body. This is a Regular Expression matched against every line, and it will be considered a success at the first match and sets the service with this monitor Up. |
optional |
|
|
The relative URL which must be loaded for the request to be considered successful. |
optional |
|
|
Range for allowed HTTP error codes from the response. |
|
|
|
Assign the value of a regex match group to a session variable with a user-defined name. The match group is identified by number and must be zero or greater. |
|
|
|
A comma-separated list of acceptable HTTP response code ranges ( |
optional |
|
If you set requireIPv4 and requireIPv6 false, the host IP for connection will be resolved from system name resolver and the associated IP address from the IP interface is ignored.
|
| Variable | Description |
|---|---|
|
Nodelabel of the node the monitor is associated to. |
Session variables
It is possible to assign strings from a retrieved page to variables that can be used in page parameters later in the same sequence.
First, specify one or more capturing groups in the successMatch expression (see Java Class Pattern for more information on regular expressions in Java).
The captured values can then be assigned to variable names by using the session-variable parameter, and used in a later page load.
Per-page response times
It is possible to collect response times for individual pages in a sequence.
To use this functionality, a ds-name attribute must be added to each page whose load time should be tracked.
The response time for each page will be stored in the same RRD file specified for the service via the rrd-base-name parameter under the specified datasource name.
You will need to delete existing RRD files and let them be recreated with the new list of datasources when you add a ds-name attribute to a page in a sequence that is already storing response time data.
|
Examples
The following example shows how to monitor the OpenNMS web application using several mechanisms.
It first does an HTTP GET of ${ipaddr}/opennms (following redirects as a browser would) and then checks to ensure that the resulting page has the phrase Password on it.
Next, a login is attempted using HTTP POST to the relative URL for submitting form data (usually, the URL which the form action points to).
The parameters (j_username and j_password) indicate the form’s data and values to be submitted.
Furthermore a custom header (foo) is set for demonstration purposes.
After getting the resulting page, first the expression specified in the page’s failureMatch attribute is verified, which when found anywhere on the page indicates that the page has failed.
If the failureMatch expression is not found in the resulting page, then the expression specified in the page’s successMatch attribute is checked to ensure it matches the resulting page.
If the successMatch expression is not found on the page, then the page fails.
If the monitor was able to successfully login, then the next page is processed.
In the example, the monitor navigates to the Event page, to ensure that the text Event Queries is found on the page.
Finally, the monitor calls the URL of the logout page to close the session.
By using the locationMatch parameter, it is verified that the logout was successful and a redirect was triggered.
Each page is checked to ensure its HTTP response code fits into the response-range, before the failureMatch, successMatch, and locationMatch expressions are evaluated.
|
<service name="OpenNMS-Web-Login" interval="30000" user-defined="true" status="on">
  <parameter key="retry" value="1"/>
  <parameter key="timeout" value="5000"/>
  <parameter key="rrd-repository" value="/opt/opennms/share/rrd/response"/>
  <parameter key="ds-name" value="opennmslogin"/>
  <parameter key="page-sequence">
    <page-sequence>
      <page path="/opennms/login.jsp"
            port="8980"
            successMatch="Password" />
      <page path="/opennms/j_spring_security_check"
            port="8980"
            method="POST">
        <parameter key="j_username" value="admin"/>
        <parameter key="j_password" value="admin"/>
        <header name="foo" value="bar"/>
      </page>
      <page path="/opennms/index.jsp"
            port="8980"
            successMatch="Log Out" />
      <page path="/opennms/event/index"
            port="8980" successMatch="Event Queries" />
      <page path="/opennms/j_spring_security_logout"
            port="8980"
            method="POST"
            response-range="300-399"
            locationMatch="/opennms" />
    </page-sequence>
  </parameter>
</service>

<monitor service="OpenNMS-Web-Login" class-name="org.opennms.netmgt.poller.monitors.PageSequenceMonitor"/><service name="OpenNMS-Web-Login" interval="30000" user-defined="true" status="on">
<parameter key="retry" value="1"/>
<parameter key="timeout" value="5000"/>
<parameter key="rrd-repository" value="/opt/opennms/share/rrd/response"/>
<parameter key="ds-name" value="opennmslogin"/>
<parameter key="page-sequence">
<page-sequence>
<page scheme="http"
host="ecomm.example.com"
port="80"
path="/ecomm/jsp/Login.jsp"
virtual-host="ecomm.example.com"
successMatch="eComm Login"
timeout="10000"
http-version="1.1"/>
<page scheme="https"
method="POST"
host="ecomm.example.com" port="443"
path="/ecomm/controller"
virtual-host="ecomm.example.com"
successMatch="requesttab_select.gif"
failureMessage="Login failed: ${1}"
timeout="10000"
http-version="1.1">
<parameter key="action_name" value="XbtnLogin"/>
<parameter key="session_timeout" value=""/>
<parameter key="userid" value="EXAMPLE"/>
<parameter key="password" value="econ"/>
</page>
<page scheme="http"
host="ecomm.example.com" port="80"
path="/econsult/controller"
virtual-host="ecomm.example.com"
successMatch="You have successfully logged out of eComm"
timeout="10000" http-version="1.1">
<parameter key="action_name" value="XbtnLogout"/>
</page>
</page-sequence>
</parameter>
</service>
<monitor service="OpenNMS-Web-Login" class-name="org.opennms.netmgt.poller.monitors.PageSequenceMonitor"/><service name="OpenNMS-Web-Login" interval="30000" user-defined="true" status="on">
<parameter key="retry" value="1"/>
<parameter key="timeout" value="5000"/>
<parameter key="rrd-repository" value="/opt/opennms/share/rrd/response"/>
<parameter key="ds-name" value="opennmslogin"/>
<parameter key="page-sequence">
<page-sequence name="opennms-login-seq-dynamic-credentials">
<page path="/opennms"
port="80"
virtual-host="demo.opennms.org"
successMatch="(?s)User:.*<strong>(.*?)</strong>.*?Password:.*?<strong>(.*?)</strong>">
<session-variable name="username" match-group="1" />
<session-variable name="password" match-group="2" />
</page>
<page path="/opennms/j_acegi_security_check"
port="80"
virtual-host="demo.opennms.org"
method="POST"
failureMatch="(?s)Your log-in attempt failed.*Reason: ([^<]*)"
failureMessage="Login Failed: ${1}"
successMatch="Log out">"
<parameter key="j_username" value="${username}" />
<parameter key="j_password" value="${password}" />
</page>
<page path="/opennms/event/index.jsp"
port="80"
virtual-host="demo.opennms.org"
successMatch="Event Queries" />
<page path="/opennms/j_acegi_logout"
port="80"
virtual-host="demo.opennms.org"
successMatch="logged off" />
</page-sequence>
</parameter>
</service>
<monitor service="OpenNMS-Web-Login" class-name="org.opennms.netmgt.poller.monitors.PageSequenceMonitor"/><service name="OpenNMS-Demo-Login" interval="300000" user-defined="true" status="on">
<parameter key="page-sequence">
<page-sequence>
<page path="/opennms"
port="80"
virtual-host="demo.opennms.org"
successMatch="(?s)User:.*<strong>(.*?)</strong>.*?Password:.*?<strong>(.*?)</strong>">
<session-variable name="username" match-group="1" />
<session-variable name="password" match-group="2" />
</page>
<page path="/opennms/j_acegi_security_check"
port="80"
virtual-host="demo.opennms.org"
method="POST"
successMatch="Log out">"
<parameter key="j_username" value="${username}" />
<parameter key="j_password" value="${password}" />
</page>
<page path="/opennms/j_acegi_logout"
port="80"
virtual-host="demo.opennms.org"
successMatch="logged off" />
</page-sequence>
</parameter>
</service>
<monitor service="OpenNMS-Demo-Login" class-name="org.opennms.netmgt.poller.monitors.PageSequenceMonitor"/><service name="OpenNMS-Login" interval="300000" user-defined="false" status="on">
<parameter key="rrd-repository" value="/opt/opennms/share/rrd/response"/>
<parameter key="rrd-base-name" value="opennmslogin"/>
<parameter key="ds-name" value="overall"/>
<parameter key="page-sequence">
<page-sequence>
<page path="/opennms/acegilogin.jsp"
port="8980"
ds-name="login-page"/>
<page path="/opennms/event/index.jsp"
port="8980"
ds-name="event-page"/>
</page-sequence>
</parameter>
</service>
<monitor service="OpenNMS-Login" class-name="org.opennms.netmgt.poller.monitors.PageSequenceMonitor"/>5.6.37. PercMonitor
This monitor tests the status of a PERC RAID array.
The monitor first polls the RAID-Adapter-MIB::logicaldriveTable (1.3.6.1.4.1.3582.1.1.2) to retrieve the status of the RAID array you want to monitor. If the value of the status object of the corresponding logicaldriveEntry is not 2, the array is degraded and the monitor further polls the RAID-Adapter-MIB::physicaldriveTable (1.3.6.1.4.1.3582.1.1.3) to detect the failed drive(s).
| This monitor requires the outdated persnmpd software to be installed on the polled nodes. Please prefer using OmsaStorageMonitor monitor where possible. |
Monitor facts
Class Name |
|
Remote Enabled |
false (relies on SNMP configuration) |
Configuration and Usage
| Parameter | Description | Required | Default value |
|---|---|---|---|
|
The RAID array you want to monitor. |
optional |
|
|
The UDP port to connect to |
optional |
|
This monitor implements the Common Configuration Parameters.
Examples
<!-- Monitor 1st RAID arrays using configuration from snmp-config.xml -->
<service name="PERC" interval="300000" user-defined="false" status="on" />

<monitor service="PERC" class-name="org.opennms.netmgt.poller.monitors.PercMonitor" />
5.6.38. Pop3Monitor
The POP3 monitor tests for POP3 service availability on a node.
The monitor first tries to establish a TCP connection on the specified port.
If a connection is established, a service banner should have been received.
The monitor makes sure the service banner is a valid POP3 banner (ie: starts with +OK).
If the banner is valid, the monitor sends a QUIT POP3 command and makes sure the service answers with a valid response (ie: a response that starts with +OK).
The service is considered available if the service’s answer to the QUIT command is valid.
The behaviour can be simulated with telnet:
$ telnet mail.opennms.org 110
Trying 192.168.0.100
Connected to mail.opennms.org.
Escape character is '^]'.
+OK <21860.1076718099@mail.opennms.org>
quit
+OK
Connection closed by foreign host.
Monitor facts
Class Name |
|
Remote Enabled |
true |
Configuration and Usage
| Parameter | Description | Required | Default value |
|---|---|---|---|
|
TCP port to connect to. |
optional |
|
|
Number of attempts to find the service available. |
optional |
|
|
If set to |
optional |
|
This monitor implements the Common Configuration Parameters.
Examples
<service name="POP3" interval="300000" user-defined="false" status="on">
  <parameter key="retry" value="2"/>
  <parameter key="timeout" value="3000"/>
  <parameter key="rrd-repository" value="/var/lib/opennms/rrd/response"/>
  <parameter key="rrd-base-name" value="pop3"/>
  <parameter key="ds-name" value="pop3"/>
</service>
<monitor service="POP3" class-name="org.opennms.netmgt.poller.monitors.Pop3Monitor"/>
5.6.39. PrTableMonitor
The PrTableMonitor monitor tests the prTable of a Net-SNMP agent.
A table containing information on running programs/daemons configured for monitoring in the snmpd.conf file of the agent. Processes violating the number of running processes required by the agent’s configuration file are flagged with numerical and textual errors.
The monitor looks up the prErrorFlag entries of this table. If the value of a prErrorFlag entry in this table is set to "1" the service is considered unavailable.
An Error flag to indicate trouble with a process. It goes to 1 if there is an error, 0 if no error.
Monitor facts
Class Name |
|
Remote Enabled |
false |
Configuration and Usage
| Parameter | Description | Required | Default value |
|---|---|---|---|
|
The port to which connection shall be tried. |
optional |
from |
|
Deprecated.
Same as |
optional |
from |
This monitor implements the Common Configuration Parameters.
Examples
<!-- Overriding default SNMP config -->
<service name="Process-Table" interval="300000" user-defined="false" status="on">
  <parameter key="retry" value="3"/>
  <parameter key="timeout" value="5000"/>
</service>

<monitor service="Process-Table" class-name="org.opennms.netmgt.poller.monitors.PrTableMonitor" />
UCD-SNMP-MIB
The UCD-SNMP-MIB may be found here.
5.6.40. RadiusAuthMonitor
This monitor allows to test the functionality of the RADIUS authentication system. The availability is tested by sending an AUTH packet to the RADIUS server. If a valid ACCEPT response is received, the RADIUS service is up and considered as available. This monitor implements placeholder substitution in parameter values.
| To use this monitor it is required to install the RADIUS protocol for OpenNMS Horizon. |
For RPM-based distributions:
yum install opennms-plugin-protocol-radius
For Debian-based distributions:
apt-get install opennms-plugin-protocol-radius
The test is similar to test the behavior of a RADIUS server by evaluating the result with the command line tool radtest.
root@vagrant:~# radtest "John Doe" hello 127.0.0.1 1812 radiuspassword
Sending Access-Request of id 49 to 127.0.0.1 port 1812
	User-Name = "John Doe"
	User-Password = "hello"
	NAS-IP-Address = 127.0.0.1
	NAS-Port = 1812
	Message-Authenticator = 0x00000000000000000000000000000000
rad_recv: Access-Accept packet from host 127.0.0.1 port 1812, id=49, length=37 (1)
Reply-Message = "Hello, John Doe"| 1 | The Access-Accept message which is evaluated by the monitor. |
Monitor facts
Class Name |
|
Remote Enabled |
false |
Configuration and Usage
| Parameter | Description | Required | Default value | Placeholder substitution |
|---|---|---|---|---|
|
Time in milliseconds to wait for the RADIUS service. |
optional |
|
No |
|
This is a placeholder for the second optional monitor parameter description. |
optional |
|
No |
|
RADIUS authentication port. |
optional |
|
No |
|
RADIUS accounting port. |
optional |
|
No |
|
Username to test the authentication |
optional |
|
Yes |
|
Password to test the authentication |
optional |
|
Yes |
|
The RADIUS shared secret used for communication between the client/NAS and the RADIUS server. |
optional |
|
Yes |
|
RADIUS authentication type. The following authentication types are supported:
|
optional |
|
No |
|
The Network Access Server identifier originating the Access-Request. |
optional |
|
Yes |
|
When using EAP-TTLS authentication, this property indicates the tunnelled authentication type.
Only |
optional |
|
No |
|
Username for the tunnelled |
optional |
|
Yes |
This monitor implements the Common Configuration Parameters.
Examples
Example configuration how to configure the monitor in the poller-configuration.xml.
<service name="Radius-Authentication" interval="300000" user-defined="false" status="on">
  <parameter key="retry" value="3" />
  <parameter key="timeout" value="3000" />
  <parameter key="user" value="John Doe" />
  <parameter key="password" value="hello" />
  <parameter key="secret" value="radiuspassword" />
  <parameter key="rrd-repository" value="/var/lib/opennms/rrd/response" />
  <parameter key="ds-name" value="radiusauth" />
</service>

<monitor service="Radius-Authentication" class-name="org.opennms.protocols.radius.monitor.RadiusAuthMonitor" />
5.6.41. SmbMonitor
This monitor is used to test the NetBIOS over TCP/IP name resolution in Microsoft Windows environments. The monitor tries to retrieve a NetBIOS name for the IP address of the interface. Name services for NetBIOS in Microsoft Windows are provided on port 137/UDP or 137/TCP.
The service uses the IP address of the interface, where the monitor is assigned to. The service is up if for the given IP address a NetBIOS name is registered and can be resolved.
For troubleshooting see the usage of the Microsoft Windows command line tool nbtstat or on Linux nmblookup.
| Microsoft deprecated the usage of NetBIOS. Since Windows Server 2000 DNS is used as the default name resolution. |
Monitor facts
Class Name |
|
Remote Enabled |
false |
Configuration and Usage
| Parameter | Description | Required | Default value |
|---|---|---|---|
|
Try to get the NetBIOS node status type for the given address |
optional |
|
This monitor implements the Common Configuration Parameters.
Examples
Some example configuration how to configure the monitor in the poller-configuration.xml.
<service name="SMB" interval="300000" user-defined="false" status="on">
  <parameter key="retry" value="1"/>
  <parameter key="timeout" value="3000"/>
</service>

<monitor service="SMB" class-name="org.opennms.netmgt.poller.monitors.SmbMonitor"/>
5.6.42. SmtpMonitor
The SMTP monitor tests for SMTP service availability on a node. The monitor first tries to establish a TCP connection on the specified port. If a connection is established, a service banner should have been received. The monitor makes sure the service banner is a valid SMTP banner (starts with "220"). If the banner is valid, the monitor sends a HELO SMTP command, identifying itself with the hostname of the OpenNMS server, and makes sure the service answers with a valid response (starts with "250"). If the response to the HELO is valid, the monitor issues a QUIT SMTP command. The service is considered available if the service’s answer to the HELO command is valid (starts with "221").
The behaviour can be simulated with telnet or netcat:
$ nc -v gmail-smtp-in.l.google.com 25
Ncat: Version 7.60 ( https://nmap.org/ncat )
Ncat: Connected to 2607:f8b0:4002:c06::1a:25.
220 mx.google.com ESMTP j17-v6si13545102ywb.87 - gsmtp
HELO opennms.com
250 mx.google.com at your service
QUIT
221 2.0.0 closing connection j17-v6si13545102ywb.87 - gsmtp
Monitor facts
Class Name |
|
Remote Enabled |
true |
Configuration and Usage
| Parameter | Description | Required | Default value |
|---|---|---|---|
|
TCP port to connect to. |
optional |
|
|
Number of attempts to find the service available. |
optional |
|
|
Timeout in milliseconds for the underlying socket’s connect and read operations. |
optional |
|
Examples
<service name="SMTP" interval="300000" user-defined="false" status="on">
  <parameter key="retry" value="1" />
  <parameter key="timeout" value="3000" />
  <parameter key="port" value="25" />
  <parameter key="rrd-repository" value="${install.share.dir}/rrd/response" />
  <parameter key="rrd-base-name" value="smtp" />
  <parameter key="ds-name" value="smtp" />
</service>
<monitor service="SMTP" class-name="org.opennms.netmgt.poller.monitors.SmtpMonitor" />
5.6.43. SnmpMonitor
The SNMP monitor gives a generic possibility to monitor states and results from SNMP agents. This monitor has two basic operation modes:
-
Test the response value of one specific OID (scalar object identifier);
-
Test multiple values in a whole table.
To decide which mode should be used, the walk and match-all parameters are used.
See the Operating mode selection'' and Monitor specific parameters for the SnmpMonitor'' tables below for more information about these operation modes.
| walk | match-all | Operating mode |
|---|---|---|
|
|
tabular, all values must match |
|
tabular, any value must match |
|
|
specifies that the value of at least minimum and at most maximum objects encountered in |
|
|
|
scalar |
|
scalar |
|
|
tabular, between |
| This monitor can’t be used on the OpenNMS Horizon Remote Poller. It is currently not possible for the Remote Poller to have access to the SNMP configuration of a central OpenNMS Horizon. |
Monitor facts
Class Name |
|
Remote Enabled |
false |
When the monitor is configured to persist the response time, it will count the total amount of time spent until a successful response is obtained, including the retries. It won’t store the time spent during the last successful attempt.
Configuration and Usage
| Parameter | Description | Required | Default value |
|---|---|---|---|
|
Specifies that the value monitored should be compared against its hexadecimal representation. Useful when the monitored value is a string containing non-printable characters. |
optional |
|
|
Can be set to: |
optional |
|
|
Valid only when |
optional |
|
|
Valid only when |
optional |
|
|
The object identifier of the MIB object to monitor. If no other parameters are present, the monitor asserts that the agent’s response for this object must include a valid value (as opposed to an error, no-such-name, or end-of-view condition) that is non-null. |
optional |
|
|
The value to be compared against the observed value of the monitored object.
Note: Comparison will always succeed if either the |
optional |
|
|
The operator to be used for comparing the monitored object against the |
optional |
|
|
Destination port where the SNMP requests shall be sent. |
optional |
from |
|
A user-provided template used for the monitor’s reason code if the service is unvailable. Defaults to a reasonable value if unset. See below for an explanation of the possible template parameters. |
optional |
depends on operation mode |
|
Deprecated Same as |
optional |
from |
|
|
optional |
|
This monitor implements the Common Configuration Parameters.
| Variable | Description |
|---|---|
|
Value of the |
|
IP address polled. |
|
Value of the |
|
When |
|
Value of the |
|
Value of the |
|
Polled value that made the monitor succeed or fail. |
|
Value of the |
|
Value of the |
|
Value of the |
|
Value of the |
|
Value of the |
|
Value of the |
|
Value of the |
Example for monitoring scalar object
As a working example we want to monitor the thermal system fan status which is provided as a scalar object ID.
cpqHeThermalSystemFanStatus .1.3.6.1.4.1.232.6.2.6.4.0
The manufacturer MIB gives the following information:
SYNTAX 	INTEGER  {
    other    (1),
    ok       (2),
    degraded (3),
    failed   (4)
}
ACCESS 	read-only
DESCRIPTION
"The status of the fan(s) in the system.

This value will be one of the following:
other(1)
Fan status detection is not supported by this system or driver.

ok(2)
All fans are operating properly.

degraded(3)
A non-required fan is not operating properly.

failed(4)
A required fan is not operating properly.

If the cpqHeThermalDegradedAction is set to shutdown(3) the
system will be shutdown if the failed(4) condition occurs."
The SnmpMonitor is configured to test if the fan status returns ok(2). If so, the service is marked as up. Any other value indicates a problem with the thermal fan status and marks the service down.
<service name="HP-Insight-Fan-System" interval="300000" user-defined="false" status="on">
    <parameter key="oid" value=".1.3.6.1.4.1.232.6.2.6.4.0"/>(1)
    <parameter key="operator" value="="/>(2)
    <parameter key="operand" value="2"/>(3)
    <parameter key="reason-template" value="System fan status is not ok. The state should be ok(${operand}) the observed value is ${observedValue}. Please check your HP Insight Manager. Syntax: other(1), ok(2), degraded(3), failed(4)"/>(4)
</service>

<monitor service="HP-Insight-Fan-System" class-name="org.opennms.netmgt.poller.monitors.SnmpMonitor" />| 1 | Scalar object ID to test |
| 2 | Operator for testing the response value |
| 3 | Integer 2 as operand for the test |
| 4 | Encode MIB status in the reason code to give more detailed information if the service goes down |
Example test SNMP table with all matching values
The second mode shows how to monitor values of a whole SNMP table. As a practical use case the status of a set of physical drives is monitored. This example configuration shows the status monitoring from the CPQIDA-MIB.
We use as a scalar object id the physical drive status given by the following tabular OID:
cpqDaPhyDrvStatus .1.3.6.1.4.1.232.3.2.5.1.1.6
SYNTAX 	INTEGER  {
    other             (1),
    ok                (2),
    failed            (3),
    predictiveFailure (4)
}
ACCESS 	read-only
DESCRIPTION
Physical Drive Status.
This shows the status of the physical drive.
The following values are valid for the physical drive status:

other (1)
 Indicates that the instrument agent does not recognize
 the drive.  You may need to upgrade your instrument agent
 and/or driver software.

ok (2)
 Indicates the drive is functioning properly.

failed (3)
 Indicates that the drive is no longer operating and
 should be replaced.

predictiveFailure(4)
 Indicates that the drive has a predictive failure error and
 should be replaced.
The configuration in our monitor will test all physical drives for status ok(2).
<service name="HP-Insight-Drive-Physical" interval="300000" user-defined="false" status="on">
    <parameter key="oid" value=".1.3.6.1.4.1.232.3.2.5.1.1.6"/>(1)
    <parameter key="walk" value="true"/>(2)
    <parameter key="operator" value="="/>(3)
    <parameter key="operand" value="2"/>(4)
    <parameter key="match-all" value="true"/>(5)
    <parameter key="reason-template" value="One or more physical drives are not ok. The state should be ok(${operand}) the observed value is ${observedValue}. Please check your HP Insight Manager. Syntax: other(1), ok(2), failed(3), predictiveFailure(4), erasing(5), eraseDone(6), eraseQueued(7)"/>(6)
</service>

<monitor service="HP-Insight-Drive-Physical" class-name="org.opennms.netmgt.poller.monitors.SnmpMonitor" />| 1 | OID for SNMP table with all physical drive states |
| 2 | Enable walk mode to test every entry in the table against the test criteria |
| 3 | Test operator for integer |
| 4 | Integer 2 as operand for the test |
| 5 | Test in walk mode has to be passed for every entry in the table |
| 6 | Encode MIB status in the reason code to give more detailed information if the service goes down |
Example test SNMP table with all matching values
This example shows how to use the SnmpMonitor to test if the number of static routes are within a given boundary. The service is marked as up if at least 3 and at maxium 10 static routes are set on a network device. This status can be monitored by polling the table ipRouteProto from the RFC1213-MIB2.
ipRouteProto 1.3.6.1.2.1.4.21.1.9
The MIB description gives us the following information:
SYNTAX 	INTEGER  {
    other(1),
    local(2),
    netmgmt(3),
    icmp(4),
    egp(5),
    ggp(6),
    hello(7),
    rip(8),
    is-is(9),
    es-is(10),
    ciscoIgrp(11),
    bbnSpfIgp(12),
    ospf(13),
    bgp(14)}
}
ACCESS 	read-only
DESCRIPTION
"The routing mechanism via which this route was learned.
Inclusion of values for gateway routing protocols is not
intended to imply that hosts should support those protocols."
To monitor only local routes, the test should be applied only on entries in the ipRouteProto table with value 2.
The number of entries in the whole ipRouteProto table has to be counted and the boundaries on the number has to be applied.
<service name="All-Static-Routes" interval="300000" user-defined="false" status="on">
 <parameter key="oid" value=".1.3.6.1.2.1.4.21.1.9" />(1)
 <parameter key="walk" value="true" />(2)
 <parameter key="operator" value="=" />(3)
 <parameter key="operand" value="2" />(4)
 <parameter key="match-all" value="count" />(5)
 <parameter key="minimum" value="3" />(6)
 <parameter key="maximum" value="10" />(7)
</service>

<monitor service="All-Static-Routes" class-name="org.opennms.netmgt.poller.monitors.SnmpMonitor" />| 1 | OID for SNMP table ipRouteProto |
| 2 | Enable walk mode to test every entry in the table against the test criteria |
| 3 | Test operator for integer |
| 4 | Integer 2 as operand for testing local route entries |
| 5 | Test in walk mode has is set to count to get the number of entries in the table regarding operator and operand |
| 6 | Lower count boundary set to 3 |
| 7 | High count boundary is set to 10 |
5.6.44. SshMonitor
The SshMonitor tests the availability of a SSH service. During the poll an attempt is made to connect on the specified port. If the connection request is successful, then the service is considered up. Optionaly, the banner line generated by the service may be parsed and compared against a pattern before the service is considered up.
Monitor facts
Class Name |
|
Remote Enabled |
true |
Configuration and Usage
| Parameter | Description | Required | Default value |
|---|---|---|---|
|
Regular expression to be matched against the service’s banner. |
optional |
|
|
The client banner that OpenNMS Horizon will use to identify itself on the service. |
optional |
|
|
Regular expression to be matched against the service’s banner. |
optional |
|
|
TCP port to which SSH connection shall be tried. |
optional |
|
|
Number of attempts to establish the SSH connnection. |
optional |
|
This monitor implements the Common Configuration Parameters.
Examples
<service name="SSH" interval="300000" user-defined="false" status="on">
  <parameter key="retry" value="1"/>
  <parameter key="banner" value="SSH"/>
  <parameter key="client-banner" value="OpenNMS poller"/>
  <parameter key="timeout" value="5000"/>
  <parameter key="rrd-repository" value="/var/lib/opennms/rrd/response"/>
  <parameter key="rrd-base-name" value="ssh"/>
  <parameter key="ds-name" value="ssh"/>
</service>
<monitor service="SSH" class-name="org.opennms.netmgt.poller.monitors.SshMonitor"/>
5.6.45. SSLCertMonitor
This monitor is used to test if a SSL certificate presented by a remote network server are valid. A certificate is invalid if its initial time is prior to the current time, or if the current time is prior to 7 days (configurable) before the expiration time.
You can simulate the behavior by running a command like this:
echo | openssl s_client -connect <site>:<port> 2>/dev/null | openssl x509 -noout -dates
The output shows you the time range a certificate is valid:
notBefore=Dec 24 14:11:34 2013 GMT
notAfter=Dec 25 10:37:40 2014 GMT
You can configure a threshold in days applied on the notAfter date.
While the monitor is mainly useful for plain SSL sockets, the monitor does provide limited support for STARTTLS protocols by providing the user with the ability to specify a STARTTLS message to be sent prior to the SSL negotiation and a regular expression to match to the response received from the server. An additional preliminary message and response regular expression pair is available for protocols that require it (such as XMPP).
This monitor implements placeholder substitution in parameter values.
Monitor facts
Class Name |
|
Remote Enabled |
true |
Configuration and Usage
| Parameter | Description | Required | Default value | Placeholder substition |
|---|---|---|---|---|
|
TCP port for the service with SSL certificate. |
required |
|
No |
|
Number of attempts to get the certificate state |
optional |
|
No |
|
Number of days before the certificate expires that we mark the service as failed. |
optional |
|
No |
|
This is the DNS hostname to send as part of the TLS negotiation, known as server name indication (SNI) (See: RFC3546 section 3.1) |
optional |
|
No |
|
Preliminary message to send to server prior to STARTTLS command. |
optional |
`` |
Yes |
|
Regular expression which must match response to preliminary message sent to server prior to STARTTLS command. |
optional |
`` |
Yes |
|
STARTTLS command. |
optional |
`` |
Yes |
|
Regular expression which must match response to STARTTLS command sent to server. |
optional |
`` |
Yes |
This monitor implements the Common Configuration Parameters.
| Variable | Description |
|---|---|
|
The node’s IP-Address |
|
The node ID |
|
Label of the node the monitor is associated to. |
|
The service name |
| The monitor has limited support for communicating on other protocol layers above the SSL session layer. The STARTTLS support has only been tested with a single XMPP server. It is not known if the same approach will prove useful for other use cases, like sending a Host header for HTTPS, or issue a STARTTLS command for IMAP, POP3, SMTP, FTP, LDAP, or NNTP. |
Examples
The following examples show how to monitor SSL certificates on services like IMAPS, SMTPS and HTTPS as well as an example use of the STARTTLS feature for XMPP.
If the certificates expire within 30 days the service goes down and indicates this issue in the reason of the monitor.
In this example the monitoring interval is reduced to test the certificate every 2 hours (7,200,000 ms).
Configuration in poller-configuration.xml is as the following:
<service name="SSL-Cert-IMAPS-993" interval="7200000" user-defined="false" status="on">
    <parameter key="retry" value="2"/>
    <parameter key="timeout" value="2000"/>
    <parameter key="port" value="993"/>
    <parameter key="days" value="30"/>
</service>
<service name="SSL-Cert-SMTPS-465" interval="7200000" user-defined="false" status="on">
    <parameter key="retry" value="2"/>
    <parameter key="timeout" value="2000"/>
    <parameter key="port" value="465"/>
    <parameter key="days" value="30"/>
</service>
<service name="SSL-Cert-HTTPS-443" interval="7200000" user-defined="false" status="on">
    <parameter key="retry" value="2"/>
    <parameter key="timeout" value="3000"/>
    <parameter key="port" value="443"/>
    <parameter key="days" value="30"/>
    <parameter key="server-name" value="${nodelabel}.example.com"/>
</service>
<service name="XMPP-STARTTLS-5222" interval="7200000" user-defined="false" status="on">
    <parameter key="retry" value="2"/>
    <parameter key="timeout" value="3000"/>
    <parameter key="port" value="5222"/>
    <parameter key="days" value="30"/>
    <parameter key="starttls-preamble" value="<stream:stream xmlns:stream='http://etherx.jabber.org/streams' xmlns='jabber:client' to='{ipAddr}' version='1.0'>"/>
    <parameter key="starttls-preamble-response" value="^.*starttls.*$"/>
    <parameter key="starttls-start" value="<starttls xmlns='urn:ietf:params:xml:ns:xmpp-tls'/>"/>
    <parameter key="starttls-start-response" value="^.*starttls.*$"/>
</service>

<monitor service="SSL-Cert-IMAPS-993" class-name="org.opennms.netmgt.poller.monitors.SSLCertMonitor" />
<monitor service="SSL-Cert-SMTPS-465" class-name="org.opennms.netmgt.poller.monitors.SSLCertMonitor" />
<monitor service="SSL-Cert-HTTPS-443" class-name="org.opennms.netmgt.poller.monitors.SSLCertMonitor" />
<monitor service="XMPP-STARTTLS-5222" class-name="org.opennms.netmgt.poller.monitors.SSLCertMonitor" />
5.6.46. StrafePingMonitor
This monitor is used to monitor packet delay variation to a specific endpoint using ICMP. The main use case is to monitor a WAN end point and visualize packet loss and ICMP packet round trip time deviation. The StrafePingMonitor performs multiple ICMP echo requests (ping) and stores the response-time of each as well as the packet loss, in a RRD file. Credit is due to Tobias Oetiker, as this graphing feature is an adaptation of the SmokePing tool that he developed.
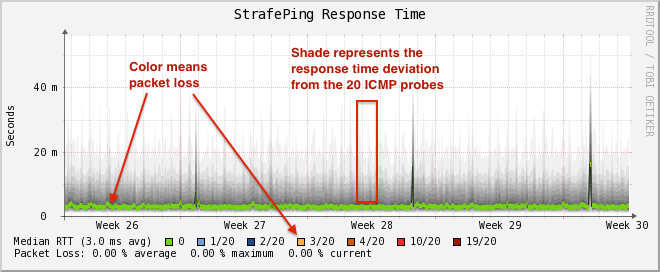
Monitor facts
Class Name |
|
Remote Enabled |
false |
Configuration and Usage
Monitor specific parameters for the StrafePingMonitor
| Parameter | Description | Required | Default value |
|---|---|---|---|
|
Time in milliseconds to wait before assuming that a packet has not responded |
optional |
|
|
The number of retries to attempt when a packet fails to respond in the given timeout |
optional |
|
|
The number of pings to attempt each interval |
required |
|
|
The number of pings that need to fail for the service to be considered down |
required |
|
|
Whether to set the "Don’t Fragment" bit on outgoing packets |
optional |
|
|
DSCP traffic-control value. |
optional |
|
|
Number of bytes of the ICMP packet to send. |
optional |
|
|
Time in milliseconds to wait between each ICMP echo-request packet |
required |
|
|
The location to write RRD data. Generally, you will not want to change this from default |
required |
|
|
The name of the RRD file to write (minus the extension, |
required |
|
This monitor implements the Common Configuration Parameters.
Examples
The StrafePingMonitor is typically used on WAN connections and not activated for every ICMP enabled device in your network.
Further this monitor is much I/O heavier than just a simple RRD graph with a single ICMP response time measurement.
By default you can find a separate poller package in the 'poller-configuration.xml' called strafer.
Configure the include-range or a filter to enable monitoring for devices with the service StrafePing.
| Don’t forget to assign the service StrafePing on the IP interface to be activated. |
The following example enables the monitoring for the service StrafePing on IP interfaces in the range 10.0.0.1 until 10.0.0.20.
Additionally the Nodes have to be in a surveillance category named Latency.
<package name="strafer" >
   <filter>categoryName == 'Latency'</filter>
   <include-range begin="10.0.0.1" end="10.0.0.20"/>
   <rrd step="300">
     <rra>RRA:AVERAGE:0.5:1:2016</rra>
     <rra>RRA:AVERAGE:0.5:12:1488</rra>
     <rra>RRA:AVERAGE:0.5:288:366</rra>
     <rra>RRA:MAX:0.5:288:366</rra>
     <rra>RRA:MIN:0.5:288:366</rra>
   </rrd>
   <service name="StrafePing" interval="300000" user-defined="false" status="on">
     <parameter key="retry" value="0"/>
     <parameter key="timeout" value="3000"/>
     <parameter key="ping-count" value="20"/>
     <parameter key="failure-ping-count" value="20"/>
     <parameter key="wait-interval" value="50"/>
     <parameter key="rrd-repository" value="/opt/opennms/share/rrd/response"/>
     <parameter key="rrd-base-name" value="strafeping"/>
   </service>
   <downtime interval="30000" begin="0" end="300000"/>
   <downtime interval="300000" begin="300000" end="43200000"/>
   <downtime interval="600000" begin="43200000" end="432000000"/>
   <downtime begin="432000000" delete="true"/>
 </package>
 <monitor service="StrafePing" class-name="org.opennms.netmgt.poller.monitors.StrafePingMonitor"/>
5.6.47. TcpMonitor
This monitor is used to test IP Layer 4 connectivity using TCP.
The monitor establishes an TCP connection to a specific port.
To test the availability of the service, the greetings banner of the application is evaluated.
The behavior is similar to a simple test using the telnet command as shown in the example.
telnetroot@vagrant:~# telnet 127.0.0.1 22
Trying 127.0.0.1...
Connected to 127.0.0.1.
Escape character is '^]'.
SSH-2.0-OpenSSH_6.6.1p1 Ubuntu-2ubuntu2 (1)| 1 | Service greeting banner |
Monitor facts
Class Name |
|
Remote Enabled |
true |
Configuration and Usage
| Parameter | Description | Required | Default value |
|---|---|---|---|
|
TCP port of the application. |
required |
|
|
Number of retries before the service is marked as down. |
optional |
|
|
Evaluation of the service connection banner with regular expression. By default any banner result is valid. |
optional |
|
This monitor implements the Common Configuration Parameters.
Examples
This example shows to test if the ICA service is available on TCP port 1494.
The test evaluates the connection banner starting with ICA.
<service name="TCP-Citrix-ICA" interval="300000" user-defined="false" status="on">
  <parameter key="retry" value="0" />
  <parameter key="banner" value="ICA" />
  <parameter key="port" value="1494" />
  <parameter key="timeout" value="3000" />
  <parameter key="rrd-repository" value="/var/lib/opennms/rrd/response" />
  <parameter key="rrd-base-name" value="tcpCitrixIca" />
  <parameter key="ds-name" value="tcpCitrixIca" />
</service>

<monitor service="TCP-Citrix-ICA" class-name="org.opennms.netmgt.poller.monitors.TcpMonitor" />
5.6.48. SystemExecuteMonitor
If it is required to execute a system call or run a script to determine a service status, the SystemExecuteMonitor can be used.
It is calling a script or system command, if required it provides additional arguments to the call.
To determine the status of the service the SystemExecuteMonitor can rely on 0 or a non-0 exit code of system call.
As an alternative, the output of the system call can be matched against a banner.
If the banner is part of the output the status is interpreted as up.
If the banner is not available in the output the status is determined as down.
Monitor facts
Class Name |
|
Remote Enabled |
true |
Configuration and Usage
| Parameter | Description | Required | Default value |
|---|---|---|---|
|
The system-call to execute. |
required |
|
|
The arguments to hand over to the system-call. It supports variable replacement, see below. |
optional |
|
|
A string that is match against the output of the system-call. If the output contains the banner, the service is determined as UP. |
optional |
|
The parameter args supports variable replacement for the following set of variables.
| Providing always a script output with a more detailed test error makes it easier to diagnose the problem when the nodeLostDown event occurs. |
This monitor implements the Common Configuration Parameters.
| Variable | Description |
|---|---|
|
Timeout in milliseconds, based on config of the service. |
|
Timeout in seconds, based on config of the service. |
|
Amount of retries based on config of the service. |
|
Service name based on the config of the service. |
|
IP-address of the interface the service is bound to. |
|
Nodeid of the node the monitor is associated to. |
|
Nodelabel of the node the monitor is associated to. |
Examples
Placeholder usage
<parameter key="args" value="-i ${ipaddr} -t ${timeout}"/>
<parameter key="args" value="http://${nodelabel}/${svcname}/static"/>
Exit status example
<service name="Script_Example" interval="300000" user-defined="true" status="on">
  <parameter key="script" value="/opt/opennms/contrib/Script_Example.sh"/>
  <parameter key="timeout" value="5000"/>
</service>

<monitor service="Script_Example" class-name="org.opennms.netmgt.poller.monitors.SystemExecuteMonitor"/>
#!/usr/bin/env bash
# ...some test logic
RESULT="TEST OK"
if [[ "TEST OK" == "${RESULT}" ]]; then
echo "This test passed"
exit 0
else
echo "This test failed because of ..."
exit 1
fiBanner matching example
<service name="Script_Example" interval="300000" user-defined="true" status="on">
  <parameter key="script" value="/opt/opennms/contrib/Script_Example.sh"/>
  <parameter key="banner" value="PASSED"/>
  <parameter key="timeout" value="5000"/>
</service>

<monitor service="Script_Example" class-name="org.opennms.netmgt.poller.monitors.SystemExecuteMonitor"/>
#!/usr/bin/env bash
# ...some test logic
RESULT="TEST OK"
if [[ "TEST OK" == "${RESULT}" ]]; then
echo "PASSED"
else
echo "FAILED"
fiSystemExecuteMonitor vs GpMonitor
The SystemExecuteMonitor is the successor of the GpMonitor. The main differences are:
-
Variable replacement for the parameter args
-
There are no fixed arguments handed to the system-call
-
The SystemExecuteMonitor supports RemotePoller deployment
To migrate services from the GpMonitor to the SystemExecuteMonitor it is required to alter the parameter args.
To match the arguments called hoption for the hostAddress and toption for the timeoutInSeconds.
The args string that matches the GpMonitor call looks like this:
<parameter key="args" value="--hostname ${ipaddr} --timeout ${timeoutsec}" />To migrate the GpMonitor parameters hoption and toption just replace the --hostname and --timeout directly in the args key.
5.6.49. VmwareCimMonitor
This monitor is part of the VMware integration provided in Provisiond. The monitor is specialized to test the health status provided from all Host System (host) sensor data.
| This monitor is only executed if the host is in power state on. |
| This monitor requires to import hosts with Provisiond and the VMware import. OpenNMS Horizon requires network access to VMware vCenter and the hosts. To get the sensor data the credentials from vmware-config.xml for the responsible vCenter is used. The following asset fields are filled from Provisiond and is provided by VMware import feature: VMware Management Server, VMware Managed Entity Type and the foreignId which contains an internal VMware vCenter Identifier. |
The global health status is evaluated by testing all available host sensors and evaluating the state of each sensor. A sensor state could be represented as the following:
-
Unknown(0)
-
OK(5)
-
Degraded/Warning(10)
-
Minor failure(15)
-
Major failure(20)
-
Critical failure(25)
-
Non-recoverable error(30)
The service is up if all sensors have the status OK(5). If any sensor gives another status then OK(5) the service is marked as down. The monitor error reason contains a list of all sensors which not returned status OK(5).
| In case of using Distributed Power Management the standBy state forces a service down. The health status is gathrered with a direct connection to the host and in stand by this connection is unavailable and the service is down. To deal with stand by states, the configuration ignoreStandBy can be used. In case of a stand by state, the service is considered as up. |
state can be changed see the ignoreStandBy configuration parameter.
Monitor facts
Class Name |
|
Remote Enabled |
false |
Configuration and Usage
| Parameter | Description | Required | Default value |
|---|---|---|---|
|
Number of retries before the service is marked as down. |
optional |
|
|
Treat power state standBy as up. |
optional |
|
This monitor implements the Common Configuration Parameters.
Examples
Some example configuration how to configure the monitor in the poller-configuration.xml.
<service name="VMwareCim-HostSystem" interval="300000" user-defined="false" status="on">
  <parameter key="retry" value="2"/>
  <parameter key="timeout" value="3000"/>
</service>

<monitor service="VMwareCim-HostSystem" class-name="org.opennms.netmgt.poller.monitors.VmwareCimMonitor"/>
5.6.50. VmwareMonitor
This monitor is part of the VMware integration provided in Provisiond and test the power state of a virtual machine (VM) or a host system (host).
If the power state of a VM or host is poweredOn the service is up.
The state off the service on the VM or Host is marked as down.
By default standBy is also considered as down.
In case of using Distributed Power Management the standBy state can be changed see the ignoreStandBy configuration parameter.
| The information for the status of a virtual machine is collected from the responsible VMware vCenter using the credentials from the vmware-config.xml. It is also required to get specific asset fields assigned to an imported virtual machine and host system. The following asset fields are required, which are populated by the VMware integration in Provisiond: VMware Management Server, VMware Managed Entity Type and the foreignId which contains an internal VMware vCenter Identifier. |
Monitor facts
Class Name |
|
Remote Enabled |
false |
Configuration and Usage
| Parameter | Description | Required | Default value |
|---|---|---|---|
|
Number of retries before the service is marked as down. |
optional |
|
|
Treat power state standBy as up. |
optional |
|
|
Checks for unacknowledged vSphere alarms for a given comma-separated list of severities (red, yellow, green, gray). |
optional |
`` |
This monitor implements the Common Configuration Parameters.
Examples
Some example configuration how to configure the monitor in the poller-configuration.xml.
With this configuration the monitor will go down if any unacknowledged vSphere alarms with severity red or yellow exist for this managed entity.
<service name="VMware-ManagedEntity" interval="300000" user-defined="false" status="on">
  <parameter key="retry" value="2"/>
  <parameter key="timeout" value="3000"/>
  <parameter key="reportAlarms" value="red, yellow"/>
</service>

<monitor service="VMware-ManagedEntity" class-name="org.opennms.netmgt.poller.monitors.VmwareMonitor"/>
5.6.51. WebMonitor
WebMonitor is a clone of HttpMonitor, that uses a different underlying library for doing HTTP connections. WebMonitor uses Apache HttpClient, which acts more like a real browser (follows redirects, etc.) than HttpMonitor.
Monitor facts
Class Name |
|
Configuration and Usage
Note that all parameters listed are optional.
| Parameter | Description | Default value |
|---|---|---|
|
Specifies that system-wide proxy settings be used. The system proxy settings can be configured via system properties. |
|
|
Protocol/scheme to use. |
|
|
The port to connect to. |
80 |
|
The path of the URL to request (e.g., |
|
|
The query string to add to the URL after a |
|
|
The connection/socket timeout. |
|
|
The |
|
|
The |
|
|
True/false whether to use HTTP 1.0 or 1.1. |
|
|
Headers to add |
|
|
Defaults to false, if true it will trust self-signed certificates. |
false |
|
Whether to enable basic authentication. |
|
|
The username for basic authentication. |
|
|
The password |
|
|
Whether to send basic authentication even if the site did not ask for it. |
true |
|
The response text to look for. |
|
|
What HTTP status ranges are considered success. |
100-399 |
5.6.52. Win32ServiceMonitor
The Win32ServiceMonitor enables OpenNMS Horizon to monitor the running state of any Windows service. The service status is monitored using the Microsoft Windows® provided SNMP agent providing the LAN Manager MIB-II. For this reason it is required the SNMP agent and OpenNMS Horizon is correctly configured to allow queries against part of the MIB tree. The status of the service is monitored by polling the
svSvcOperatingState = 1.3.6.1.4.1.77.1.2.3.1.3
of a given service by the display name.
Monitor facts
Class Name |
|
Remote Enabled |
false |
Configuration and Usage
| Parameter | Description | Required | Default value |
|---|---|---|---|
|
The name of the service, this should be the exact name of the Windows service to monitor as it appears in the Services MSC snap-in. Short names such as you might use with net start will not work here. |
required |
|
This monitor implements the Common Configuration Parameters.
Non-English Windows
The service-name is sometime encoded in languages other than English.
Like in French, the Task Scheduler service is Planificateur de tâche.
Because of the "â" (non-English character), the OID value is encoded in hexa (0x50 6C 61 6E 69 66 69 63 61 74 65 75 72 20 64 65 20 74 C3 A2 63 68 65 73).
|
Troubleshooting
If you’ve created a Win32ServiceMonitor poller and are having difficulties with it not being monitored properly on your hosts, chances are there is a difference in the name of the service you’ve created, and the actual name in the registry.
For example, I need to monitor a process called Example Service on one of our production servers.
I retrieve the Display name from looking at the service in service manager, and create an entry in the poller-configuration.xml files using the exact name in the Display name field.
However, what I don’t see is the errant space at the end of the service display name that is revealed when doing the following:
snmpwalk -v 2c -c <communitystring> <hostname> .1.3.6.1.4.1.77.1.2.3.1.1
This provides the critical piece of information I am missing:
iso.3.6.1.4.1.77.1.2.3.1.1.31.83.116.97.102.102.119.97.114.101.32.83.84.65.70.70.86.73.69.87.32.66.97.99.107.103.114.111.117.110.100.32 = STRING: "Example Service "
| Note the extra space before the close quote. |
The extra space at the end of the name was difficult to notice in the service manager GUI, but is easily visible in the snmpwalk output.
The right way to fix this would be to correct the service Display name field on the server, however, the intent of this procedure is to recommend verifying the true name using snmpwalk as opposed to relying on the service manager GUI.
Examples
Monitoring the service running state of the Task Scheduler on an English local Microsoft Windows® Server requires at minimum the following entry in the poller-configuration.xml.
<service name="Windows-Task-Scheduler" interval="300000" user-defined="false" status="on">
    <parameter key="service-name" value="Task Scheduler"/>
</service>

<monitor service="Windows-Task-Scheduler" class-name="org.opennms.netmgt.poller.monitors.Win32ServiceMonitor"/>
5.6.53. WsManMonitor
This monitor can be used to issue a WS-Man Get command and validate the results using a SPEL expression. This monitor implements placeholder substitution in parameter values.
Monitor facts
Class Name |
|
Remote Enabled |
false |
Configuration and Usage
| Parameter | Description | Required | Default value | Placeholder substitution |
|---|---|---|---|---|
|
Resource URI |
required |
|
No |
|
SPEL expression applied against the result of the Get |
required |
|
Yes |
|
Used to filter the result set. All selectors must prefixed with |
optional |
|
No |
This monitor implements the Common Configuration Parameters.
Examples
The following monitor will issue a Get against the configured resource and verify that the correct service tag is returned:
<service name="WsMan-ServiceTag-Check" interval="300000" user-defined="false" status="on">
  <parameter key="resource-uri" value="http://schemas.dell.com/wbem/wscim/1/cim-schema/2/root/dcim/DCIM_ComputerSystem"/>
  <parameter key="selector.CreationClassName" value="DCIM_ComputerSystem"/>
  <parameter key="selector.Name" value="srv:system"/>
  <parameter key="rule" value="#IdentifyingDescriptions matches '.*ServiceTag' and #OtherIdentifyingInfo matches 'C7BBBP1'"/>
</service>

<monitor service="WsMan-ServiceTag-Check" class-name="org.opennms.netmgt.poller.monitors.WsManMonitor/>
5.6.54. XmpMonitor
The XMP monitor tests for XMP service/agent availability by establishing an XMP session and querying the target agent’s sysObjectID variable contained in the Core MIB. The service is considered available when the session attempt succeeds and the agent returns its sysObjectID without error.
Monitor facts
Class Name |
|
Remote Enabled |
false |
Configuration and Usage
These parameters can be set in the XMP service entry in collectd-configuration.xml and will override settings from xmp-config.xml. Also, don’t forget to add an entry in response-graph.properties so that response values will be graphed.
| Parameter | Description | Required | Default value |
|---|---|---|---|
|
Time in milliseconds to wait for a successful session. |
optional |
|
|
The authenUser parameter for use with the XMP session. |
optional |
|
|
TCP port to connect to for XMP session establishment |
optional |
|
|
Name of MIB to query |
optional |
|
|
Name of MIB object to query |
optional |
|
This monitor implements the Common Configuration Parameters.
Examples
<service name="XMP" interval="300000" user-defined="false" status="on">
  <parameter key="timeout" value="3000"/>
  <parameter key="rrd-repository" value="/opt/opennms/share/rrd/response"/>
  <parameter key="rrd-base-name" value="xmp"/>
  <parameter key="ds-name" value="xmp"/>
</service>
<monitor service="XMP" class-name="org.opennms.netmgt.poller.monitors.XmpMonitor"/>reports=icmp, \
xmp, \ . . . .
report.xmp.name=XMP
report.xmp.columns=xmp
report.xmp.type=responseTime
report.xmp.command=--title="XMP Response Time" \
--vertical-label="Seconds" \
DEF:rtMills={rrd1}:xmp:AVERAGE \
DEF:minRtMills={rrd1}:xmp:MIN \
DEF:maxRtMills={rrd1}:xmp:MAX \
CDEF:rt=rtMills,1000,/ \
CDEF:minRt=minRtMills,1000,/ \
CDEF:maxRt=maxRtMills,1000,/ \
LINE1:rt#0000ff:"Response Time" \
GPRINT:rt:AVERAGE:" Avg \\: %8.2lf %s" \
GPRINT:rt:MIN:"Min \\: %8.2lf %s" \
GPRINT:rt:MAX:"Max \\: %8.2lf %s\\n"6. Performance Management
OpenNMS Horizon collects performance data using the Collectd daemon, which is enabled by default. Collectd schedules data collection on OpenNMS Horizon entities (currently nodes and interfaces), using management agents and protocol-specific collectors (SNMP, HTTPS, JMX, JDBC, etc.) to collect performance metrics. Each collector has its own associated configuration that defines parameters for the collector.
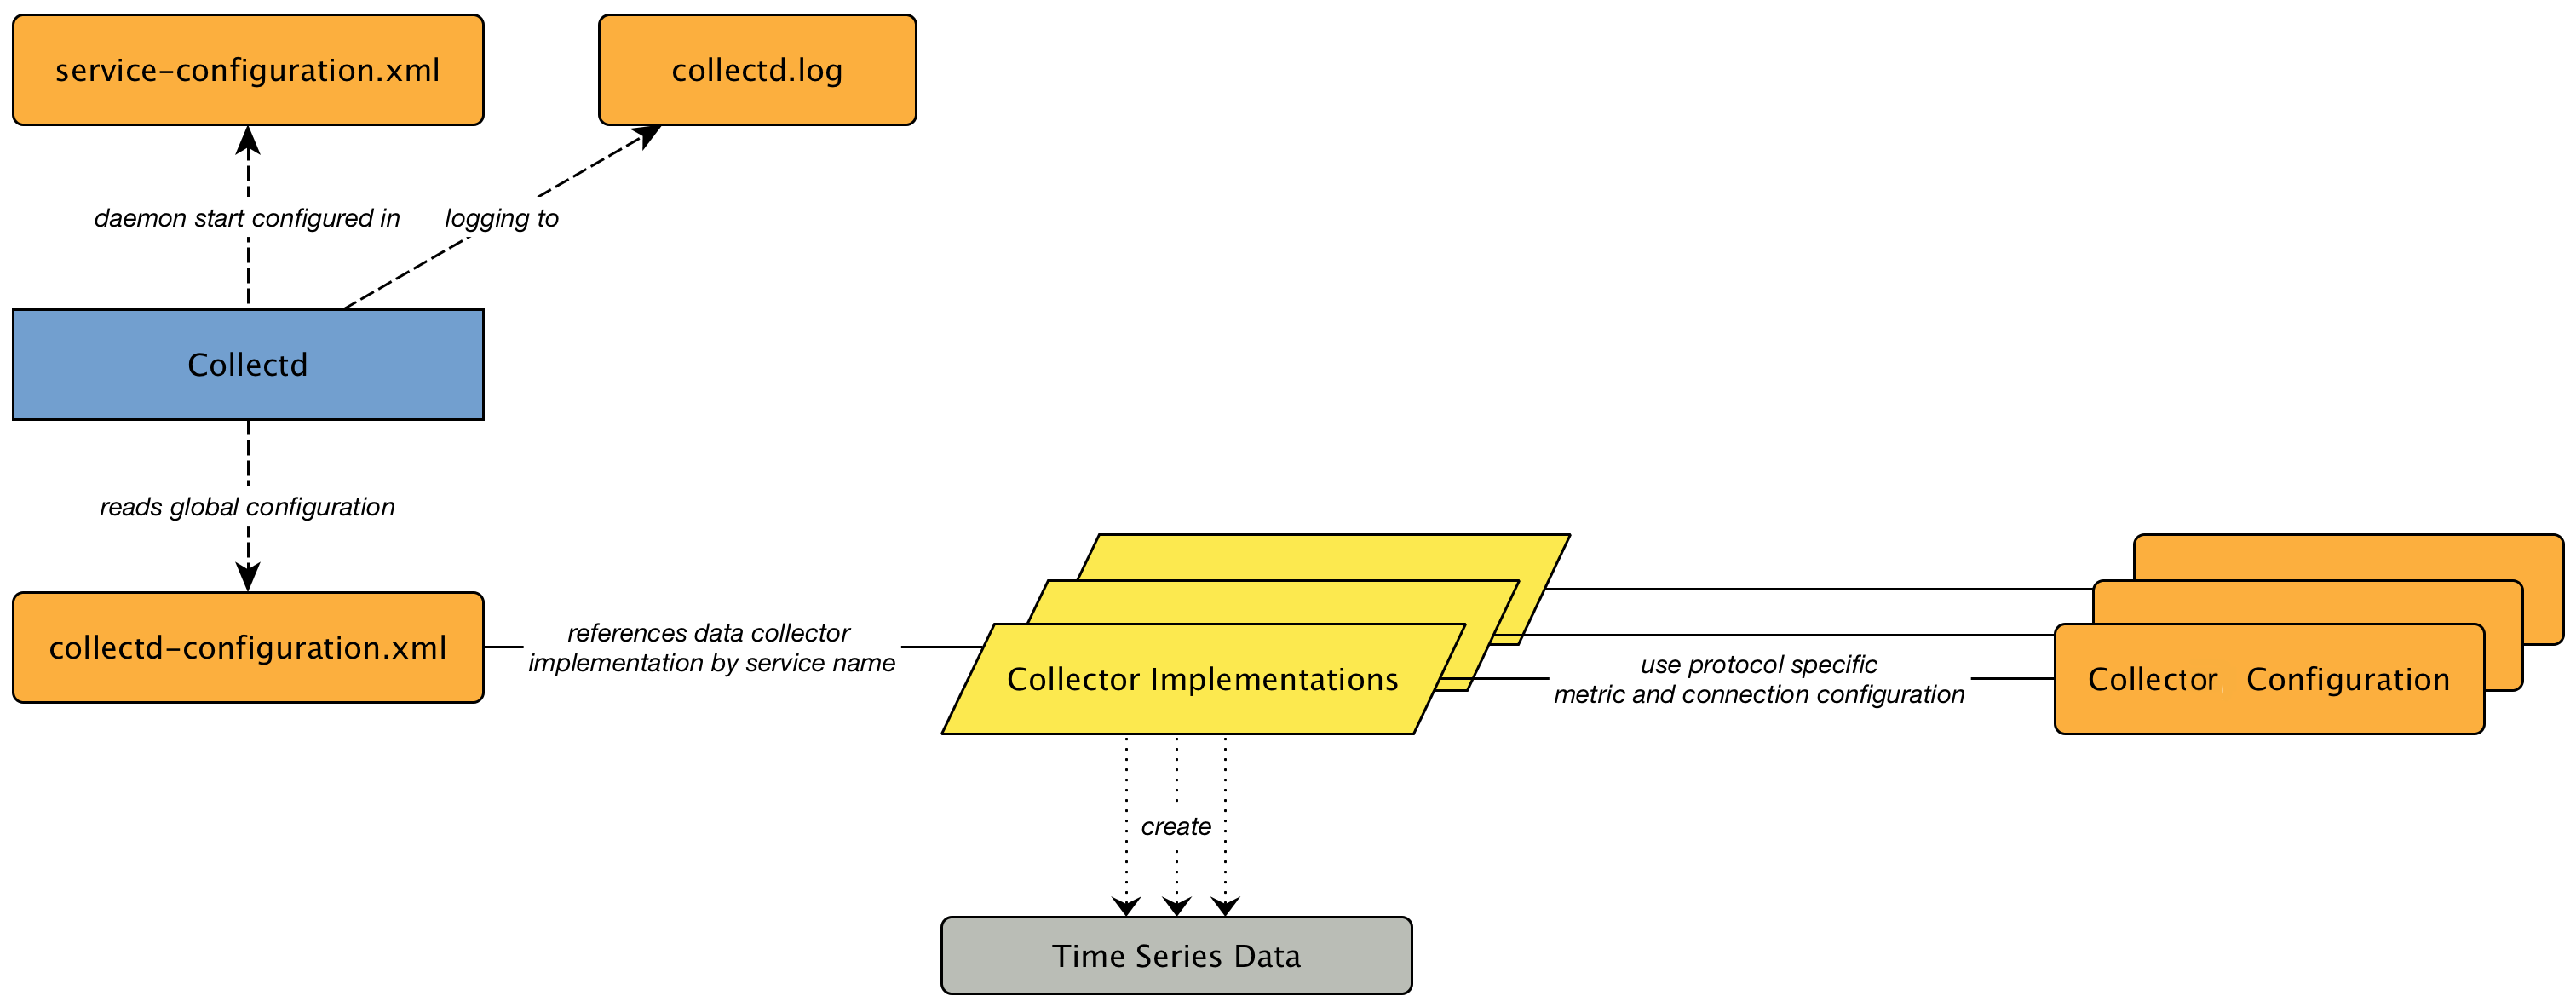
By default, data collection is enabled for SNMP and for OpenNMS-JVM (to monitor itself through JMX).
Data collection works out of the box with SNMP, provided you have your SNMP community string configured properly.
The default value of the community string is public.
If your community string is different, you need to change the value:
-
Login to the web UI.
-
Go to admin>Configure OpenNMS.
-
In the Provisioning section, select Configure SNMP Community Names by IP Address.
-
Under v1/v2c specific parameters change the
Read Community Stringvalue and click Save Config.
Performance data collection on other protocols (HTTPS, JMX, JDBC, etc.), requires additional configuration. You may also want to change how collectd works: when, how, and what data it collects.
Learn how to manage performance data collection:
-
collectd administration (logging, graphing, and event properties)
6.1. Configuring Collectd
The collectd-configuration.xml file defines the nodes, services and parameters on which collectd collects metrics. It also specifies the list of available collectors.
The file is located in $OPENNMS_HOME.
Edit the collectd-configuration.xml file to:
In addtion to editing the collectd-configuration.xml, you need to configure collectors for the protocols from which you want to collect data by editing the configuration files associated with them.
6.1.1. Setting the Thread Pool
A globally defined thread attribute limits the number of threads the data collection process uses in parallel.
Increase or decrease this value based on your network and the size of your server by changing the value in $OPENNMS_HOME/etc/collectd-configuration.xml:
<collectd-configuration
        threads="50">
6.1.2. Configuring Collector Packages
Collector packages in the collectd-configuration.xml file contain the information (IP addresses, interfaces, services, and connection parameters) that collectd needs to activate data collection.
Collectd activates data collection for each node that contains an IP interface in the configured range and also contains any of the services listed in the package associated with the selected IP interface.
Edit existing collector packages or create new ones to customize data collection for your needs. If you create a new collector package, we recommend copying and pasting an existing package in the collectd-configuration.xml to use as a template.
A collector package has two categories of information to edit or specify:
At a minimum, collector package attributes include a package name and a filter that specifies the interfaces to include in the collector package:
<package name="cassandra-via-jmx" remote="false">
      <filter>IPADDR != '0.0.0.0'</filter>
Note that remote="false" means that the services in this package are tested only from the OpenNMS core system itself and not from a different remote location.
Each package must have a filter tag that performs the initial test to see if an interface should be included in a package.
Filters operate on interfaces (not nodes).
Each package can have only one filter tag.
The following tags are also available for an interface filter:
Tag |
Description |
Example |
|
Specify an actual IP address to include in the package. |
|
|
Specify a range of IP addresses to include in a package. |
|
|
Specify a range of IP addresses to exclude in a package.
This will override an |
|
|
Specify a file that contains a list of #IP addresses to include. |
|
The following example illustrates collector package attributes that use some of these additional tags:
<package name="example1" remote="false">(1)
  <filter>IPADDR != '0.0.0.0'</filter>(2)
  <include-range begin="1.1.1.1" end="254.254.254.254"/>(3)
<include-range begin="::1" end="ffff:ffff:ffff:ffff:ffff:ffff:ffff:ffff"/>(4)| 1 | Unique name of the collection package. |
| 2 | Apply this package to all IP interfaces with a configured IPv4 address (not equal 0.0.0.0) |
| 3 | Evaluate IPv4 rule to collect for all IPv4 interfaces in the given range |
| 4 | Evaluate IPv6 rule to collect for all IPv6 interfaces in the given range |
Service configuration attributes define the collector to use and which performance metrics to collect. Each service is associated with a specific collector; the collector and its related Java class must appear at the bottom of the collectd-configuration.xml file:
<service name="SNMP"(1)
         interval="300000"(2)
         user-defined="false"(3)
         status="on">(4)
  <parameter key="collection" value="default"/>(5)
  <parameter key="thresholding-enabled" value="true"/>(6)
</service>

<collector service="SNMP" class-name="org.opennms.netmgt.collectd.SnmpCollector"/>(7)| 1 | Service configuration name, which is mapped to a specific collector. |
| 2 | The interval at which to collect the service (in milliseconds). |
| 3 | Marker to say if service is user defined (used for UI purposes). |
| 4 | Service is collected only if "on". |
| 5 | Assign the performance data collection schema named default (found in the corresponding configuration file for the type of collection, in this case datacollection-config.xml). |
| 6 | Enable threshold evaluation for metrics provided by this service. |
| 7 | Run the SnmpCollector implementation for the service named SNMP. |
The following table lists service attributes common to all services. For a list of collector-specific parameters and their default values, refer to the specific collector listed in the Collectors section.
Attribute |
Description |
|
Service name |
|
Polling interval, in milliseconds (5 minutes by default). |
|
Set to "true" if user defined the collection source in the UI. |
|
Indicates that data collection for the service is on or off. |
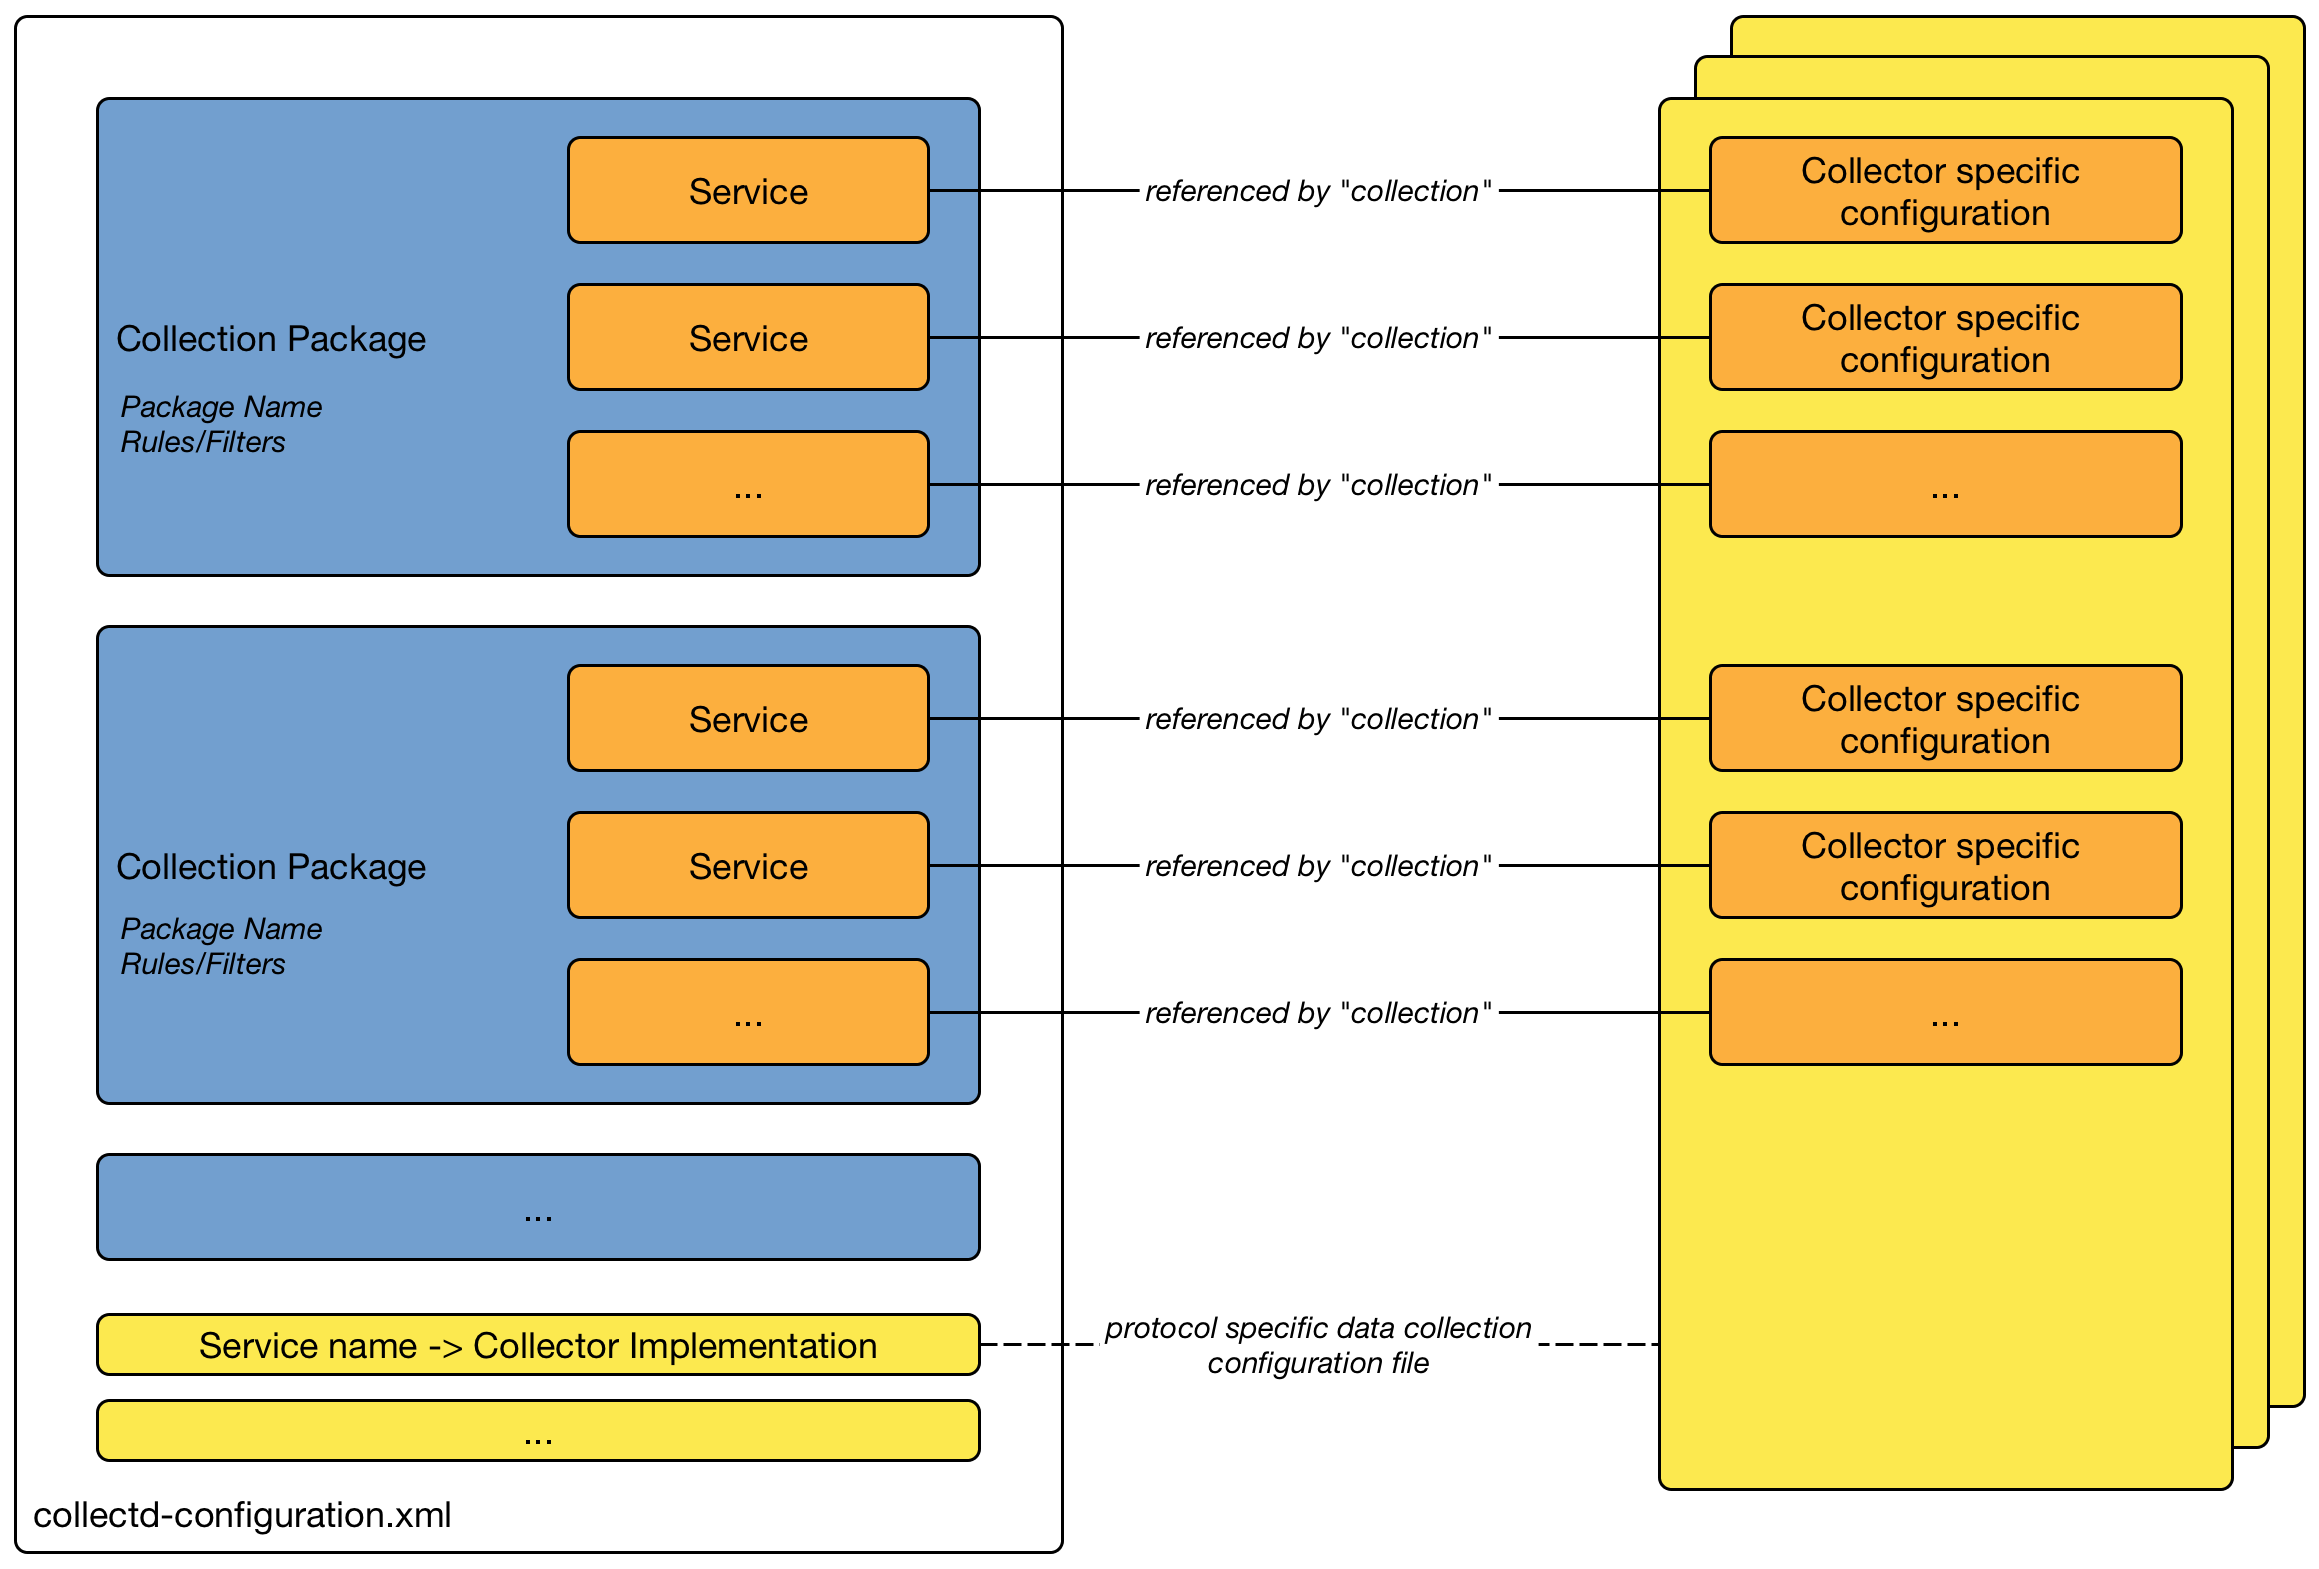
6.1.3. Guidelines for Collector Packages
You can configure multiple packages, and an interface can exist in more than one package. This gives great flexibility in determining the service levels for a given device.
When IP interfaces match multiple collector packages with the same service configuration, collectd applies the last collector package on the service:
-
Use this "final" collector package as a less-specific, catch-all filter for a default configuration.
OR
-
Use it as a more-specific collector package to overwrite the default setting.
Meta-Data-DSL
Metadata-DSL allows you to use dynamic configuration in each parameter value to interpolate metadata into a parameter. The syntax allows for the use of patterns in an expression, whereby the metadata is replaced with a corresponding value during the collection process.
During evaluation of an expression the following scopes are available:
-
Node metadata
-
Interface metadata
-
Service metadata
6.2. Configuring Collectors
Collectors collect performance data via specific agents and protocols. This section includes the following information for each collector:
-
collector-specific parameters (used in the collectd-configuration.xml file)
-
configuration file(s)
| Understanding resource types helps when editing collector-specific configuration files. |
6.2.1. SnmpCollector
The SnmpCollector collects performance data through the SNMP protocol.
Configure access to the SNMP Agent through the SNMP configuration in the Web UI (Admin>Configure SNMP Community Names by IP Address).
Collector Facts
Class Name |
|
Package |
core |
Supported on Minion |
|
Collector Parameters
Use these parameters used in the collectd-configuration.xml file.
| Parameter | Description | Required | Default value |
|---|---|---|---|
|
The name of the SNMP Collection to use. |
required |
|
|
Whether collected performance data should be tested against thresholds. |
optional |
|
|
Timeout in milliseconds to wait for SNMP responses. |
optional |
SNMP configuration |
SNMP Collection Configuration
| Understanding resource types helps when editing collector-specific configuration files. |
Define SNMP Collection in etc/datacollection-config.xml and etc/datacollection.d/*.xml.
<?xml version="1.0"?>
<datacollection-config rrd-repository="/var/lib/opennms/rrd/snmp/">(1)
    <snmp-collection name="default"(2)
                     snmpStorageFlag="select">(3)
        <rrd step="300">(4)
            <rra>RRA:AVERAGE:0.5:1:2016</rra>
            <rra>RRA:AVERAGE:0.5:12:1488</rra>
            <rra>RRA:AVERAGE:0.5:288:366</rra>
            <rra>RRA:MAX:0.5:288:366</rra>
            <rra>RRA:MIN:0.5:288:366</rra>
        </rrd>

        <include-collection dataCollectionGroup="MIB2"/>(5)
        <include-collection dataCollectionGroup="3Com"/>
        ...
        <include-collection dataCollectionGroup="VMware-Cim"/>
    </snmp-collection>
</datacollection-config>| 1 | Directory where to persist RRD files on the file system, ignored if NewTS is used as time-series storage. |
| 2 | Name of the SNMP data collection referenced in the collection package in collectd-configuration.xml. |
| 3 | Configure SNMP MIB-II interface metric collection behavior: all means collect metrics from all interfaces, primary only from interface provisioned as primary interface, select only from manually selected interfaces from the Web UI. |
| 4 | RRD archive configuration for this set of performance metrics, ignored when NewTS is used as time series storage. |
| 5 | Include device- or application-specific performance metric OIDS to collect. |
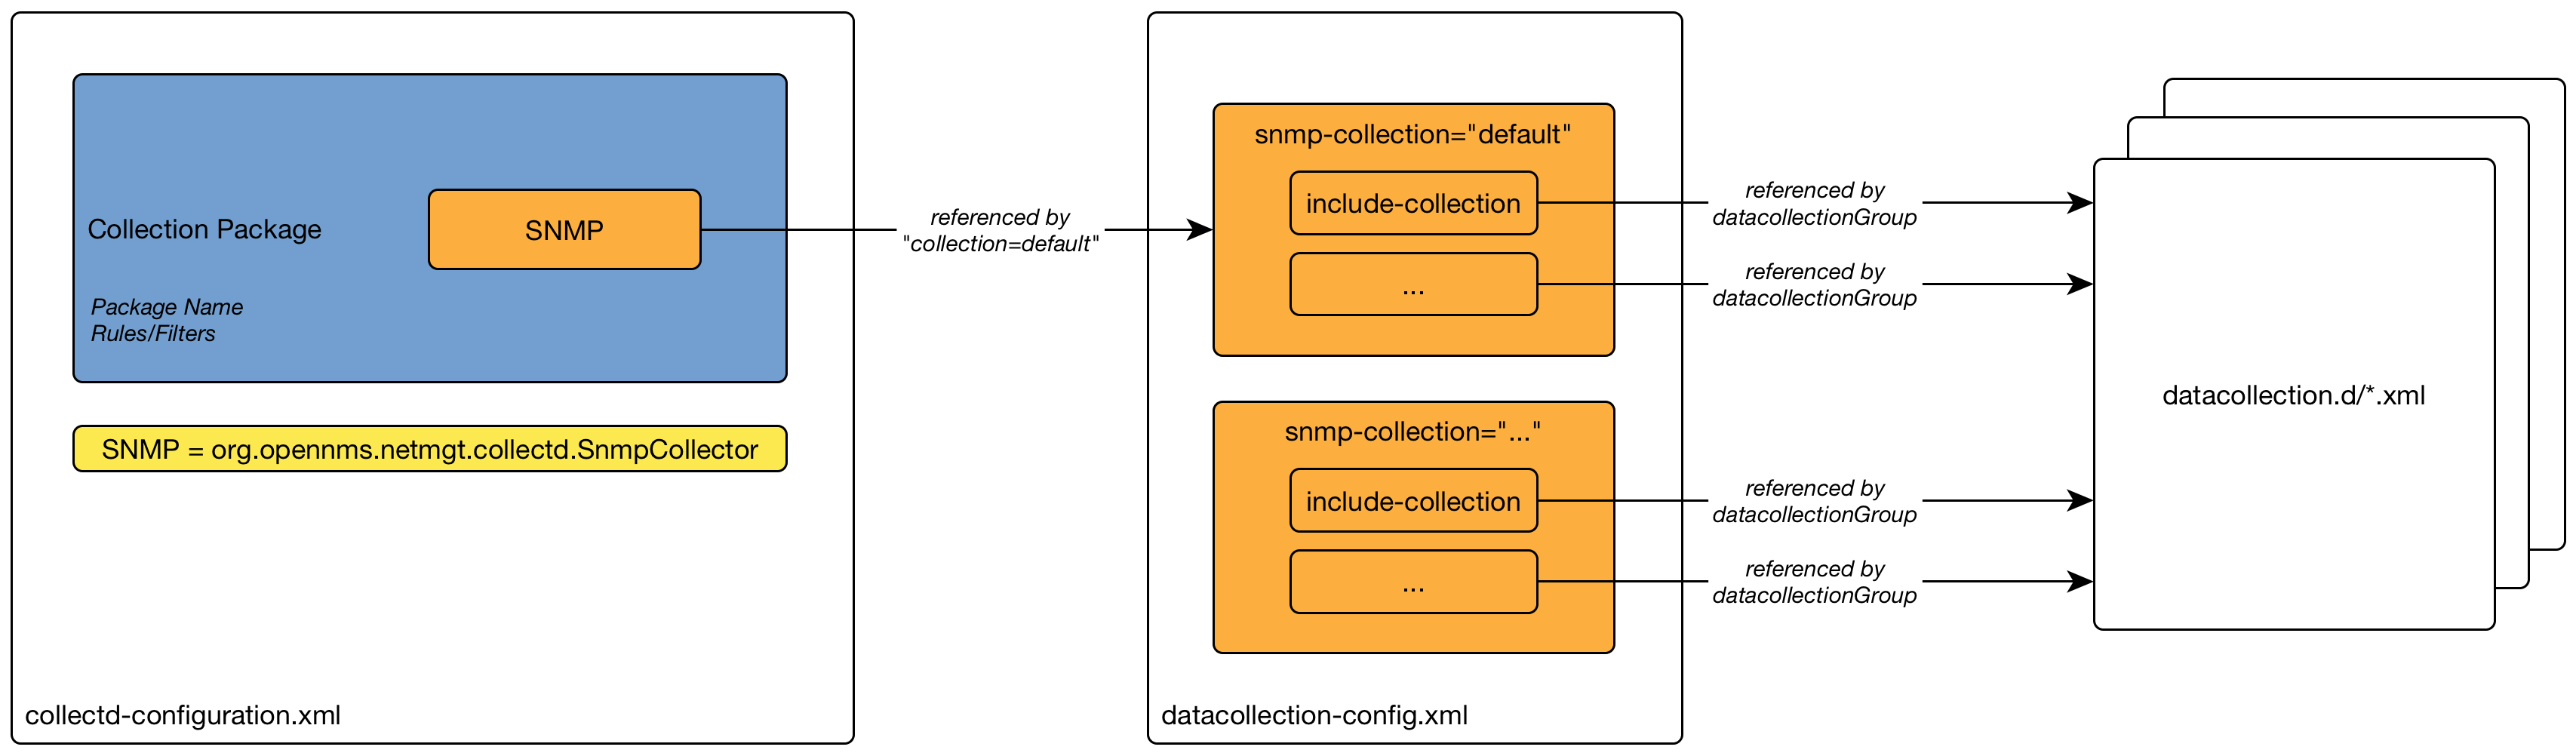
SnmpCollectorNG
The SnmpCollectorNG provides an alternate implementation to the SnmpCollector that takes advantages of new APIs in the platform.
It is provided as a separate collector while we work to validate its functionality and run-time characteristics, with the goal of eventually having it replace the SnmpCollector.
Use this new collector by updating existing references from org.opennms.netmgt.collectd.SnmpCollector to org.opennms.netmgt.collectd.SnmpCollectorNG.
Known caveats include:
-
No support for alias type resources
-
No support for min/max values
6.2.2. JmxCollector
The JmxCollector collects performance data via JMX. Attributes are extracted from the available MBeans.
Collector Facts
Class Name |
|
Package |
core |
Supported on Minion |
|
Collector Parameters
Use these parameters in the collectd-configuration.xml file.
| Parameter | Description | Required | Default value |
|---|---|---|---|
|
The name of the JMX Collection to use. |
required |
(none) |
|
Whether collected performance data should be tested against thresholds |
optional |
|
|
Number of retries |
optional |
|
|
Name of the path in which the metrics should be stored |
optional |
Value of the port, or 'jsr160' if no port is set. |
|
The password strategy to use.
Supported values are: |
optional |
|
|
The connection url, e.g., |
optional |
(none) |
|
The username if authentication is required. |
optional |
(none) |
|
The password if authentication is required. |
optional |
(none) |
|
Deprecated. JMX port. |
optional |
|
|
Deprecated. Protocol used in the |
optional |
|
|
Deprecated. Path used in |
optional |
|
|
Deprecated. RMI port. |
optional |
|
|
Deprecated. Use an alternative |
optional |
|
The deprecated parameters port, protocol, urlPath, rmiServerPort and remoteJMX should be replaced with the url parameter.
If url is not defined the collector falls back to legacy mode and the deprecated parameters are used instead to build the connection url.
|
If a service requires different configuration, an entry in $OPENNMS_HOME/etc/jmx-config.xml can overwrite it.
|
JMX Collection Configuration
| Understanding resource types helps when editing collector-specific configuration files. |
Define JMX Collections in etc/jmx-datacollection-config.xml and etc/jmx-datacollection-config.d/.
This snippet provides a collection definition named opennms-poller:
<jmx-collection name="opennms-poller">
    <rrd step="300">
        <rra>RRA:AVERAGE:0.5:1:2016</rra>
        <rra>RRA:AVERAGE:0.5:12:1488</rra>
        <rra>RRA:AVERAGE:0.5:288:366</rra>
        <rra>RRA:MAX:0.5:288:366</rra>
        <rra>RRA:MIN:0.5:288:366</rra>
    </rrd>
    <mbeans>
        <mbean name="OpenNMS Pollerd" objectname="OpenNMS:Name=Pollerd">
            <attrib name="NumPolls" alias="ONMSPollCount" type="counter"/>
        </mbean>
    </mbeans>
</jmx-collection>
Once added to etc/jmx-datacollection-config.xml you can test it using the collect command available in the Karaf Shell:
opennms:collect org.opennms.netmgt.collectd.Jsr160Collector 127.0.0.1 collection=opennms-poller port=18980
Generic Resource Type
To support wildcard (*) in objectname, JMX collector supports generic resource types. JMX configuration requires two changes for this to work:
-
Create a custom resource type in
etc/resource-types.d/. For example, there is already a definition injmx-resource.xmlthat defines a custom resource for Kafka lag
<resource-types>
    <resourceType name="kafkaLag" label="Kafka Lag"
                  resourceLabel="${index}">
      <persistenceSelectorStrategy class="org.opennms.netmgt.collection.support.PersistAllSelectorStrategy"/>
      <storageStrategy class="org.opennms.netmgt.dao.support.SiblingColumnStorageStrategy">
		   <parameter key="sibling-column-name" value="name" />
      </storageStrategy>
    </resourceType>
</resource-types>-
Match the resourceType name as
resource-typein MBean definition:
<mbean name="org.opennms.core.ipc.sink.kafka.heartbeat" resource-type="kafkaLag" objectname="org.opennms.core.ipc.sink.kafka:name=OpenNMS.Sink.*.Lag">
   <attrib name="Value" alias="Lag" type="gauge"/>
</mbean>
Resource definition
JMX objectname is the full name of MBean in form of ( domain:key=value, key=value, ..).
Wildcard (*) can exist anywhere in the objectname.
Depending on wildcard definition, use SiblingColumnStorageStrategy to extract resource label.
If wildcard exists in the value (usual case), use corresponding key as the sibling-column-name parameter. For example:
org.apache.activemq:BrokerName=*,Type=Queue,Destination=com.mycompany.myqueue
Here BrokerName can be defined as parameter for SiblingColumnStorageStrategy
<parameter key="sibling-column-name" value="BrokerName" />
The extracted BrokerNames from the wildcard will be the resource folders in the form of nodeId/resourceTypeName/{resource-label}
Wildcard may exist in domain as well. For example: org.apache.*:BrokerName=trap, Type=Queue.
Then domain can be defined as the sibling-column-name parameter.
<parameter key="sibling-column-name" value="domain" />
To use the objectname itself as a resource label, use IndexStorageStrategy as storageStrategy in resource-type definition.
Third-Party JMX Services
Some Java applications provide their own JMX implementation and require certain libraries to be present on the classpath, e.g., the Java application server Wildfly. To successfully collect data, you may need to do the following:
-
Place the jmx client lib to the $OPENNMS_HOME/lib folder (e.g., jboss-cli-client.jar)
-
Configure the collection accordingly (see above)
-
Configure the JMX-Collector in collectd-configuration.xml (see below)
<service name="JMX-WILDFLY" interval="300000" user-defined="false" status="on">
    <parameter key="url" value="service:jmx:http-remoting-jmx://${ipaddr}:9990"/>
    <parameter key="retry" value="2"/>
    <parameter key="timeout" value="3000"/>
    <parameter key="factory" value="PASSWORD-CLEAR"/>
    <parameter key="username" value="admin"/>
    <parameter key="password" value="admin"/>
    <parameter key="rrd-base-name" value="java"/>
    <parameter key="collection" value="jsr160"/>
    <parameter key="thresholding-enabled" value="true"/>
    <parameter key="ds-name" value="jmx-wildfly"/>
    <parameter key="friendly-name" value="jmx-wildfly"/>
</service>
<collector service="JMX-WILDFLY" class-name="org.opennms.netmgt.collectd.Jsr160Collector"/>
6.2.3. HttpCollector
The HttpCollector collects performance data via HTTP and HTTPS. Attributes are extracted from the HTTP responses using a regular expression.
Collector Facts
Class Name |
|
Package |
core |
Supported on Minion |
|
Collector Parameters
Use these parameters in the collectd-configuration.xml file.
| Parameter | Description | Required | Default value |
|---|---|---|---|
|
The name of the HTTP Collection to use. |
required |
(none) |
|
Whether collected performance data should be tested against thresholds. |
optional |
|
|
Override the default port in all of the URIs |
optional |
80 |
|
Connection and socket timeout in milliseconds |
optional |
3000 |
|
Number of retries |
optional |
2 |
|
Should the system-wide proxy settings be used? Configure system proxy settings via system properties |
optional |
|
HTTP Collection Configuration
| Understanding resource types helps when editing collector-specific configuration files. |
Define HTTP Collections in etc/http-datacollection-config.xml.
This snippet provides a collection definition named opennms-copyright:
<http-collection name="opennms-copyright">
  <rrd step="300">
    <rra>RRA:AVERAGE:0.5:1:2016</rra>
    <rra>RRA:AVERAGE:0.5:12:1488</rra>
    <rra>RRA:AVERAGE:0.5:288:366</rra>
    <rra>RRA:MAX:0.5:288:366</rra>
    <rra>RRA:MIN:0.5:288:366</rra>
  </rrd>
  <uris>
    <uri name="login-page">
      <url path="/opennms/login.jsp"
           matches=".*2002\-([0-9]+).*" response-range="100-399" dotall="true" >
      </url>
      <attributes>
        <attrib alias="copyrightYear" match-group="1" type="gauge"/>
      </attributes>
    </uri>
  </uris>
</http-collection>
Once added to etc/http-datacollection-config.xml you can test it using the collect command available in the Karaf Shell:
opennms:collect org.opennms.netmgt.collectd.HttpCollector 127.0.0.1 collection=opennms-copyright port=89806.2.4. JdbcCollector
The JdbcCollector collects performance data via JDBC drivers. Attributes are retrieved using SQL queries.
Collector Facts
Class Name |
|
Package |
core |
Supported on Minion |
|
Limitations on Minion
When running on Minion the data sources in opennms-datasources.xml cannot be referenced.
Instead, you must set the JDBC connection settings using the service parameters.
Also, the JDBC driver must be properly loaded in the Minion container (see Installing JDBC drivers in Minion) By default, only the JDBC driver for PostgreSQL is available.
Collector Parameters
Use these parameters in the collectd-configuration.xml file.
| Parameter | Description | Required | Default value |
|---|---|---|---|
|
The name of the JDBC Collection to use. |
required |
(empty) |
|
Use an existing datasource defined in opennms-datasources.xml |
optional |
NO_DATASOURCE_FOUND |
|
Driver class name |
optional |
org.postgresql.Driver |
|
JDBC URL |
optional |
jdbc:postgresql://:OPENNMS_JDBC_HOSTNAME/opennms |
|
JDBC username |
optional |
postgres |
|
JDBC password |
optional |
(empty string) |
JDBC Collection Configuration
| Understanding resource types helps when editing collector-specific configuration files. |
Define JDBC Collections in etc/jdbc-datacollection-config.xml.
This snippet provided a collection definition named opennms-stats:
<jdbc-collection name="opennms-stats">
  <rrd step="300">
    <rra>RRA:AVERAGE:0.5:1:2016</rra>
    <rra>RRA:AVERAGE:0.5:12:1488</rra>
    <rra>RRA:AVERAGE:0.5:288:366</rra>
    <rra>RRA:MAX:0.5:288:366</rra>
    <rra>RRA:MIN:0.5:288:366</rra>
  </rrd>
  <queries>
    <query name="opennmsQuery" ifType="ignore">
      <statement data-source="opennms">
        <queryString>select count(*) as event_count from events;</queryString>
      </statement>
      <columns>
        <column name="event_count" data-source-name="event_count" alias="event_count" type="GAUGE"/>
      </columns>
    </query>
  </queries>
</jdbc-collection>
Once added to etc/jdbc-datacollection-config.xml you can test it using the collect command available in the Karaf Shell:
opennms:collect org.opennms.netmgt.collectd.JdbcCollector 127.0.0.1 collection=opennms-stats data-source=opennmsTo test this same collection on Minion you must specify the JDBC settings as service attributes, for example:
opennms:collect -l MINION org.opennms.netmgt.collectd.JdbcCollector 127.0.0.1 collection=opennms-stats driver=org.postgresql.Driver url=jdbc:postgresql://localhost:5432/opennms user=opennms password=opennms6.2.5. NSClientCollector
The NSClientCollector collects performance data over HTTP from NSClient++.
Collector Facts
Class Name |
|
Package |
opennms-plugin-protocol-nsclient |
Supported on Minion |
|
Collector Parameters
Use these parameters in the collectd-configuration.xml file).
| Parameter | Description | Required | Default value |
|---|---|---|---|
|
The name of the NSClient Collection to use. |
optional |
default |
6.2.6. PrometheusCollector
The PrometheusCollector collects performance metrics via HTTP(S) using the text-based Prometheus Exposition format. This has been adopted by many applications and is in the process of being standardized in the OpenMetrics project.
This collector provides tools for parsing and mapping the metrics to the collection model used by OpenNMS Horizon.
Collector Facts
Class Name |
|
Package |
core |
Supported on Minion |
|
Collector Parameters
| Parameter | Description | Required | Default value |
|---|---|---|---|
|
The name of the Prometheus Collection to use |
required |
|
|
HTTP URL to query for the metrics |
required |
|
|
HTTP socket and read timeout in milliseconds |
optional |
10000 (10 seconds) |
|
Number of retries before failing |
optional |
2 |
`header-* |
Optional headers to pass in the HTTP request |
optional |
(none) |
Prometheus Collector Usage
Let’s demonstrate the usage of the collector with an example running against node_exporter.
Obtain a copy of the appropriate release binary from the node_exporter release page.
Extract and start the service:
$ tar xvf node_exporter-0.18.1.linux-amd64.tar.gz
$ ./node_exporter-0.18.1.linux-amd64/node_exporter
INFO[0000] Starting node_exporter (version=0.18.1, branch=HEAD, revision=3db77732e925c08f675d7404a8c46466b2ece83e)  source="node_exporter.go:156"
INFO[0000] Build context (go=go1.12.5, user=root@b50852a1acba, date=20190604-16:41:18)  source="node_exporter.go:157"
INFO[0000] Enabled collectors:                           source="node_exporter.go:97"
INFO[0000]  - arp                                        source="node_exporter.go:104"
INFO[0000]  - bcache                                     source="node_exporter.go:104"
INFO[0000]  - bonding                                    source="node_exporter.go:104"
INFO[0000]  - conntrack                                  source="node_exporter.go:104"
INFO[0000]  - cpu                                        source="node_exporter.go:104"
INFO[0000]  - cpufreq                                    source="node_exporter.go:104"
...
INFO[0000]  - uname                                      source="node_exporter.go:104"
INFO[0000]  - vmstat                                     source="node_exporter.go:104"
INFO[0000]  - xfs                                        source="node_exporter.go:104"
INFO[0000]  - zfs                                        source="node_exporter.go:104"
INFO[0000] Listening on :9100                            source="node_exporter.go:170"
From the Karaf Shell, you can now issue an ad hoc collection request against the node_exporter process
admin@opennms> opennms:collect org.opennms.netmgt.collectd.prometheus.PrometheusCollector 127.0.0.1 collection=node_exporter url='http://127.0.0.1:9100/metrics'
NOTE: Some collectors require a database node and IP interface.
    NodeLevelResource[nodeId=0,path=null]
        Group: node_exporter_loadavg
                Attribute[load1:1.26]
                Attribute[load15:1.0]
                Attribute[load5:0.59]
        Group: node_exporter_memory
                Attribute[Active_anon_bytes:1.1776770048E10]
                Attribute[Active_bytes:2.4471535616E10]
                Attribute[Active_file_bytes:1.2694765568E10]
Update the IP addresses in the command as necessary.
Prometheus Collector Configuration
Prometheus collection definitions are maintained in etc/prometheus-datacollection.d/.
Let’s look at an excerpt of the node_exporter collection:
<!--
    node_memory_Active 1.3626548224e+10
    node_memory_Active_anon 6.314020864e+09
    node_memory_Active_file 7.31252736e+09
    ...
    node_memory_HugePages_Free 0
    ...
-->
<group name="node_exporter_memory"
    resource-type="node"
    filter-exp="name matches 'node_memory_.*'">

    <numeric-attribute alias-exp="name.substring('node_memory_'.length())"/>
</group>
This group definition matches metrics that start the node_memory_ prefix, extracts the suffix as the metric name and associates these metrics with the node_exporter_memory group in the node-level resource.
Expression are written in Spring Expression Language (SpEL).
The metric instances are used as the expression context, which means you have access to the name and label properties.
Here’s another excerpt where we extract metrics grouped by CPU:
<!--
    node_cpu{cpu="cpu0",mode="guest"} 0
    node_cpu{cpu="cpu0",mode="idle"} 16594.88
    ...
    node_cpu{cpu="cpu1",mode="guest"} 0
    node_cpu{cpu="cpu1",mode="idle"} 17790.51
-->
<group name="node_exporter_cpus"
    resource-type="nodeExporterCPU"
    filter-exp="name matches 'node_cpu'"
    group-by-exp="labels[cpu]">

    <numeric-attribute alias-exp="labels[mode]"/>
</group>
This group definition matches metrics called 'node_cpu', groups them by the value of the cpu label and extracts the name of the mode for the name of the numeric attributes.
6.2.7. TcaCollector
The TcaCollector collects special SNMP data from Juniper TCA Devices.
Collector Facts
Class Name |
|
Package |
opennms-plugin-collector-juniper-tca |
Supported on Minion |
|
Collector Parameters
Use these parameters in the collectd-configuration.xml file.
| Parameter | Description | Required | Default value |
|---|---|---|---|
|
The name of the TCA Collection to use. |
required |
6.2.8. VmwareCimCollector
The VmwareCimCollector collects ESXi host and sensor metrics from vCenter.
Collector Facts
Class Name |
|
Package |
core |
Supported on Minion |
|
Collector Parameters
Use these parameters in the collectd-configuration.xml file.
| Parameter | Description | Required | Default value |
|---|---|---|---|
|
The name of the VMWare CIM Collection to use. |
required |
|
|
Connection timeout in milliseconds |
optional |
6.2.9. VmwareCollector
The VmwareCollector collects peformance metrics for managed entities from vCenter.
Collector Facts
Class Name |
|
Package |
core |
Supported on Minion |
|
Collector Parameters
Use these parameters in the collectd-configuration.xml file.
| Parameter | Description | Required | Default value |
|---|---|---|---|
|
The name of the VMWare Collection to use. |
required |
|
|
Connection timeout in milliseconds |
optional |
6.2.10. WmiCollector
The WmiCollector collects peformance metrics from Windows systems using Windows Management Instrumentation (WMI).
Collector Facts
Class Name |
|
Package |
core |
Supported on Minion |
|
Collector Parameters
Use these parameters in the collectd-configuration.xml file.
| Parameter | Description | Required | Default value |
|---|---|---|---|
|
The name of the WMI Collection to use. |
required |
6.2.11. WsManCollector
The WsManCollector collects peformance metrics using the Web Services-Management (WS-Management) protocol.
Web Services-Management (WS-Management) is a DMTF open standard defining a SOAP-based protocol for the management of servers, devices, applications and various Web services. Windows Remote Management (WinRM) is the Microsoft implementation of WS-Management Protocol.
Collector Facts
Class Name |
|
Package |
core |
Supported on Minion |
|
Collector Parameters
Use these parameters in the collectd-configuration.xml file.
| Parameter | Description | Required | Default value |
|---|---|---|---|
|
The name of the WS-Man Collection to use. |
required |
WS-Management Setup
Before setting up OpenNMS Horizon to communicate with a WS-Management agent, you should confirm that it is properly configured and reachable from the OpenNMS Horizon system. If you need help enabling the WS-Management agent, consult the documentation from the manufacturer. Here are some resources that could help:
We suggest using the Openwsman command line client to validate authentication and connectivity.
Packages are available for most distributions under wsmancli.
For example:
wsman identify -h localhost -P 5985 -u wsman -p secretOnce validated, add the agent-specific details to the OpenNMS Horizon configuration, defined in the next section.
Troubleshooting and Commands
For troubleshooting there is a set of commands you can use in Powershell verified on Microsoft Windows Server 2012.
Enable-PSRemotingnetsh advfirewall firewall add rule name="WinRM-HTTP" dir=in localport=5985 protocol=TCP action=allownetsh advfirewall firewall add rule name="WinRM-HTTPS" dir=in localport=5986 protocol=TCP action=allowwinrm id
winrm get winrm/config
winrm e winrm/config/listener
nc -z -w1 <windows-server-ip-or-host> 5985;echo $?| Use BasicAuthentication just with WinRM over HTTPS with verifiable certificates in production environment. |
winrm set winrm/config/client/auth '@{Basic="true"}'
winrm set winrm/config/service/auth '@{Basic="true"}'
winrm set winrm/config/service '@{AllowUnencrypted="true"}'
WS-Management Agent Configuration
| Understanding resource types helps when editing collector-specific configuration files. |
The agent-specific configuration details are maintained in etc/wsman-config.xml.
This file has a similar structure as etc/snmp-config.xml, which the reader may already be familiar with.
This file is consulted when a connection to a WS-Man Agent is made.
If the IP address of the agent is matched by the range, specific or ip-match elements of a definition, then the attributes on that definition are used to connect to the agent.
Otherwise, the attributes on the outer wsman-config definition are used.
This etc/wsman-config.xml files automatically reload when modified.
Here is an example with several definitions:
<?xml version="1.0"?>
<wsman-config retry="3" timeout="1500" ssl="true" strict-ssl="false" path="/wsman">
    <definition ssl="true" strict-ssl="false" path="/wsman" username="root" password="calvin" product-vendor="Dell" product-version="iDRAC 6">
        <range begin="192.168.1.1" end="192.168.1.10"/>
    </definition>
    <definition ssl="false" port="5985" path="/wsman" username="Administrator" password="P@ssword">
        <ip-match>172.23.1-4.1-255</ip-match>
        <specific>172.23.1.105</specific>
    </definition>
</wsman-config>| Attribute | Description | Default |
|---|---|---|
|
HTTP Connection and response timeout in milliseconds. |
HTTP client default |
|
Number of retries on connection failure. |
|
|
Username for basic authentication. |
none |
|
Password used for basic authentication. |
none |
|
HTTP/S port |
Default for protocol |
|
Maximum number of elements to retrieve in a single request. |
no limit |
|
Enable SSL |
|
|
Enforce SSL certificate verification. |
|
|
Path in the URL to the WS-Management service. |
|
|
Used to overwrite the detected product vendor. |
none |
|
Used to overwrite the detected product version. |
none |
|
Enables GSS authentication. When enabled a reverse lookup is performed on the target IP address in order to determine the canonical host name. |
|
If you try to connect against Microsoft Windows Server make sure to set specific ports for WinRM connections.
By default Microsoft Windows Server uses port TCP/5985 for plain text and port TCP/5986 for SSL connections.
|
WS-Management Collection Configuration
Configuration for the WS-Management collector is stored in etc/wsman-datacollection-config.xml and etc/wsman-datacollection.d/*.xml.
The contents of these files are automatically merged and reloaded when changed.
The default WS-Management collection looks as follows:
|
<?xml version="1.0"?>
<wsman-datacollection-config rrd-repository="${install.share.dir}/rrd/snmp/">
    <collection name="default">
        <rrd step="300">
            <rra>RRA:AVERAGE:0.5:1:2016</rra>
            <rra>RRA:AVERAGE:0.5:12:1488</rra>
            <rra>RRA:AVERAGE:0.5:288:366</rra>
            <rra>RRA:MAX:0.5:288:366</rra>
            <rra>RRA:MIN:0.5:288:366</rra>
        </rrd>

        <!--
             Include all of the available system definitions
         -->
        <include-all-system-definitions/>
    </collection>
</wsman-datacollection-config>
The magic happens with the <include-all-system-definitions/> element which automatically includes all of the system definitions into the collection group.
If required, you can include a specific system-definition with <include-system-definition>sys-def-name</include-system-definition>.
|
System definitions and related groups can be defined in the root etc/wsman-datacollection-config.xml file, but it is preferred that be added to a device specific configuration files in etc/wsman-datacollection-config.d/*.xml.
| Avoid modifying any of the distribution configuration files and create new ones to store you specific details instead. |
Here is an example configuration file for a Dell iDRAC:
<?xml version="1.0"?>
<wsman-datacollection-config>
    <group name="drac-system"
           resource-uri="http://schemas.dell.com/wbem/wscim/1/cim-schema/2/root/dcim/DCIM_ComputerSystem"
           resource-type="node">
        <attrib name="OtherIdentifyingInfo" index-of="#IdentifyingDescriptions matches '.*ServiceTag'" alias="serviceTag" type="String"/>
    </group>

    <group name="drac-power-supply"
           resource-uri="http://schemas.dmtf.org/wbem/wscim/1/*"
           dialect="http://schemas.microsoft.com/wbem/wsman/1/WQL"
           filter="select InputVoltage,InstanceID,PrimaryStatus,SerialNumber,TotalOutputPower from DCIM_PowerSupplyView where DetailedState != 'Absent'"
           resource-type="dracPowerSupplyIndex">
        <attrib name="InputVoltage" alias="inputVoltage" type="Gauge"/>
        <attrib name="InstanceID" alias="instanceId" type="String"/>
        <attrib name="PrimaryStatus" alias="primaryStatus" type="Gauge"/>
        <attrib name="SerialNumber" alias="serialNumber" type="String"/>
        <attrib name="TotalOutputPower" alias="totalOutputPower" type="Gauge"/>
    </group>

    <system-definition name="Dell iDRAC (All Version)">
        <rule>#productVendor matches '^Dell.*' and #productVersion matches '.*iDRAC.*'</rule>
        <include-group>drac-system</include-group>
        <include-group>drac-power-supply</include-group>
    </system-definition>
</wsman-datacollection-config>
System Definitions
Rules in the system definition are written using SpEL expressions.
The expression has access to the following variables in its evaluation context:
| Name | Type |
|---|---|
(root) |
org.opennms.netmgt.model.OnmsNode |
agent |
org.opennms.netmgt.collection.api.CollectionAgent |
productVendor |
java.lang.String |
productVersion |
java.lang.String |
If a particular agent is matched by any of the rules, then the collector will attempt to collect the referenced groups from the agent.
Group Definitions
Groups are retrieved by issuing an Enumerate command against a particular Resource URI and parsing the results.
The Enumerate commands can include an optional filter in order to filter the records and attributes that are returned.
| When configuring a filter, you must also specify the dialect. |
The resource type used by the group must of be of type node or a generic resource type.
Interface level resources are not supported.
When using a generic resource type, the IndexStorageStrategy cannot be used since records have no implicit index.
Instead, you must use an alternative such as the SiblingColumnStorageStrategy.
If a record includes a multi-valued key, you can collect the value at a specific index with an index-of expression.
This is best demonstrated with an example. Let`s assume we wanted to collect the ServiceTag from the following record:
<IdentifyingDescriptions>CIM:GUID</IdentifyingDescriptions>
<IdentifyingDescriptions>CIM:Tag</IdentifyingDescriptions>
<IdentifyingDescriptions>DCIM:ServiceTag</IdentifyingDescriptions>
<OtherIdentifyingInfo>45454C4C-3700-104A-8052-C3C01BB25031</OtherIdentifyingInfo>
<OtherIdentifyingInfo>mainsystemchassis</OtherIdentifyingInfo>
<OtherIdentifyingInfo>C8BBBP1</OtherIdentifyingInfo>
Specifying, the attribute name OtherIdentifyingInfo would not be sufficient, since there are multiple values for that key.
Instead, we want to retrieve the value for the OtherIdentifyingInfo key at the same index where IdentifyingDescriptions is set to DCIM:ServiceTag.
This can be achieved using the following attribute definition:
<attrib name="OtherIdentifyingInfo" index-of="#IdentifyingDescriptions matches '.*ServiceTag'" alias="serviceTag" type="String"/>Special Attributes
A group can contain the placeholder attribute ElementCount that, during collection, will be populated with the total number of results returned for that group.
This can be used to threshold on the number results returned by an enumeration.
    <group name="Event-1234"
           resource-uri="http://schemas.microsoft.com/wbem/wsman/1/wmi/root/cimv2/*"
           dialect="http://schemas.microsoft.com/wbem/wsman/1/WQL"
           filter="select * from Win32_NTLogEvent where LogFile = 'Some-Application-Specific-Logfile/Operational' AND EventCode = '1234'"
           resource-type="node">
        <attrib name="##ElementCount##" alias="elementCount" type="Gauge"/>
    </group>
6.2.12. XmlCollector
The XmlCollector collects and extracts metrics from XML and JSON documents.
Collector Facts
Class Name |
|
Package |
core |
Supported on Minion |
|
Limitations on Minion
The following handlers are not currently supported on Minion:
-
DefaultJsonCollectionHandler
-
Sftp3gppXmlCollectionHandler
-
Sftp3gppVTDXmlCollectionHandler
Collector Parameters
Use these parameters in the collectd-configuration.xml file.
| Parameter | Description | Required | Default value |
|---|---|---|---|
|
The name of the XML Collection to use. |
required |
|
|
Class that performs the collection. |
optional |
|
The available handlers include:
-
org.opennms.protocols.xml.collector.DefaultXmlCollectionHandler -
org.opennms.protocols.xml.collector.Sftp3gppXmlCollectionHandler -
org.opennms.protocols.xml.vtdxml.DefaultVTDXmlCollectionHandler -
org.opennms.protocols.xml.vtdxml.Sftp3gppVTDXmlCollectionHandler -
org.opennms.protocols.json.collector.DefaultJsonCollectionHandler -
org.opennms.protocols.http.collector.HttpCollectionHandler
XML Collection Configuration
| Understanding resource types helps when editing collector-specific configuration files. |
XML Collections are defined in etc/xml-datacollection-config.xml and etc/xml-datacollection/.
This snippet provides a collection definition named xml-opennms-nodes:
<xml-collection name="xml-opennms-nodes">
  <rrd step="300">
    <rra>RRA:AVERAGE:0.5:1:2016</rra>
    <rra>RRA:AVERAGE:0.5:12:1488</rra>
    <rra>RRA:AVERAGE:0.5:288:366</rra>
    <rra>RRA:MAX:0.5:288:366</rra>
    <rra>RRA:MIN:0.5:288:366</rra>
  </rrd>
  <xml-source url="http://admin:admin@{ipaddr}:8980/opennms/rest/nodes">
     <request method="GET">
        <parameter name="use-system-proxy" value="true"/>
      </request>
    <import-groups>xml-datacollection/opennms-nodes.xml</import-groups>
  </xml-source>
</xml-collection
The request element can have the following child elements:
Parameter |
Description |
Required |
Default value |
|
The connection and socket timeout in milliseconds |
optional |
|
|
How often should the request be repeated in case of an error? |
optional |
0 |
|
Should the system-wide proxy settings be used? Configure the system proxy settings via system properties |
optional |
false |
The referenced opennms-nodes.xml file contains:
<xml-groups>
    <xml-group name="nodes" resource-type="node" resource-xpath="/nodes">
        <xml-object name="totalCount" type="GAUGE" xpath="@totalCount"/>
    </xml-group>
</xml-groups>
With the configuration in place, you can test it using the collect command available in the Karaf Shell:
opennms:collect -n 1 org.opennms.protocols.xml.collector.XmlCollector 127.0.0.1 collection=xml-opennms-nodesCaveats
The org.opennms.protocols.json.collector.DefaultJsonCollectionHandler requires the fetched document to be single element of type object to make xpath query work.
If the root element is an array, it will be wrapped in an object, whereas the original array is accessible as /elements.
6.2.13. XmpCollector
The XmpCollector collects peformance metrics via the X/Open Management Protocol API (XMP) protocol.
Collector Facts
Class Name |
|
Package |
opennms-plugin-protocol-xmp |
Supported on Minion |
|
Collector Parameters
Use these parameters in the collectd-configuration.xml file.
| Parameter | Description | Required | Default value |
|---|---|---|---|
|
The name of the XMP Collection to use. |
required |
|
|
The TCP port on which the agent communicates. |
required |
|
|
The username used for authenticating to the agent. |
optional |
(none) |
|
The timeout used when communicating with the agent. |
optional |
3000 |
|
The number of retries permitted when timeout expires. |
optional |
0 |
6.3. Resource Types
Resource types group sets of performance data measurements for persisting, indexing, and display in the web UI. Each resource type has a unique name, label definitions for display in the UI, and strategy definitions for archiving the measurements for long-term analysis.
There are two labels for a resource type.
The first, label, defines a string to display in the UI.
The second, resourceLabel, defines the template used when displaying each unique group of measurements name for the resource type.
There are two types of strategy definitions for resource types, persistence selector and storage strategies.
The persistence selector strategy filters the group indexes down to a subset for storage on disk.
The storage strategy is used to convert an index into a resource path label for persistence.
There are two special resource types that do not have a resource-type definition.
They are node and ifIndex.
Resource types can be defined inside files in either $OPENNMS_HOME/etc/resource-types.d or $OPENNMS_HOME/etc/datacollection, with the latter being specific for SNMP.
Here is the diskIOIndex resource type definition from $OPENNMS_HOME/etc/datacollection/netsnmp.xml:
<resourceType name="diskIOIndex" label="Disk IO (UCD-SNMP MIB)" resourceLabel="${diskIODevice} (index ${index})">
  <persistenceSelectorStrategy class="org.opennms.netmgt.collection.support.PersistRegexSelectorStrategy">
    <parameter key="match-expression" value="not(#diskIODevice matches '^(loop|ram).*')" />
  </persistenceSelectorStrategy>
  <storageStrategy class="org.opennms.netmgt.dao.support.SiblingColumnStorageStrategy">
    <parameter key="sibling-column-name" value="diskIODevice" />
    <parameter key="replace-all" value="s/^-//" />
    <parameter key="replace-all" value="s/\s//" />
    <parameter key="replace-all" value="s/:\\.*//" />
  </storageStrategy>
</resourceType>
Persistence Selector Strategies
| Class | Description |
|---|---|
org.opennms.netmgt.collection.support.PersistAllSelectorStrategy |
Persist All indexes |
org.opennms.netmgt.collection.support.PersistRegexSelectorStrategy |
Persist indexes based on JEXL evaluation |
PersistRegexSelectorStrategy
The PersistRegexSelectorStrategy class takes a single parameter, match-expression, which defines a JEXL expressions.
On evaulation, this expression should return either true, persist index to storage, or false, discard data.
Storage Strategies
| Class | Storage Path Value |
|---|---|
org.opennms.netmgt.collection.support.IndexStorageStrategy |
Index |
org.opennms.netmgt.collection.support.JexlIndexStorageStrategy |
Value after JexlExpression evaluation |
org.opennms.netmgt.collection.support.ObjectNameStorageStrategy |
Value after JexlExpression evaluation |
org.opennms.netmgt.dao.support.FrameRelayStorageStrategy |
interface label + '.' + dlci |
org.opennms.netmgt.dao.support.HostFileSystemStorageStrategy |
Uses the value from the hrStorageDescr column in the hrStorageTable, cleaned up for unix filesystems. |
org.opennms.netmgt.dao.support.SiblingColumnStorageStrategy |
Uses the value from an SNMP lookup of OID in sibling-column-name parameter, cleaned up for unix filesystems. |
org.opennms.protocols.xml.collector.XmlStorageStrategy |
Index, but cleaned up for unix filesystems. |
IndexStorageStrategy
The IndexStorageStrategy takes no parameters.
JexlIndexStorageStrategy
The JexlIndexStorageStrategy takes two parameters, index-format which is required, and clean-output which is optional.
| Parameter | Description |
|---|---|
index-format |
The JexlExpression to evaluate |
clean-output |
Boolean to indicate whether the index value is cleaned up. |
If the index value will be cleaned up, then it will have all whitespace, colons, forward and back slashes, and vertical bars replaced with underscores. All equal signs are removed.
This class can be extended to create custom storage strategies by overriding the updateContext method to set additional key/value pairs to use in your index-format template.
public class ExampleStorageStrategy extends JexlIndexStorageStrategy {

    private static final Logger LOG = LoggerFactory.getLogger(ExampleStorageStrategy.class);
    public ExampleStorageStrategy() {
        super();
    }

    @Override
    public void updateContext(JexlContext context, CollectionResource resource) {
        context.set("Example", resource.getInstance());
    }
}
ObjectNameStorageStrategy
The ObjectNameStorageStrategy extends the JexlIndexStorageStrategy, so its requirements are the same. Extra key/values pairs are added to the JexlContext which can then be used in the index-format template.
The original index string is converted to an ObjectName and can be referenced as ${ObjectName}. The domain from the ObjectName can be referenced as ${domain}. All key properties
from the ObjectName can also be referenced by ${key}.
This storage strategy is meant to be used with JMX MBean datacollections where multiple MBeans can return the same set of attributes. As of OpenNMS Horizon 20, this is only supported using a HTTP to JMX proxy and using the XmlCollector as the JmxCollector does not yet support indexed groups.
Given an MBean like java.lang:type=MemoryPool,name=Survivor Space, and a storage strategy like this:
<storageStrategy class="org.opennms.netmgt.collection.support.ObjectNameStorageStragegy">
  <parameter key="index-format" value="${domain}_${type}_${name}" />
  <parameter key="clean-output" value="true" />
</storageStrategy>
Then the index value would be java_lang_MemoryPool_Survivor_Space.
FrameRelayStorageStrategy
The FrameRelayStorageStrategy takes no parameters.
HostFileSystemStorageStrategy
The HostFileSystemStorageStrategy takes no parameters. This class is marked as deprecated, and can be replaced with:
<storageStrategy class="org.opennms.netmgt.dao.support.SiblingColumnStorageStrategy">
  <parameter key="sibling-column-name" value="hrStorageDescr" />
  <parameter key="replace-first" value="s/^-$/_root_fs/" />
  <parameter key="replace-all" value="s/^-//" />
  <parameter key="replace-all" value="s/\\s//" />
  <parameter key="replace-all" value="s/:\\\\.*//" />
</storageStrategy>
SiblingColumnStorageStrategy
| Parameter | Description |
|---|---|
sibling-column-name |
Alternate string value to use for index |
replace-first |
Regex Pattern, replaces only the first match |
replace-all |
Regex Pattern, replaces all matches |
Values for replace-first, and replace-all must match the pattern s/regex/replacement/ or an error will be thrown.
XmlStorageStrategy
This XmlStorageStrategy takes no parameters. The index value will have all whitespace, colons, forward and back slashes, and vertical bars replaced with underscores. All equal signs are removed.
6.4. SNMP Property Extenders
When collecting tabular numeric metrics from a given MIB table, it’s helpful to include one or more string properties from each conceptual row of the table in question.
These properties can be used in the resourceLabel attribute of the resourceType associated with the collected data.
When the string property exists as a column in the same table that contains the numeric metrics, it’s easy to associate the string to the correct resource by adding a mibObj with the same instance attribute and a type of string.
For example, the Cisco ENVMON MIB’s temperature status table contains both a numeric gauge for the temperature value and a string describing the associated temperature sensor. A partial walk of this table illustrates this very direct relationship:
ciscoEnvMonTemperatureStatusIndex |
ciscoEnvMonTemperatureStatusDescr (.1.3.6.1.4.1.9.9.13.1.3.1.2) |
ciscoEnvMonTemperatureStatusValue (.1.3.6.1.4.1.9.9.13.1.3.1.3) |
|---|---|---|
|
|
|
|
|
|
|
|
|
|
|
|
To collect the ciscoEnvMonTemperatureStatusDescr and ciscoEnvMonTemperatureStatusValue columns within an SNMP data-collection group, all that’s needed is a resourceType and a group to hold the two mibObj elements corresponding to these two columns.
The mibObj aliases are shortened to maintain compatibility with storage engines that limit the length of column names to 19 characters.
<resourceType name="ciscoEnvMonTemperatureStatusIndex<1>" label="Cisco Temperature" resourceLabel="${cvmTempStatusDescr} (index ${index})">
   <persistenceSelectorStrategy class="org.opennms.netmgt.collection.support.PersistAllSelectorStrategy"/>
   <storageStrategy class="org.opennms.netmgt.collection.support.IndexStorageStrategy"/>
</resourceType>
...
<group name="cisco-temperature" ifType="all">
   <mibObj oid=".1.3.6.1.4.1.9.9.13.1.3.1.2" instance="ciscoEnvMonTemperatureStatusIndex" alias="cvmTempStatusDescr" type="string"/>
   <mibObj oid=".1.3.6.1.4.1.9.9.13.1.3.1.3" instance="ciscoEnvMonTemperatureStatusIndex" alias="cvmTempStatusValue" type="gauge"/>
</group>
Even in cases where the string property exists in a separate MIB table, it’s straightforward to include it as long as the "source" table uses an identical set of index variables.
For example, the ifXTable augments the ifTable, meaning the two tables use the same set of instance identifiers – namely ifIndex.
Whether or not the MIB definition of the second table declares an AUGMENTS relationship to the first table, objects from tables with this kind of relationship can be mixed in the same group.
In this contrived configuration example, ifDescr (which is from ifTable) is freely mixed with ifName and ifAlias (from ifXTable):
<group name="mib2-string-properties-example" ifType="all">
   <mibObj oid=".1.3.6.1.2.1.2.2.1.2" instance="ifIndex" alias="ifDescr" type="string"/>
   <mibObj oid=".1.3.6.1.2.1.31.1.1.1.1" instance="ifIndex" alias="ifName" type="string"/>
   <mibObj oid=".1.3.6.1.2.1.31.1.1.1.18" instance="ifIndex" alias="ifAlias" type="string"/>
</group>
Most SNMP property extenders make it possible to include string properties from a "source" MIB table that is indexed differently from the table containing most of the relevant data. For purposes of configuring property extenders, the table containing the majority of the data (and into which we want to include the string properties) is called the target table, and the table containing the string property is called the source table. Several different extenders are available; selecting the right one depends on the relationship between the target table and the source table.
A few property extenders also exist whose effect is strictly local to the "target" resource. These extenders are useful for dealing in partial indices and other similar operations that do not involve looking outside the target MIB table.
SNMP Property Extenders are used in the context of a property element inside an SNMP data-collection group parent element.
The property element, when it appears, is a sibling of any mibObj elements beneath the same parent group.
The instance and alias attributes of the property element are both required, and serve the same purpose as the same attributes of mibObj.
The class-name attribute of the property element contains the full class name (including package) of the Property Extender class needed to join the source and target tables.
The property element takes a number of parameter child elements; these parameters are used to configure the property extender class named in class-name.
Each extender class recognizes a different set of parameters.
6.4.1. Cisco CBQoS Property Extender
This property extender is used only in very specific circumstances.
When to Use Cisco CBQoS Property Extender
The Cisco CBQoS Property Extender is designed specifically and exclusively for the purpose of including string properties across ifXTable and the several MIB tables that make up the Cisco Class-Based QoS MIB.
It is not useful for any other sets of target and source tables.
Configuring Cisco CBQoS Extended Properties
The complex relationships among the various Cisco CBQoS tables are encapsulated in the code of this property extender class.
As a result, this extender takes only a single parameter, target-property, whose value must be one of policyName, classMapName, interfaceAlias, or interfaceName.
6.4.2. Enum Lookup Property Extender
The Enum Lookup property extender provides a mechanism that works like a lookup table for values of a local MIB table column.
When to use the Enum Lookup Property Extender
The Enum Lookup property extender may be used to map an enumerated set of integer values to a corresponding set of human-sensible textual values.
For example, the dot1dStpPortTable contains two integer columns whose values reflect attributes of a port.
   dot1dStpPortState OBJECT-TYPE (1)
       SYNTAX      INTEGER {
                       disabled(1),
                       blocking(2),
                       listening(3),
                       learning(4),
                       forwarding(5),
                       broken(6)
                   }
  -- ...

   dot1dStpPortEnable OBJECT-TYPE (2)
       SYNTAX      INTEGER {
                       enabled(1),
                       disabled(2)
}| 1 | Port STP state enumerated type |
| 2 | Port enablement status enumerated type |
This extender enables persisting the values of these enumerated integer columns as text that an operator can easiliy recognize.
| While this extender is intended primarily for translating integer values to more descriptive ones as shown in the example below, it could also be used to translate from one set of alphanumeric values to another set. |
Configuring the Enum Lookup Property Extender
The Enum Lookup property extender expects zero or more parameters.
Only the default-value parameter has a fixed name; if it is present, its value is used any time a lookup cannot be completed.
If default-value is not provided and a lookup fails, no value will be returned for the property.
The remaining parameters are named for the input values, and their values represent the output values.
This example shows how to map values of dot1dStpPortState and dot1dStpPortEnable to their textual equivalents.
<resourceType name="dot1dStpPortEntry" label="dot1d STP Port" resourceLabel="${index}">
  <persistenceSelectorStrategy class="org.opennms.netmgt.collection.support.PersistAllSelectorStrategy" />
  <storageStrategy class="org.opennms.netmgt.collection.support.IndexStorageStrategy" />
</resourceType>

...

<groups>
  <group name="dot1dStpPortTable" ifType="all">
    <mibObj oid=".1.3.6.1.2.1.17.2.15.1.3"  instance="dot1dStpPortEntry" alias="dot1dStpPortState"  type="string"/> (1)
    <mibObj oid=".1.3.6.1.2.1.17.2.15.1.4"  instance="dot1dStpPortEntry" alias="dot1dStpPortEnable" type="string"/> (2)
    <mibObj oid=".1.3.6.1.2.1.17.2.15.1.10" instance="dot1dStpPortEntry" alias="dot1dStpPortFwTrans"   type="counter" />
    <property instance="dot1dStpPortEntry" alias="dot1dStpPortStateText" class-name="org.opennms.netmgt.collectd.EnumLookupPropertyExtender"> (3)
      <parameter key="enum-attribute" value="dot1dStpPortState"/>
      <parameter key="1" value="disabled(1)"/>
      <parameter key="2" value="blocking(2)"/>
      <parameter key="3" value="listening(3)"/>
      <parameter key="4" value="learning(4)"/>
      <parameter key="5" value="forwarding(5)"/>
      <parameter key="6" value="broken(6)"/>
    </property>
    <property instance="dot1dStpPortEntry" alias="dot1dStpPortEnableText" class-name="org.opennms.netmgt.collectd.EnumLookupPropertyExtender"> (4)
      <!-- Note absence of parenthetical numeric values; they are entirely optional -->
      <parameter key="1" value="enabled"/>
      <parameter key="2" value="disabled"/>
    </property>
  </group>
</groups>| 1 | Port STP state enumerated integer attribute |
| 2 | Port enablement status enumerated integer attribute |
| 3 | Derived port STP state textual attribute dot1dStpPortStateText |
| 4 | Derived port enablement status textual attribute dot1dStpPortEnableText |
6.4.3. Index Split Property Extender
The Index Split property extender enables extraction of part of a resource’s local instance identifier.
When to use the Index Split Property Extender
The Index Split property extender is useful when collecting data from tables with compound indices, because it enables extraction of a single index component.
For example, the Cisco Airespace bsnAPIfLoadParametersTable is indexed using the tuple of bsnAPDot3MacAdddress and bsnAPIfSlotId.
bsnAPIfLoadParametersEntry OBJECT-TYPE
    -- ...
    DESCRIPTION
        "An entry (conceptual row) in the Table.
        Entries in this MIB are indexed by
        bsnAPDot3MacAddress and bsnAPIfSlotId"
    INDEX           {
                        bsnAPDot3MacAddress,
                        bsnAPIfSlotId
                    } (1)

-- ...| 1 | bsnAPDot3MacAddress is the first component of the compound index for the entry type for bsnAPIfLoadParametersTable |
This extender enables extraction of just the bsnAPIfSlotId component for use in a resource label.
Configuring the Index Split Property Extender
The Index Split property extender expects a single parameter, index-pattern, whose value is a regular expression.
The expression must be general enough to match all possible index values for the table at hand, and should include one capturing group.
The subpattern matched by the expression’s first capturing group will be returned; any further groups are ignored.
This example shows how to extract just the bsnAPIfSlotId index component as a string property.
<group name="bsnAPIfLoadParametersTable" ifType="all">
  <mibObj oid=".1.3.6.1.4.1.14179.2.2.13.1.4" instance="bsnAPIfLoadParametersEntry" alias="bsnAPIfLoadNumOfCli" type="integer" />
  <property instance="bsnAPIfLoadParametersEntry" alias="slotNumber" class-name="org.opennms.netmgt.collectd.IndexSplitPropertyExtender"> (1)
    <parameter key="index-pattern" value="^.+\.(\d+)$" /> (2)
  </property>
</group>| 1 | Derived string property slotNumber |
| 2 | Regular expression; the portion in parentheses is what gets extracted. \d+ means "one or more decimal digit characters". |
6.4.4. Regex Property Extender
The Regex property extender works similarly to the Index Split property extender, with the added capability of importing a string property from a source table.
When to Use the Regex Property Extender
The Regex property extender is useful when some portion of the target MIB table’s index can be used as an index to the source MIB table.
For example, the Cisco Airespace bsnAPIfLoadParametersTable is indexed using the tuple of bsnAPDot3MacAdddress and bsnAPIfSlotId, whereas the bsnAPTable is indexed on bsnAPDot3MacAddress alone.
bsnAPIfLoadParametersEntry OBJECT-TYPE
    -- ...
    DESCRIPTION
        "An entry (conceptual row) in the Table.
        Entries in this MIB are indexed by
        bsnAPDot3MacAddress and bsnAPIfSlotId"
    INDEX           {
                        bsnAPDot3MacAddress,
                        bsnAPIfSlotId
                    } (1)

    -- ...

bsnAPEntry OBJECT-TYPE
    -- ...
    DESCRIPTION
        "An entry in the bsnAPTable."
    INDEX           { bsnAPDot3MacAddress } (2)
-- ...| 1 | bsnAPDot3MacAddress is the first component of the compound index for the entry type for bsnAPIfLoadParametersTable |
| 2 | bsnAPDot3MacAddress is the sole index for the entry type for bsnAPTable |
By extracting just the first index component and using the result as an index into the source MIB table, it’s possible to import the human-sensible bsnAPName string property from the source MIB table.
Configuring the Regex Property Extender
The Regex property extender expects three parameters, all of which are required:
| Name | Description |
|---|---|
|
The name of the |
|
The alias name of the string property to be imported from the source MIB table |
|
A regular expression containing one matching group |
The index-pattern expression must meet the same criteria as for the Index Split property extender.
The subpattern matched by its first capturing group will be used as an index into the source MIB table; any further groups are ignored.
This example shows how to use the value of bsnAPDot3MacAddress as an index into the bsnAPTable.
<resourceType name="bsnAPEntry" label="Cisco Wireless AP" resourceLabel="${bsnAPName} (index ${index})">
  <persistenceSelectorStrategy class="org.opennms.netmgt.collection.support.PersistAllSelectorStrategy" />
  <storageStrategy class="org.opennms.netmgt.collection.support.IndexStorageStrategy" />
</resourceType>

<resourceType name="bsnAPIfLoadParametersEntry" label="Cisco Wireless AP Resources" resourceLabel="${bsnAPName} (index ${index})">
  <persistenceSelectorStrategy class="org.opennms.netmgt.collection.support.PersistAllSelectorStrategy" />
  <storageStrategy class="org.opennms.netmgt.collection.support.IndexStorageStrategy" />
</resourceType>

<groups>
  <group name="bsnAPTable" ifType="all">
    <mibObj oid=".1.3.6.1.4.1.14179.2.2.1.1.3" instance="bsnAPEntry" alias="bsnAPName" type="string" /> (1)
  </group>

  <group name="bsnAPIfLoadParametersTable" ifType="all">
    <mibObj oid=".1.3.6.1.4.1.14179.2.2.13.1.4" instance="bsnAPIfLoadParametersEntry" alias="bsnAPIfLoadNumOfCli" type="integer" />
    <property instance="bsnAPIfLoadParametersEntry" alias="bsnAPName" class-name="org.opennms.netmgt.collectd.RegexPropertyExtender"> (2)
      <parameter key="source-type" value="bsnAPEntry" />
      <parameter key="source-alias" value="bsnAPName" />
      <parameter key="index-pattern" value="^(.+)\.\d+$" /> (3)
    </property>
  </group>
</groups>| 1 | Regular string property bsnAPName on the source table |
| 2 | Extended string property bsnAPName on the target table |
| 3 | Regular expression; the portion in parentheses is what gets extracted. \d+ means "one or more decimal digit characters". |
6.4.5. Pointer-Like Index Property Extender
The Pointer-Like Index property extender makes it possible to use the value of an attribute from the target MIB table as the index into the source MIB table. Unlike the Index Split and Regex extenders, this extender class does not require the target and source MIB tables to share any index components.
When to Use the Pointer-Like Index Property Extender
The Pointer-Like Index property extender is useful when the target MIB table contains a column whose value can be used as an index into the source MIB table.
For example, the Cisco Process MIB’s cpmCPUTotalTable has its own index that is not shared with any other tables, but its cpmCPUTotalPhysicalIndex column contains an integer which can be used as an index into the entPhysicalTable.
cpmCPUTotalEntry OBJECT-TYPE
    -- ...
    DESCRIPTION
        "Overall information about the CPU load. Entries in this
        table come and go as CPUs are added and removed from the
        system."
    INDEX           { cpmCPUTotalIndex } (1)
    -- ...

cpmCPUTotalPhysicalIndex OBJECT-TYPE (2)
    -- ...
    DESCRIPTION
        "The entPhysicalIndex of the physical entity for which
        the CPU statistics in this entry are maintained.
        The physical entity can be a CPU chip, a group of CPUs,
        a CPU card etc. The exact type of this entity is described by
        its entPhysicalVendorType value. If the CPU statistics
        in this entry correspond to more than one physical entity
        (or to no physical entity), or if the entPhysicalTable is
        not supported on the SNMP agent, the value of this object
        must be zero."
    -- ...

entPhysicalEntry       OBJECT-TYPE
    -- ...
    DESCRIPTION
            "Information about a particular physical entity.

            Each entry provides objects (entPhysicalDescr,
            entPhysicalVendorType, and entPhysicalClass) to help an NMS
            identify and characterize the entry, and objects
            (entPhysicalContainedIn and entPhysicalParentRelPos) to help
            an NMS relate the particular entry to other entries in this
            table."
    INDEX   { entPhysicalIndex } (3)
-- ...| 1 | The cpmCPUTotalTable entry type is indexed on cpmCPUTotalIndex, which has no meaning outside this table |
| 2 | The cpmCPUTotalPhysicalIndex column contains a value of entPhysicalIndex corresponding to the CPU referenced in a given row |
| 3 | The entPhysicalTable entry type is indexed on entPhysicalIndex and provides many useful textual columns. |
By treating cpmCPUTotalPhysicalIndex somewhat like a pointer, it’s possible to import string properties from the entPhysicalTable for use in the resource-label.
Some combinations of Cisco hardware and software appear to use values of cpmCPUTotalIndex that are directly interchangeable with entPhysicalIndex.
This relationship does not hold across all product lines or software revisions.
|
Configuring the Pointer-Like Index Property Extender
The Pointer-Like Index property extender expects three parameters, all of which are required:
| Name | Description |
|---|---|
|
The name of the |
|
The alias name of the string property to be imported from the source MIB table |
|
The alias name of the column in the target MIB table whose value may be used as an index into the source MIB table |
This example shows how to use cpmCPUTotalPhysicalIndex as a pointer-like index into the entPhysicalTable.
The target resource gains a pair of string properties, which we will call cpmCPUTotalName and cpmCPUTotalDescr.
<resourceType name="entPhysicalEntry" label="Physical Entity" resourceLabel="${entPhysicalName} (${entPhysicalDescr}))">
   <persistenceSelectorStrategy class="org.opennms.netmgt.collection.support.PersistAllSelectorStrategy"/>
   <storageStrategy class="org.opennms.netmgt.collection.support.IndexStorageStrategy"/>
</resourceType>

<resourceType name="cpmCPUTotalEntry" label="Cisco CPU Total" resourceLabel="${cpmCPUTotalName} (${cpmCPUTotalDescr})">
 <persistenceSelectorStrategy class="org.opennms.netmgt.collection.support.PersistAllSelectorStrategy" />
 <storageStrategy class="org.opennms.netmgt.collection.support.IndexStorageStrategy" />
</resourceType>

<groups>
  <group name="entity-physical-table" ifType="all">
    <mibObj oid=".1.3.6.1.2.1.47.1.1.1.1.2" instance="entPhysicalEntry" alias="entPhysicalDescr" type="string"/> (1)
    <mibObj oid=".1.3.6.1.2.1.47.1.1.1.1.7" instance="entPhysicalEntry" alias="entPhysicalName" type="string"/> (2)
  </group>

  <group name="cpm-cpu-total" ifType="all">
    <mibObj oid=".1.3.6.1.4.1.9.9.109.1.1.1.1.2"  instance="cpmCPUTotalEntry" alias="cpmCPUTotalPhysicalIndex"  type="string" /> (3)
    <mibObj oid=".1.3.6.1.4.1.9.9.109.1.1.1.1.8"  instance="cpmCPUTotalEntry" alias="cpmCPUTotal5minRev"        type="gauge" />
    <property instance="cpmCPUTotalEntry" alias="cpmCPUTotalName" class-name="org.opennms.netmgt.collectd.PointerLikeIndexPropertyExtender"> (4)
      <parameter key="source-type" value="entPhysicalEntry"/>
      <parameter key="source-attribute" value="entPhysicalName"/> (5)
      <parameter key="target-index-pointer-column" value="cpmCPUTotalPhysicalIndex"/>
    </property>
    <property instance="cpmCPUTotalEntry" alias="cpmCPUTotalDescr" class-name="org.opennms.netmgt.collectd.PointerLikeIndexPropertyExtender"> (6)
      <parameter key="source-type" value="entPhysicalEntry"/>
      <parameter key="source-attribute" value="entPhysicalDescr"/> (7)
      <parameter key="target-index-pointer-column" value="cpmCPUTotalPhysicalIndex"/>
    </property>
  </group>
</groups>
<1>, <2> First we collect entPhysicalDescr and entPhysicalName in the source group, which uses a resource-type associated with the entPhysicalTable
<3> Then we collect the pointer-like cpmCPUTotalPhysicalIndex in the target group, whose resource-type is associated with the cpmCPUTotalTable
<4> We derive cpmCPUTotalName in the target group telling the extender to use the pointer-like property’s value as an index into the source table, and specify that we want to "pull over" the source attribute entPhysicalName <5>
<6> Deriving cpmCPUTotalDescr is almost identical, except that this time we are pulling over the value of entPhysicalDescr <7>
6.4.6. SNMP Interface Property Extender
The SNMP Interface property extender does much the same job as the Pointer-Like Index property extender, but it is specialized for importing properties from the ifTable.
Resources representing rows in the ifTable are modeled differently in OpenNMS Horizon compared to other tabular resource types, and this extender accounts for those differences.
When to Use the SNMP Interface Property Extender
Use the SNMP Interface property extender when the string property you want to import is associated with a network interface which is represented by a row in the ifTable.
For example, the dot1dBasePortTable has its own index which does not share any components with any other table, but its dot1dBasePortIfIndex column contains a value that is a valid ifIndex.
   dot1dBasePortEntry OBJECT-TYPE
       -- ...
       DESCRIPTION
           "A list of information for each port of the bridge."
       -- ...
       INDEX  { dot1dBasePort } (1)
  -- ...

   dot1dBasePortIfIndex OBJECT-TYPE (2)
       -- ...
       DESCRIPTION
           "The value of the instance of the ifIndex object,
           defined in IF-MIB, for the interface corresponding
           to this port."
       ::= { dot1dBasePortEntry 2 }
  -- ...

ifEntry OBJECT-TYPE
    -- ...
    DESCRIPTION
            "An entry containing management information applicable to a
            particular interface."
    INDEX   { ifIndex } (3)
::= { ifTable 1 }| 1 | The entry type for dot1dBasePortTable is indexed on dot1dBasePort, which has no significance outside this table |
| 2 | But dot1dBasePortTable contains column dot1dBasePortIfIndex, which tells us the ifIndex corresponding to the physical port underlying to the associated bridge base port |
| 3 | ifIndex is the index of the ifTable entry type (and also of the ifXTable entry type) |
By using this extender, it’s possible to import string attributes from the ifTable, ifXTable, or another table that augments the ifTable.
Configuring the SNMP Interface Property Extender
The SNMP Interface property extender expects two or three parameters:
| Name | Description | Required | Default value |
|---|---|---|---|
|
The alias name of the string property to be imported from the source MIB table |
required |
– |
|
The name of the column in the source MIB table that contains a value of |
optional |
|
|
The name of the column in the target MIB table that contains a value of |
required |
– |
This example shows how to use dot1dBasePortIfIndex as a pointer-like index to import ifDescr from the ifTable, and ifName and ifAlias from the ifXTable, into a trio of new string properties in the target resource.
<resourceType name="dot1dBasePortEntry" label="dot1d Base Port" resourceLabel="${index}">
  <persistenceSelectorStrategy class="org.opennms.netmgt.collection.support.PersistAllSelectorStrategy" />
  <storageStrategy class="org.opennms.netmgt.collection.support.IndexStorageStrategy" />
</resourceType>

<groups>
  <group name="ifTable" ifType="all">
    <mibObj oid=".1.3.6.1.2.1.2.2.1.1"     instance="ifIndex" alias="interfaceIndex" type="string" /> (1)
    <mibObj oid=".1.3.6.1.2.1.2.2.1.2"     instance="ifIndex" alias="interfaceDescr" type="string" />
    <mibObj oid=".1.3.6.1.2.1.31.1.1.1.1"  instance="ifIndex" alias="interfaceName"  type="string" />
    <mibObj oid=".1.3.6.1.2.1.31.1.1.1.18" instance="ifIndex" alias="interfaceAlias" type="string" />
  </group>

  <group name="dot1dBasePortTable" ifType="all">
    <mibObj oid=" .1.3.6.1.2.1.17.1.4.1.1" instance="dot1dBasePortEntry" alias="dot1dBasePort"        type="string" />
    <mibObj oid=" .1.3.6.1.2.1.17.1.4.1.2" instance="dot1dBasePortEntry" alias="dot1dBasePortIfIndex" type="string" /> (2)
    <mibObj oid=" .1.3.6.1.2.1.17.1.4.1.4" instance="dot1dBasePortEntry" alias="d1dBPDelayExDiscard"  type="counter" />
    <mibObj oid=" .1.3.6.1.2.1.17.1.4.1.5" instance="dot1dBasePortEntry" alias="d1dBPMtuExDiscard"    type="counter" />
    <property instance="dot1dBasePortEntry" alias="dot1dBasePortIfDescr" class-name="org.opennms.netmgt.collectd.InterfaceSnmpPropertyExtender"> (3)
      <parameter key="source-ifindex-attribute" value="interfaceIndex"/>
      <parameter key="source-attribute" value="interfaceDescr"/> (4)
      <parameter key="target-ifindex-pointer-column" value="dot1dBasePortIfIndex"/>
    </property>
    <property instance="dot1dBasePortEntry" alias="dot1dBasePortIfName" class-name="org.opennms.netmgt.collectd.InterfaceSnmpPropertyExtender"> (5)
      <parameter key="source-ifindex-attribute" value="interfaceIndex"/>
      <parameter key="source-attribute" value="interfaceName"/> (6)
      <parameter key="target-ifindex-pointer-column" value="dot1dBasePortIfIndex"/>
    </property>
    <property instance="dot1dBasePortEntry" alias="dot1dBasePortIfAlias" class-name="org.opennms.netmgt.collectd.InterfaceSnmpPropertyExtender"> (7)
      <parameter key="source-ifindex-attribute" value="interfaceIndex"/>
      <parameter key="source-attribute" value="interfaceAlias"/> (8)
      <parameter key="target-ifindex-pointer-column" value="dot1dBasePortIfIndex"/>
    </property>
  </group>
</groups>| 1 | First we collect all of ifIndex, ifDescr, ifName, and ifAlias in a group associated with the ifIndex source resource-type, using modified names to avoid collisions with internal workings (the ifIndex type is built in, so we do not need a custom resource-type definition for it) |
| 2 | Then we collect the pointer-like column dot1dBasePortIfIndex in the target group |
| 3 | To derive the dot1dBasePortIfDescr string property, we tell the extender which target attribute contains the pointer-like value, which source column needs to have a matching value, and that we want to "pull over" the interfaceDescr property <4> from the source group |
| 4 | Deriving dot1dBasePortIfName is almost identical, except that we want the property interfaceName <6> from the source group instead |
| 5 | Again with dot1dBasePortIfAlias, we repeat ourselves except that our desired property from the source group is interfaceAlias <8> |
6.5. Administration and Troubleshooting
6.5.1. Collectd Administration
This section describes reference and administrative information associated with collectd.
| File | Description |
|---|---|
|
Configuration file for global collectd daemon and collectors configuration. (See Configuring Collectd.) |
|
Log file for all collectors and the global collectd daemon. |
|
RRD graph definitions to render performance data measurements in the UI. |
|
Directory with RRD graph definitions for devices and applications to render performance data measurements in the UI. |
|
Event definitions for collectd, i.e., dataCollectionSucceeded, and dataCollectionFailed. |
|
Directory to store generic resource type definitions. (See Resource Types.) |
6.5.2. Shell Commands
A number of Karaf Shell commands are made available to help administer and diagnose issues related to performance data collection.
To use the commands, log into the Karaf Shell on your system using:
ssh -p 8101 admin@localhost
The Karaf shell uses the same credential as the web interface.
Users must be associated with the ADMIN role to access the shell.
|
In order to keep the session open while executing long-running tasks without any user input add -o ServerAliveInterval=10 to your ssh command.
|
Ad hoc collection
The opennms:collect Karaf Shell command can be used to trigger and perform a collection on any of the available collectors.
The results of the collection (also referred to as the "collection set") will be displayed in the console after a successful collection. The resulting collection set will not be persisted, nor will any thresholding be applied.
List all of the available collectors:
opennms:list-collectorsInvoke the SnmpCollector against interface 127.0.0.1 on NODES:n1.
opennms:collect -n NODES:n1 org.opennms.netmgt.collectd.SnmpCollector 127.0.0.1Invoke the SnmpCollector against interface 127.0.0.1 on NODES:n1 via the MINION location.
opennms:collect -l MINION -n NODES:n1 org.opennms.netmgt.collectd.SnmpCollector 127.0.0.1| Setting the location on the command line will override the node’s location. |
If you see errors caused by RequestTimedOutException`s when invoking a collector at a remote location, consider increasing the time to live.
By default, `collectd will use the service interval as the time to live.
|
Invoke the JdbcCollector against 127.0.0.1 while specifying some of the collector parameters.
opennms:collect org.opennms.netmgt.collectd.JdbcCollector 127.0.0.1 collection=PostgreSQL driver=org.postgresql.Driver url=jdbc:postgresql://OPENNMS_JDBC_HOSTNAME/postgres user=postgres
Some collectors, such as the JdbcCollector, can be invoked without specifying a node.
|
Persist a collection :
opennms:collect -l MINION -n NODES=n1 -p org.opennms.netmgt.collectd.SnmpCollector 127.0.0.1
-p/--persist option will persist collection set there by introducing an extra datapoint other than data collected during already configured collection interval.
|
A complete list of options is available using:
opennms:collect --helpInterpreting the output
After a successful collection, the collection set will be displayed in the following format:
resource a
  group 1
    attribute
    attribute
  group 2
    attribute
resource b
  group 1
    attribute
...
The description of the resources, groups and attribute may differ between collectors. This output is independent of the persistence strategy that is being used.
Measurements & Resources
The following Karaf Shell commands are made available to help enumerate, view and manage measurement related resources.
The opennms:show-measurement-resources command can be used to enumerate or lookup resources:
admin@opennms> opennms:show-measurement-resources --node NODES:node --no-children

ID:         node[NODES:node]
Name:       NODES:node
Label:      node
Type:       Node
Link:       element/node.jsp?node=NODES:node
Children:
  node[NODES:node].nodeSnmp[]
  node[NODES:node].interfaceSnmp[lo]
  node[NODES:node].interfaceSnmp[opennms-jvm]
  node[NODES:node].responseTime[192.168.238.140]
  node[NODES:node].responseTime[192.168.39.1]
  node[NODES:node].responseTime[172.17.0.1]
  node[NODES:node].responseTime[127.0.0.1]
...
The opennms:delete-measurement-resources command can be used to delete resources, and all of the associated metrics:
admin@opennms> opennms:delete-measurement-resources "node[NODES:node].responseTime[127.0.0.1]"
Deleting measurements and meta-data associated with resource ID 'node[NODES:node].responseTime[127.0.0.1]'...
Done.
The opennms:show-measurements command can be used to render the values of the attributes (measurements) associated with a particular resource:
admin@opennms> opennms:show-measurements -a ifHCInOctets "node[NODES:node].interfaceSnmp[lo]"
Resource with ID 'node[NODES:node].interfaceSnmp[lo]' has attributes: [ifHCOutUcastPkts, ifInDiscards, ifHCInBroadcastPkts, ifHCInOctets, ifHCOutOctets, ifOutErrors, ifHCOutMulticastPkt, ifHCInUcastPkts, ifInErrors, ifHCInMulticastPkts, ifHCOutBroadcastPkt, ifOutDiscards]
Limiting attributes to: [ifHCInOctets]

timestamp,ifHCInOctets
Fri Sep 13 13:30:00 EDT 2019,NaN
Fri Sep 13 13:35:00 EDT 2019,NaN
Fri Sep 13 13:40:00 EDT 2019,NaN
The opennms:show-newts-samples command can be used to view the raw samples (collected values) associated with a particular resource.
admin@opennms> opennms:show-newts-samples -a ifHCInOctets "node[NODES:node].interfaceSnmp[lo]"
Resource with ID 'node[NODES:node].interfaceSnmp[lo]' has attributes: [ifHCOutUcastPkts, ifInDiscards, ifHCInBroadcastPkts, ifOutErrors, ifHCInOctets, ifHCOutMulticastPkt, ifHCOutOctets, ifHCInUcastPkts, ifInErrors, ifHCInMulticastPkts, ifOutDiscards, ifHCOutBroadcastPkt]
Limiting attributes to: [ifHCInOctets]
Fetching samples for Newts resource ID 'snmp:2:lo:mib2-X-interfaces'...
Fri Sep 13 14:31:05 EDT 2019,ifHCInOctets,1271178704.0000
Stress Testing
The opennms:stress-metrics Karaf Shell command can be used to simulate load on the active persistence strategy, whether it be RRDtool, JRobin, or Newts.
The tool works by generating collection sets, similar to those built when performing data collection, and sending these to the active persistence layer. By using the active persistence layer, we ensure that we use the same write path which is used by the actual data collection services.
Generate samples for 10 nodes every 15 seconds and printing the statistic report every 30 seconds:
opennms:stress-metrics -n 10 -i 15 -r 30While active, the command will continue to generate and persist collection sets. During this time you can monitor the system I/O and other relevant statistics.
When your done, use CTRL+C to stop the stress tool.
A complete list of options is available using:
opennms:stress-metrics --helpInterpreting the output
The statistics output by the tool can be be interpreted as follows:
- numeric-attributes-generated
-
The number of numeric attributes that were sent to the persistence layer. We have no guarantee as to whether or not these were actually persisted.
- string-attributes-generated
-
The number of string attributes that were sent to the persistence layer. We have no guarantee as to whether or not these were actually persisted.
- batches
-
The count is used to indicate how many batches of collection sets (one at every interval) were sent to the persistence layer. The timers show how much time was spent generating the batch, and sending the batch to the persistence layer.
7. Thresholding
Thresholding allows you to define limits against network performance metrics of a managed entity to trigger an event when a value goes above or below the specified limit.
-
High
-
Low
-
Absolute Value
-
Relative Change
7.1. How Thresholding Works in OpenNMS Horizon
OpenNMS Horizon uses collectors to implement data collection for a particular protocol or family of protocols (SNMP, JMX, HTTP, XML/JSON, WS-Management/WinRM, JDBC, etc.). You can specify configuration for a particular collector in a collection package: essentially the set of instructions that drives the behavior of the collector.
The collectd daemon gathers and stores performance data from these collectors. This is the data against which OpenNMS Horizon applies thresholds. Thresholds trigger events when a specified threshold value is met. You can further create notifications and alarms for threshold events.
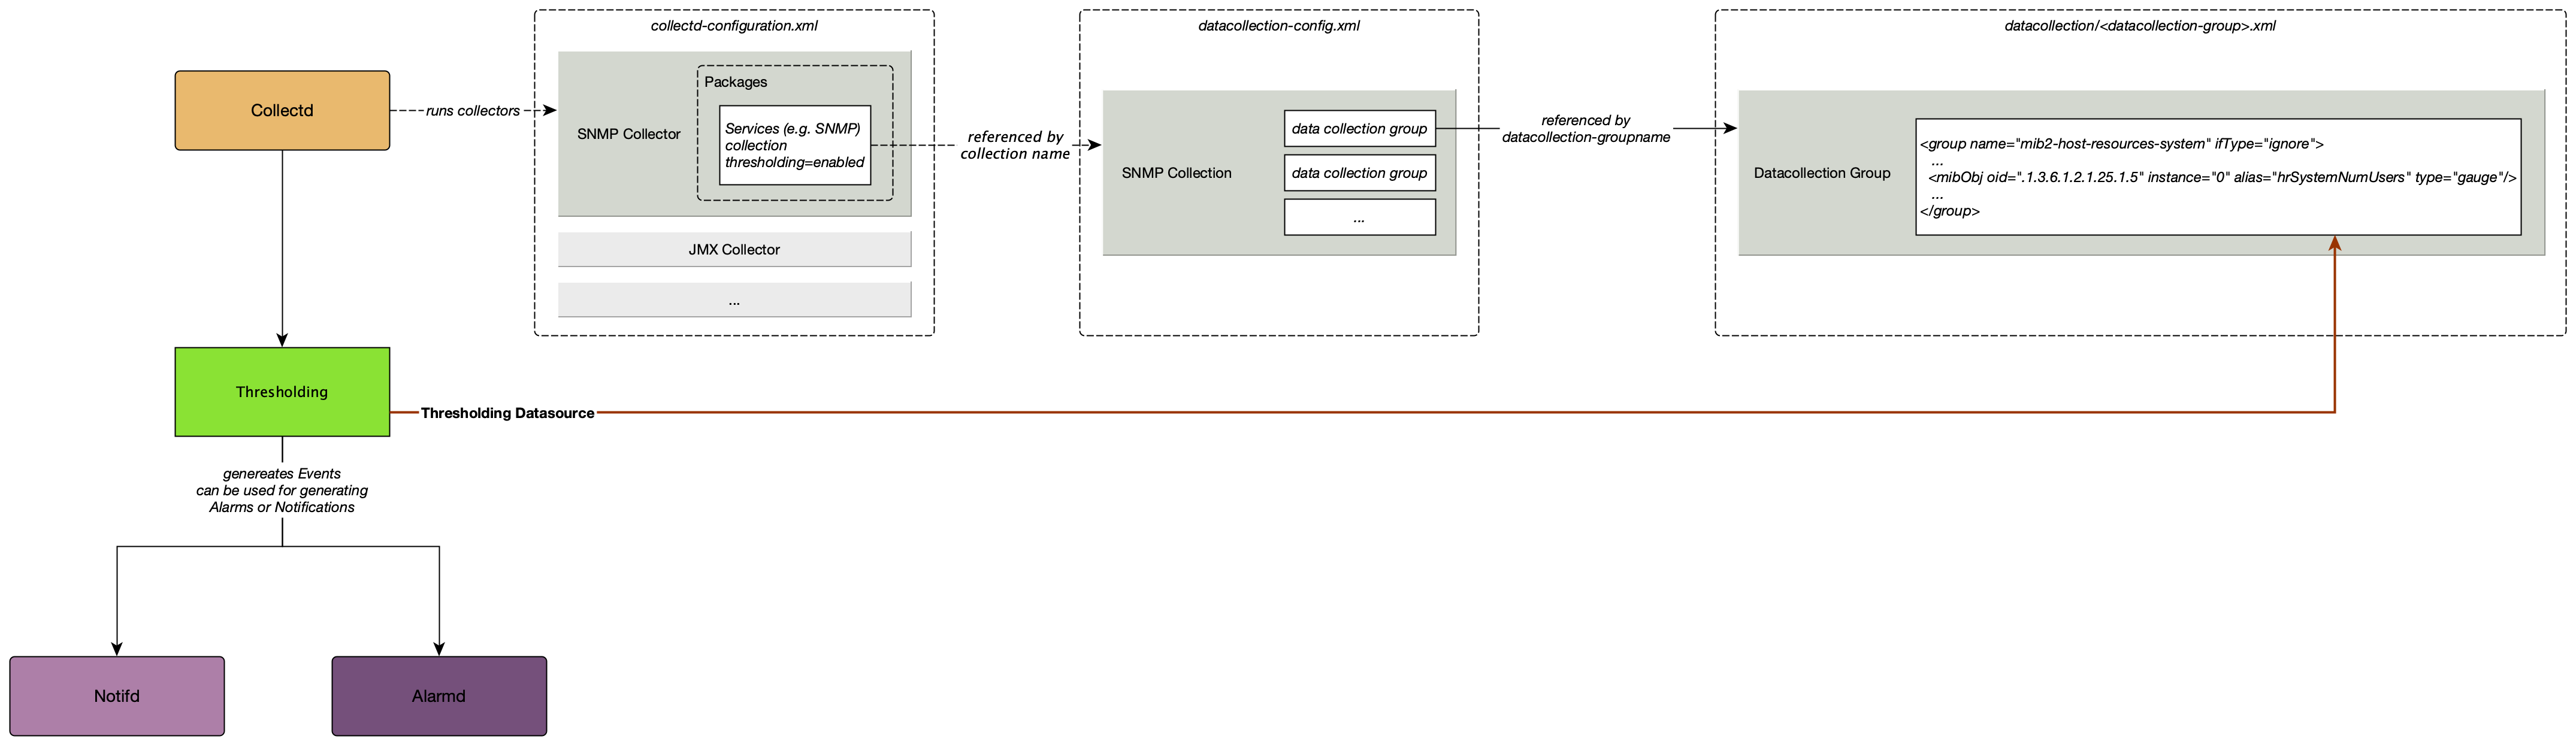
7.2. What Triggers a Thresholding Event?
OpenNMS Horizon uses four thresholding algorithms that trigger an event when the datasource value:
-
Low - equals or drops below the threshold value and re-arms when it equals or comes back up above the re-arm value (e.g., available disk space falls under the specified value)
-
High - equals or exceeds the threshold value, and re-arms when it equals or drops below the re-arm value (e.g., bandwidth use exceeds the specified amount)
-
Absolute - changes by the specified amount (e.g., on a fiber-optic link, a change in loss of anything greater than 3 dB is a problem regardless of what the original or final value is)
-
Relative - changes by percent (e.g., available disk space changes more than 5% from the last poll)
These thresholds can be basic (tested against a single value) or an expression (evaluated against multiple values in an expression).
OpenNMS Horizon applies these algorithms against any performance data (telemetry) collected by collectd or pushed to telemetryd. This includes, but is not limited to, metrics such as CPU load, bandwidth, disk space, etc.
| The basic walkthrough focuses on how to set simple thresholds using default values in the OpenNMS Horizon setup. For information on setting and configuring collectors, collectd, and the collectd-configuration.xml file, see Performance Management. |
7.3. Basic Walk-through – Thresholding
This section describes how to create a basic threshold for a single, system-wide variable: the number of logged-in users. Our threshold will tell OpenNMS Horizon to create an event when the number of logged-in users on the device exceeds two, and re-arm when it falls below two.
Before creating a threshold, you need to make sure you are collecting the metric against which you want to threshold.
7.3.1. Determine You are Collecting Metric
In this case, we have chosen a metric (number of logged-in users) that is collected by default. We are also using data collected via SNMP. (For information on other collectors, see Collectors.)
-
In the OpenNMS Horizon UI, choose
Reports>Resource Graphs. -
Select one of the listed resources.
-
Under
SNMP Node Data, selectNode-level Performance Dataand chooseGraph Selection. -
Scroll to find the
Number of Usersgraph.-
You can click the binoculars icon to display only this graph.
-
7.3.2. Create a Threshold
-
Select
<User_Name>>Configure OpenNMSfrom the top-right menu. -
Under
Performance Measurement, chooseConfigure Thresholds.-
A screen with a list of preconfigured threshold groups appears. We will work with
netsnmp. For information on how to create a threshold group, see Creating a Threshold Group.
-
-
Click
Editbeside thenetsnmpgroup. -
Click
Create New Thresholdat the bottom of theBasic Thresholdsarea of the screen. -
Set the following information and click
Save:
Field |
Value |
Description |
Type |
high |
Triggers an event when the datasource value equals or exceeds the threshold value, and re-arms when it equals or drops below the re-arm value |
Datasource |
hrSystemNumUsers |
Name of the datasource you want to threshold against. For this tutorial, we have provided the datasource for logged-in users. For information on how to determine a metric’s datasource, see Determine the Datasource. |
Datasource label |
leave blank |
Optional text label. Not required for this tutorial. |
Value |
2 |
The value above which we want to trigger an event. In this case, we want to trigger an event when the number of logged-in users exceeds two. |
Re-arm |
2 |
The value below which we want the system to re-arm. In this case, once the number of logged-in users falls below two. |
Trigger |
3 |
The number of consecutive times the threshold value can occur before the system triggers an event. Since our default polling period is 5 minutes, a value of 3 means OpenNMS Horizon would create a threshold event if there are more than 2 users for 15 minutes. |
Description |
leave blank |
Optional text to describe your threshold. |
Triggered UEI |
leave blank |
A custom uniform event identifier (UEI) sent into the events system when the threshold is triggered. A custom UEI for each threshold makes it easier to create notifications. If left blank, it defaults to the standard thresholds UEIs. |
Re-armed UEI |
leave blank |
A custom uniform event identifier (UEI) sent into the events system when the threshold is re-armed. |
7.3.3. Testing the Threshold
To test the threshold we just created, log a second person into the node you are monitoring.
Navigate to the Events page.
You should see an event that indicates your threshold triggered when more than one user logged in.
Log out the second user.
The Events page should indicate that the system has re-armed.
7.3.4. Creating a Threshold for CPU Usage
This procedure describes how to create an expression-based threshold when the five-minute CPU load average metric reaches or goes above 70% for two consecutive measurement intervals. Expression-based thresholds are useful when you need to threshold on a percentage, not the actual value of the data collected.
| Expression-based thresholds work only if the data sources in question lie in the same directory. |
-
Select
<User_Name>>Configure OpenNMSfrom the top-right menu. -
Under
Performance Measurement, chooseConfigure Thresholds. -
Click
Editbeside thenetsnmpgroup. -
Click
Create New Expression-based Threshold. -
Fill in the following information:
Field
Value
Description
Type
high
Triggers an event when the datasource value equals or exceeds the threshold value, and re-arms when it equals or drops below the re-arm value
Expression
((loadavg5 / 100) / CpuNumCpus) * 100
Divides the five-minute CPU load average by 100 (to obtain the effective load average), which is then divided by the number of CPUs. This value is then multiplied by 100 to provide a percentage.
( SNMP does not report in decimals, which is why the expression divides the loadavg5 by 100.)
Datasource type
node
The type of datasource from which you are collecting data.
Datasource label
leave blank
Optional text label. Not required for this tutorial.
Value
70
Trigger an event when the five-minute CPU load average goes above 70%.
Re-arm
50
Re-arm the system when the five-minute CPU load average drops below 50%
Trigger
2
The number of consecutive times the threshold value can occur before the system triggers an event. In this case, when the five-minute CPU load average goes above 70% for two consecutive polling periods.
Description
Trigger an alert when the five-minute CPU load average metric reaches or goes above 70% for two consecutive measurement intervals
Optional text to describe your threshold.
Triggered UEI
leave blank
See the table in Create a Threshold for details.
Re-armed UEI
leave blank
See the table in Create a Threshold for details.
-
Click
Save.
7.3.5. Determining the Datasource
Creating a threshold requires the name of the datasource generating the metrics on which you want to threshold.
Datasource names for the SNMP protocol appear in etc/snmp-graph.properties.d/.
-
To determine the name of the datasource, navigate to the
Resource Graphsscreen. For example,-
Reports>Resource Graphs. -
Select one of the listed resources.
-
Under
SNMP Node Data, selectNode-level Performance Dataand chooseGraph Selection.
-
-
Scroll through the graphs to find the title of the graph that displays the metric on which you want to threshold. For example, "Number of Processes" or "System Uptime":
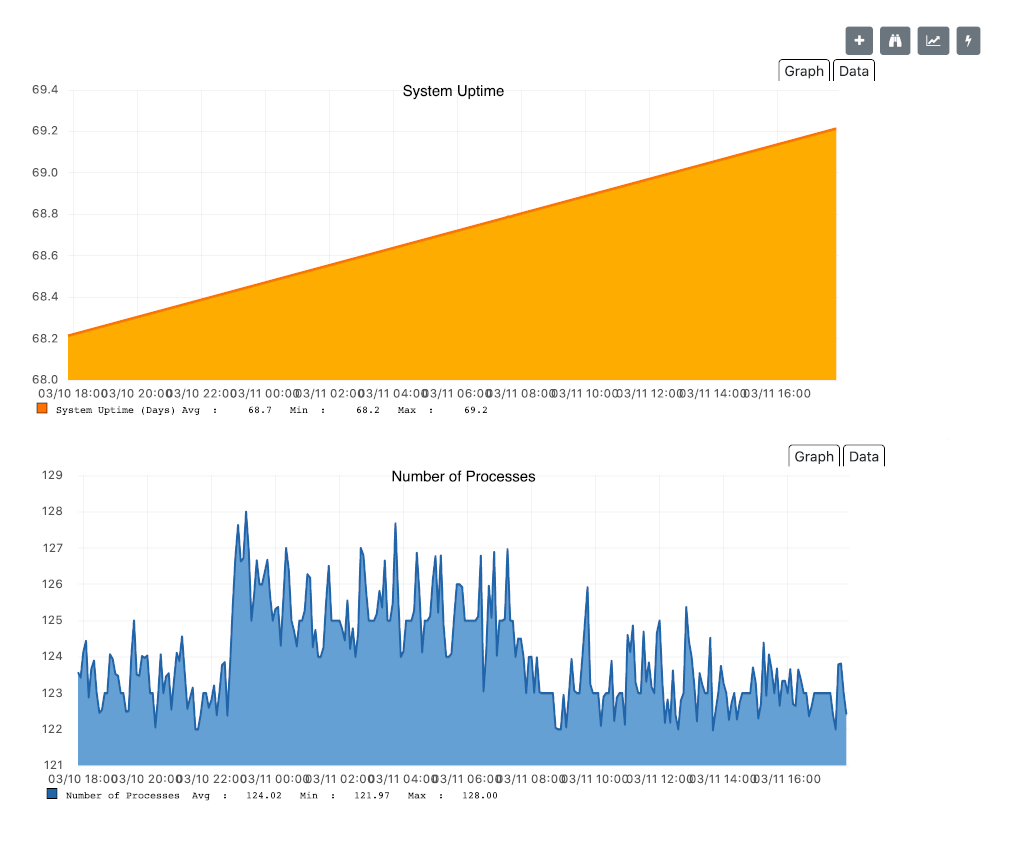
-
Go to
etc/snmp-graph.properties.d/and search for the title of the graph (for example, "System Uptime"). -
Note the name of the datasource, and enter it in the
Datasourcefield when you create your threshold.
7.3.6. Create a Threshold Group
A threshold group associates a set of thresholds to a service (e.g., thresholds that apply to all Cisco devices). OpenNMS Horizon includes seven preconfigured, editable threshold groups:
-
mib2
-
cisco
-
hrstorage
-
netsnmp
-
juniper-srx
-
netsnmp-memory-linux
-
netsnmp-memory-nonlinux
You can edit an existing group (through the UI) or create a new one (in the thresholds.xml file located in $OPENNMS_HOME/etc/thresholds.xml).
Once you create the group, you can then define it in the thresholds.xml file or define it in the UI.
We will create a threshold group called "demo_group".
-
Type the following in the thresholds.xml file.
<group name="demo_group" rrdRepository="/opt/opennms/share/rrd/snmp/"> </group> -
Once you have created the group in the thresholds.xml file, switch to the UI, go to the threshold screen and click
Request a reload threshold packages configuration.-
The group you created should appear in the UI.
-
-
Click
Editto edit it.
The following is a sample of how the threshold appears in the thresholds.xml file:
<group name="demo_group" rrdRepository="/opt/opennms/share/rrd/snmp/"> (1)
  <expression type="high" ds-type="hrStorageIndex" value="90.0"
    rearm="75.0" trigger="2" ds-label="hrStorageDescr"
    filterOperator="or" expression="hrStorageUsed / hrStorageSize * 100.0">
    <resource-filter field="hrStorageType">^\.1\.3\.6\.1\.2\.1\.25\.2\.1\.4$</resource-filter> (2)
  </expression>
</group>| 1 | The name of the group and the directory of the stored data. |
| 2 | The details of the threshold including type, datasource type, threshold value, rearm value, etc. |
7.3.7. Create a Notification on a Threshold Event
A custom UEI for each threshold makes it easier to create notifications.
7.4. Thresholding Service
The Thresholding Service is the component responsible for maintaining the state of the performance metrics and for generating alarms from these when thresholds are triggered (armed) or cleared (unarmed).
The thresholding service listens for and visits performance metrics after they are persisted to the time series database.
The state of the thresholds are held in memory and pushed to persistent storage only when they are changed.
7.4.1. Distributed Thresholding with Sentinel
Thresholding for streaming telemetry with telemetryd is supported on Sentinel when using Newts. When running on Sentinel, the thresholding state can be stored in either Cassandra or PostgreSQL. Given that Newts already requires Cassandra, we recommend using Casssandra in order to help minimize the load on PostgreSQL.
Thresholding on Sentinel uses the same configuration files as OpenNMS Horizon and operates similarly. When a thresholding changes to/from trigger or cleared, and event is published which is processed by OpenNMS Horizon and the alarm is created or updated.
7.5. Shell Commands
The following shell commands are made available to help debug and manage thresholding.
Enumerate the persisted threshold states using opennms:threshold-enumerate:
admin@opennms> opennms:threshold-enumerate
Index   State Key
1       23-127.0.0.1-hrStorageIndex-hrStorageUsed / hrStorageSize * 100.0-/opt/opennms/share/rrd/snmp-RELATIVE_CHANGE
2       23-127.0.0.1-if-ifHCInOctets * 8 / 1000000 / ifHighSpeed * 100-/opt/opennms/share/rrd/snmp-HIGH
3       23-127.0.0.1-node-((loadavg5 / 100) / CpuNumCpus) * 100.0-/opt/opennms/share/rrd/snmp-HIGH
4       23-127.0.0.1-if-ifInDiscards + ifOutDiscards-/opt/opennms/share/rrd/snmp-HIGH
Each state is uniquely identified by a state key and aliased by the given index.
Indexes are scoped to the particular shell session and provided as an alternative to specifying the complete state key in subsequent commands.
Display state details using opennms:threshold-details:
admin@opennms> opennms:threshold-details 1
multiplier=1.333
lastSample=64.77758166043765
previousTriggeringSample=28.862826722171075
interpolatedExpression='hrStorageUsed / hrStorageSize * 100.0'
admin@opennms> opennms:threshold-details 2
exceededCount=0
armed=true
interpolatedExpression='ifHCInOctets * 8 / 1000000 / ifHighSpeed * 100'| Different types of thresholds will display different properties. |
Clear a particular persisted state using opennms:threshold-clear:
admin@opennms> opennms:threshold-clear 2Or clear all the persisted states with opennms:threshold-clear-all:
admin@opennms> opennms:threshold-clear-all
Clearing all thresholding states....done
8. Events
Events are central to the operation of the OpenNMS Horizon platform, so it’s critical to have a firm grasp of this topic.
| Whenever something in OpenNMS Horizon appears to work by magic, it’s probably events working behind the curtain. |
8.1. Anatomy of an Event
Events are structured historical records of things that happen in OpenNMS Horizon and the nodes, interfaces, and services it manages. Every event has a number of fixed fields and zero or more parameters.
- UEI (Universal Event Identifier)
-
A string uniquely identifying the event’s type. UEIs are typically formatted in the style of a URI, but the only requirement is that they start with the string
uei.. - Event Label
-
A short, static label summarizing the gist of all instances of this event.
- Description
-
A long-form description describing all instances of this event.
- Log Message
-
A long-form log message describing this event, optionally including expansions of fields and parameters so that the value is tailored to the event at hand.
- Severity
-
A severity for this event type. Possible values range from
ClearedtoCritical. - Event ID
-
A numeric identifier used to look up a specific event in the OpenNMS Horizon system.
- Operator Instruction
-
A set of instructions for an operator to respond appropriately to an event of this type.
- Alarm Data
-
If this field is provided for an event, OpenNMS Horizon will create, update, or clear alarms for events of that type according to the alarm-data specifics.
8.2. Sources of Events
Events may originate within OpenNMS Horizon itself or from outside.
Internally-generated events can be the result of the platform’s monitoring and management functions (e.g. a monitored node becoming totally unavailable results in an event with the UEI uei.opennms.org/nodes/nodeDown) or they may act as inputs or outputs of housekeeping processes.
The following subsections summarize the mechanisms by which externally-created events can arrive.
8.2.1. SNMP Traps
If SNMP-capable devices in the network are configured to send traps to OpenNMS Horizon, these traps are transformed into events according to pre-configured rules. The Trapd service daemon, which enables OpenNMS Horizon to receive SNMP traps, is enabled by default.
Disabling the Trapd service daemon will render OpenNMS Horizon incapable of receiving SNMP traps.
|
Event definitions are included with OpenNMS Horizon for traps from many vendors' equipment.
Traps forwarded via proxy
When SNMP traps are forwarded through a proxy using SNMPv2c or SNMPv3, preserving the original source IP address is a challenge due to the lack of an agent-addr field in the TRAP-V2 PDU used in those protocol versions.
RFC 3584 defines an optional varbind snmpTrapAddress (.1.3.6.1.6.3.18.1.3.0) which can be added to forwarded traps to convey the original source IP address.
To configure OpenNMS Horizon to honor snmpTrapAddress when present, set use-address-from-varbind="true" in the top-level element of ${OPENNMS_HOME}/etc/trapd-configuration.xml and restart OpenNMS Horizon.
<trapd-configuration<1> snmp-trap-port="162" new-suspect-on-trap="false" use-address-from-varbind="true"<2>/>| 1 | Top-level trapd-configuration element |
| 2 | New attribute to enable use of snmpTrapAddress varbind, when present |
8.2.2. Syslog Messages
Syslog messages sent over the network to OpenNMS Horizon can be transformed into events according to pre-configured rules.
The Syslogd service daemon, which enables OpenNMS Horizon to receive syslog messages over the network, must be enabled for this functionality to work. This service daemon is disabled by default.
|
Parsers
Different parsers can be used to convert the syslog message fields into OpenNMS Horizon event fields.
| Parser | Description |
|---|---|
|
Parser that uses a regex statement to parse the syslog header. |
|
Parser that uses an internal list of grok-style statements to parse the syslog header. |
|
Parser that strictly parses messages in the default pattern of syslog-ng. |
|
Parser that strictly parses the RFC 5424 format for syslog messages. |
RadixTreeSyslogParser
The RadixTreeSyslogParser normally uses a set of internally-defined patterns to parse multiple syslog message formats.
If you wish to customize the set of patterns, you can put a new set of patterns into a syslog-grok-patterns.txt in the etc directory for OpenNMS Horizon.
The patterns are defined in grok-style statements where each token is defined by a %{PATTERN:semantic} clause.
Whitespace in the pattern will match 0…n whitespace characters and character literals in the pattern will match the corresponding characters.
The '%' character literal must be escaped by using a backslash, ie. '\%'.
| The RadixTreeSyslogParser’s grok implementation only supports a limited number of pattern types. However, these patterns should be sufficient to parse any syslog message format. |
The patterns should be arranged in the file from most specific to least specific since the first pattern to successfully match the syslog message will be used to construct the OpenNMS Horizon event.
| Pattern | Description |
|---|---|
|
String containing only valid hostname characters (alphanumeric plus '.', '-' and '_'). |
`HOSTNAMEORIP |
String containing only valid hostname characters or IP address characters (IPv4 or IPv6). |
|
Positive integer. |
`IPADDRESS |
String containing only valid IP address characters (IPv4 or IPv6). |
|
3-character English month abbreviation. |
|
String that contains no whitespace. |
|
String. Because this matches any character, it must be followed by a delimiter in the pattern string. |
|
String that contains only whitespace (spaces and or tabs). |
| Semantic Token | Description |
|---|---|
|
2-digit day of month (1-31). |
|
Facility-priority integer. |
|
String hostname (unqualified or FQDN), IPv4 address, or IPv6 address. |
|
2-digit hour of day (0-23). |
|
Remaining string message. |
|
String message ID. |
|
2-digit minute (0-59). |
|
2-digit month (1-12). |
|
String generic parameter where the parameter’s key is the identifier following "parm" in the semantic token (e.x. parmComponentId maps to a string parameter with key "ComponentId"). |
|
String process ID. |
|
String process name. |
|
2-digit second (0-59). |
|
1- to 6-digit fractional second value as a string. |
|
String timezone value. |
|
Version. |
|
4-digit year. |
8.2.3. ReST
Posting an event in XML format to the appropriate endpoint in the OpenNMS Horizon ReST API will cause the creation of a corresponding event, just as with the XML-TCP interface.
8.2.4. XML-TCP
Any application or script can create custom events in OpenNMS Horizon by sending properly-formatted XML data over a TCP socket.
8.2.5. Receiving IBM Tivoli Event Integration Facility Events
OpenNMS can be configured to receive Events sent using the Tivoli Event Integration Facility.
These EIF events are translated into OpenNMS events using preconfigured rules. The resulting UEI are anchored in the uei.opennms.org/vendor/IBM/EIF/ namespace, with the name of the EIF event class appended.
A sample event configuration for the OMEGAMON_BASE class is included with OpenNMS.
Configuring the EIF Adapter
Once OpenNMS is started and the Karaf shell is accessible, you can install the EIF Adapter feature and configure it to listen on a specific interface and port.
| By default the EIF Adapter is configured to listen on TCP port 1828 on all interfaces. |
[root@localhost /root]# $ ssh -p 8101 admin@localhost
...
opennms> feature:install eif-adapter
opennms> config:edit org.opennms.features.eifadapter
opennms> config:property-set interface 0.0.0.0
opennms> config:property-set port 1828
opennms> config:update
You can check the routes status with the camel:* commands and/or inspect the log with log:tail for any obvious errors.
The feature has a debug level logging that can be used to debug operations.
| Documentation on using the OSGi console embedded in OpenNMS and the related camel commands. |
Features installed through the Karaf shell persist only as long as the ${OPENNMS_HOME}/data directory remains intact. To enable the feature more permanently, add it to the featuresBoot list in ${OPENNMS_HOME}/etc/org.apache.karaf.features.cfg.
|
You should now be able to configure your EIF forwarders to send to this destination, and their events will be translated into OpenNMS Events and written to the event bus.
Troubleshooting
If events are not reaching OpenNMS, check whether the event source (EIF Forwarder) is correctly configured.
Check your event destination configuration. In particular review the HOSTNAME and PORT parameters. Also check that your situations are configured to forward to that EIF destination.
If those appear to be correct verify that the EIF Forwarder can communicate with OpenNMS over the configured port (default 1828).
Review the OSGi log with log:tail or the camel:* commands.
8.2.6. TL1 Autonomous Messages
Autonomous messages can be retrieved from certain TL1-enabled equipment and transformed into events.
The Tl1d service daemon, which enables OpenNMS Horizon to receive TL1 autonomous messages, must be enabled for this functionality to work. This service daemon is disabled by default.
:imagesdir: ../../../images
|
8.2.7. Sink
Events can also be created by routing them to a specific topic on Kafka / ActiveMQ.
The topic name should be of the form OpenNMS.Sink.Events where OpenNMS is default instance id of OpenNMS Horizon.
The instance id is configurable through a system property org.opennms.instance.id.
8.3. The Event Bus
At the heart of OpenNMS Horizon lies an event bus. Any OpenNMS Horizon component can publish events to the bus, and any component can subscribe to receive events of interest that have been published on the bus. This publish-subscribe model enables components to use events as a mechanism to send messages to each other. For example, the provisioning subsystem of OpenNMS Horizon publishes a node-added event whenever a new node is added to the system. Other subsystems with an interest in new nodes subscribe to the node-added event and automatically receive these events, so they know to start monitoring and managing the new node if their configuration dictates. The publisher and subscriber components do not need to have any knowledge of each other, allowing for a clean division of labor and lessening the programming burden to add entirely new OpenNMS Horizon subsystems or modify the behavior of existing ones.
8.3.1. Associate an Event to a given node
There are 2 ways to associate an existing node to a given event prior sending it to the Event Bus:
-
Set the nodeId of the node in question to the event.
-
For requisitioned nodes, set the _foreignSource and _foreignId as parameters to the event. Then, any incoming event without a nodeId and these 2 parameters will trigger a lookup on the DB; if a node is found, the nodeId attribute will be dynamically set into the event, regardless which method has been used to send it to the Event Bus. :imagesdir: ../../images
8.4. Event Configuration
The back-end configuration surrounding events is broken into two areas: the configuration of Eventd itself, and the configuration of all types of events known to OpenNMS Horizon.
8.4.1. The eventd-configuration.xml file
The overall behavior of Eventd is configured in the file OPENNMS_HOME/etc/eventd-configuration.xml.
This file does not need to be changed in most installations.
The configurable items include:
- TCPAddress
-
The IP address to which the
EventdXML/TCP listener will bind. Defaults to127.0.0.1. - TCPPort
-
The TCP port number on
TCPAddressto which theEventdXML/TCP listener will bind. Defaults to5817. - UDPAddress
-
The IP address to which the
EventdXML/UDP listener will bind. Defaults to127.0.0.1. - UDPPort
-
The UDP port number on
TCPAddressto which theEventdXML/UDP listener will bind. Defaults to5817. - receivers
-
The number of threads allocated to service the event intake work done by
Eventd. - queueLength
-
The maximum number of events that may be queued for processing. Additional events will be dropped. Defaults to unlimited.
- getNextEventID
-
An SQL query statement used to retrieve the ID of the next new event. Changing this setting is not recommended.
- socketSoTimeoutRequired
-
Whether to set a timeout value on the
Eventdreceiver socket. - socketSoTimeoutPeriod
-
The socket timeout, in milliseconds, to set if
socketSoTimeoutRequiredis set toyes. - logEventSummaries
-
Whether to log a simple (terse) summary of every event at level
INFO. Useful when troubleshooting event processing on busy systems whereDEBUGlogging is not practical.
8.4.2. The eventconf.xml file and its tributaries
The set of known events is configured in OPENNMS_HOME/etc/eventconf.xml.
This file opens with a <global> element, whose <security> child element defines which event fields may not be overridden in the body of an event submitted via any Eventd listener.
This mechanism stops a mailicious actor from, for instance, sending an event whose operator-action field amounts to a phishing attack.
After the <global> element, this file consists of a series of <event-file> elements.
The content of each <event-file> element specifies the path of a tributary file whose contents will be read and incorporated into the event configuration.
These paths are resolved relative to the OPENNMS_HOME/etc directory; absolute paths are not allowed.
Each tributary file contains a top-level <events> element with one or more <event> child elements.
Consider the following event definition:
<event>
<uei>uei.opennms.org/nodes/nodeLostService</uei>
<event-label>OpenNMS-defined node event: nodeLostService</event-label>
<descr><p>A %service% outage was identified on interface
%interface% because of the following condition: %parm[eventReason]%.</p> <p>
A new Outage record has been created and service level
availability calculations will be impacted until this outage is
resolved.</p></descr>
<logmsg dest="logndisplay">
%service% outage identified on interface %interface%.
</logmsg>
<severity>Minor</severity>
<alarm-data reduction-key="%uei%:%dpname%:%nodeid%:%interface%:%service%" alarm-type="1" auto-clean="false"/>
</event>Every event definition has this same basic structure. See Anatomy of an Event for a discussion of the structural elements.
When setting severities of events, it’s important to consider each event in the context of your infrastructure as a whole.
Events whose severity is critical at the zoomed-in level of a single device may not merit a Critical severity in the zoomed-out view of your entire enterprise.
Since an event with Critical severity can never have its alarms escalated, this severity level should usually be reserved for events that unequivocally indicate a truly critical impact to the business.
Rock legend Nigel Tufnel offered some wisdom on the subject.
Various tokens can be included in the description, log message, operator instruction and automatic actions for each event. These tokens will be replaced by values from the current event when the text for the event is constructed. Not all events will have values for all tokens, and some refer specifically to information available only in events derived from SNMP traps.
%eventid%-
The event’s numeric database ID
%uei%-
The Universal Event Identifier for the event.
%source%-
The source of the event (which OpenNMS Horizon service daemon created it).
%descr%-
The event description.
%logmsg%-
The event logmsg.
%time%-
The time of the event.
%shorttime%-
The time of the event formatted using DateFormat.SHORT for a completely numeric date/time.
%dpname%-
The ID of the Minion (formerly distributed poller) that the event was received on.
%nodeid%-
The numeric node ID of the device that caused the event, if any.
%nodelabel%-
The node label for the node given in
%nodeid%if available. %nodelocation%-
The node location for the node given in
%nodeid%if available. %host%-
The host at which the event was generated.
%interface%-
The IP interface associated with the event, if any.
%foreignsource%-
The Requisition name for the node given in
%nodeidif available. %foreignid%-
The Requisition ID for the node given in
%nodeidif available. %ifindex%-
The interface’s SNMP ifIndex.
%interfaceresolv%-
Does a reverse lookup on the
%interface%and returns its name if available. %service%-
The service associated with the event, if any.
%severity%-
The severity of the event.
%snmphost%-
The host of the SNMP agent that generated the event.
%id%-
The SNMP Enterprise OID for the event.
%idtext%-
The decoded (human-readable) SNMP Enterprise OID for the event (?).
%ifalias%-
The interface’s SNMP ifAlias.
%generic%-
The Generic trap-type number for the event.
%specific%-
The Specific trap-type number for the event.
%community%-
The community string for the trap.
%version%-
The SNMP version of the trap.
%snmp%-
The SNMP information associated with the event.
%operinstruct%-
The operator instructions for the event.
%mouseovertext%-
The mouse over text for the event.
%tticketid%-
The trouble ticket id associated with the event if available.
%primaryinterface%-
The primary interface IP address for the node given in
%nodeid%if available.
The use of multiple Minions in one location can break the alarm life-cycle for a some OpenNMS features.
To avoid this problem, the %dpname% value can always be replaced by an empty string by setting
org.opennms.netmgt.eventd.cleardpname to true in the file opennms.properties.
|
A node may have additional asset records stored for it.
You can access these records using the asset replacement token, which takes the form:
%asset[<token>]%-
The asset field <token>'s value, or "Unknown" if it does not exist.
A node may have additional hardware details stored for it.
You can access these details using the hardware replacement token, which takes the form:
%hardware[<token>]%-
The hardware field <token>'s value.
Many events carry additional information in parameters (see Anatomy of an Event).
These parameters may start life as SNMP trap variable bindings, or varbinds for short.
You can access event parameters using the parm replacement token, which takes several forms:
%parm[all]%-
Space-separated list of all parameter values in the form
parmName1="parmValue1" parmName2="parmValue2"and so on. %parm[values-all]%-
Space-separated list of all parameter values (without their names) associated with the event.
%parm[names-all]%-
Space-separated list of all parameter names (without their values) associated with the event.
%parm[<name>]%-
Will return the value of the parameter named
<name>if it exists. %parm[##]%-
Will return the total number of parameters as an integer.
%parm[#<num>]%-
Will return the value of parameter number
<num>(one-indexed). %parm[name-#<num>]%-
Will return the name of parameter number
<num>(one-indexed).
eventconf.xml tributary filesThe ordering of event definitions is very important, as an incoming event is matched against them in order. It is possible and often useful to have several event definitions which could match variant forms of a given event, for example based on the values of SNMP trap variable bindings.
The tributary files included via the <event-file> tag have been broken up by vendor. When OpenNMS Horizon starts, each tributary file is loaded in order.
The ordering of events inside each tributary file is also preserved.
The tributary files listed at the very end of eventconf.xml contain catch-all event definitions.
When slotting your own event definitions, take care not to place them below these catch-all files; otherwise your definitions will be effectively unreachable.
-
To save memory and shorten startup times, you may wish to remove event definition files that you know you do not need.
-
If you need to customize some events in one of the default tributary files, you may wish to make a copy of the file containing only the customized events, and slot the copy above the original; this practice will make it easier to maintain your customizations in case the default file changes in a future release of OpenNMS Horizon.
8.4.3. Reloading the event configuration
After making manual changes to OPENNMS_HOME/etc/eventconf.xml or any of its tributary files, you can trigger a reload of the event configuration by issuing the following command on the OpenNMS Horizon server:
OPENNMS_HOME/bin/send-event.pl uei.opennms.org/internal/reloadDaemonConfig -p 'daemonName Eventd'8.5. Debugging
When debugging events, it may be helpful to lower the minimum severity at which Eventd will log from the default level of WARN.
To change this setting, edit OPENNMS_HOME/etc/log4j2.xml and locate the following line:
<KeyValuePair key="eventd" value="WARN" />Changes to log42.xml will be take effect within 60 seconds with no extra action needed.
At level DEBUG, Eventd will log a verbose description of every event it handles to OPENNMS_HOME/logs/eventd.log.
On busy systems, this setting may create so much noise as to be impractical.
In these cases, you can get terse event summaries by setting Eventd to log at level INFO and setting logEventSummaries="yes" in OPENNMS_HOME/etc/eventd-configuration.xml.
Note that changes to eventd-configuration.xml require a full restart of OpenNMS Horizon.
8.5.1. Karaf Shell
The opennms:show-event-config command can be used to render the event definition for one or more event UEIs (matching a substring) to XML.
This command is useful for displaying event definitions which may not be easily accessible on disk, or verifying that particular events were actually loaded.
$ ssh -p 8101 admin@localhost
...
admin@opennms()> opennms:show-event-config -u uei.opennms.org/alarms
9. Alarms
OpenNMS Horizon has the ability to monitor the state of problems with its managed entities (ME), their resources, the services they provide, as well as the applications they host; or more simply, the Network. In OpenNMS Horizon, the state of these problems are characterized as Alarms.
Before Alarmd was created, OpenNMS' Events (or messages) were used not only as interprocess communication messages (IPC), but also as indications of problems in the network. Even today, OpenNMS Events still carry problem state attributes such as: Acknowledgement and Severity. However, these attributes have long since been functionally deprecated now that Alarms are used as the indicator for problems in the network, (see also Situations and Business Services).
| A significant change occurred with the release of Horizon 23.0.0 (H23). Prior to H23 and since the introduction of Alarms in OpenNMS, Alarmd was designed and configured to track the state of a problem using two Alarms; a Down and an Up Alarm. Now, OpenNMS is designed with the intention to use a single Alarm to track the state of a problem. The old behavior can be re-enabled by setting the system property org.opennms.alarmd.legacyAlarmState = true. |
9.1. Single Alarm Tracking Problem States

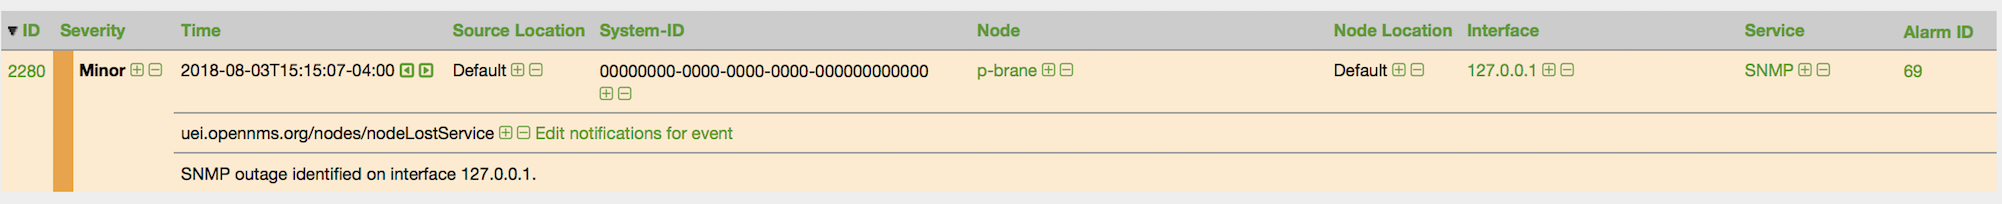

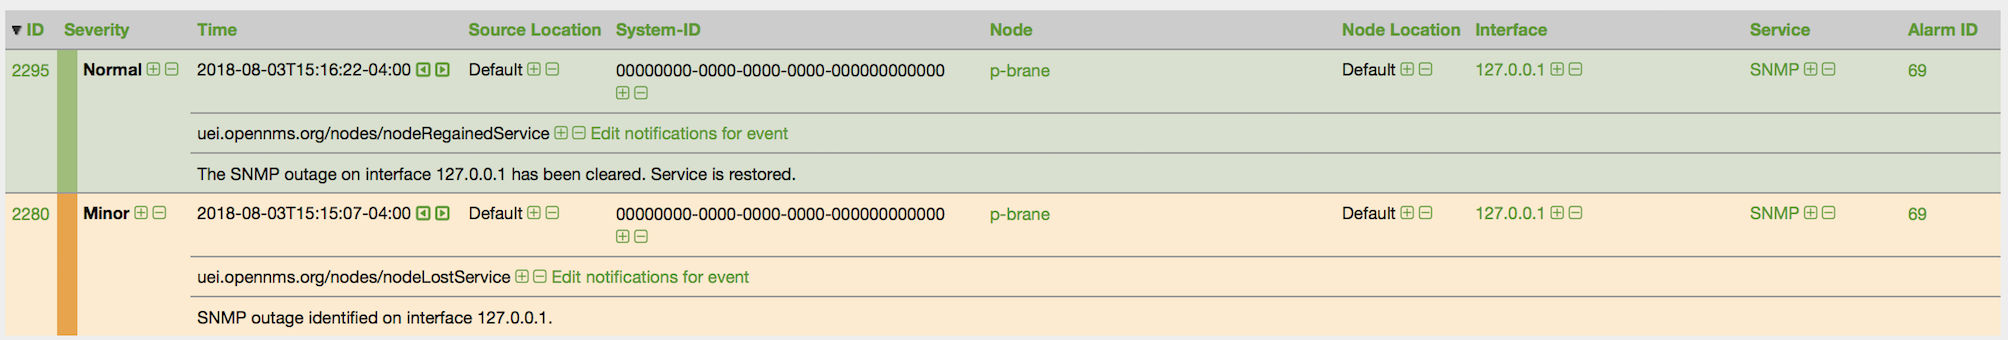

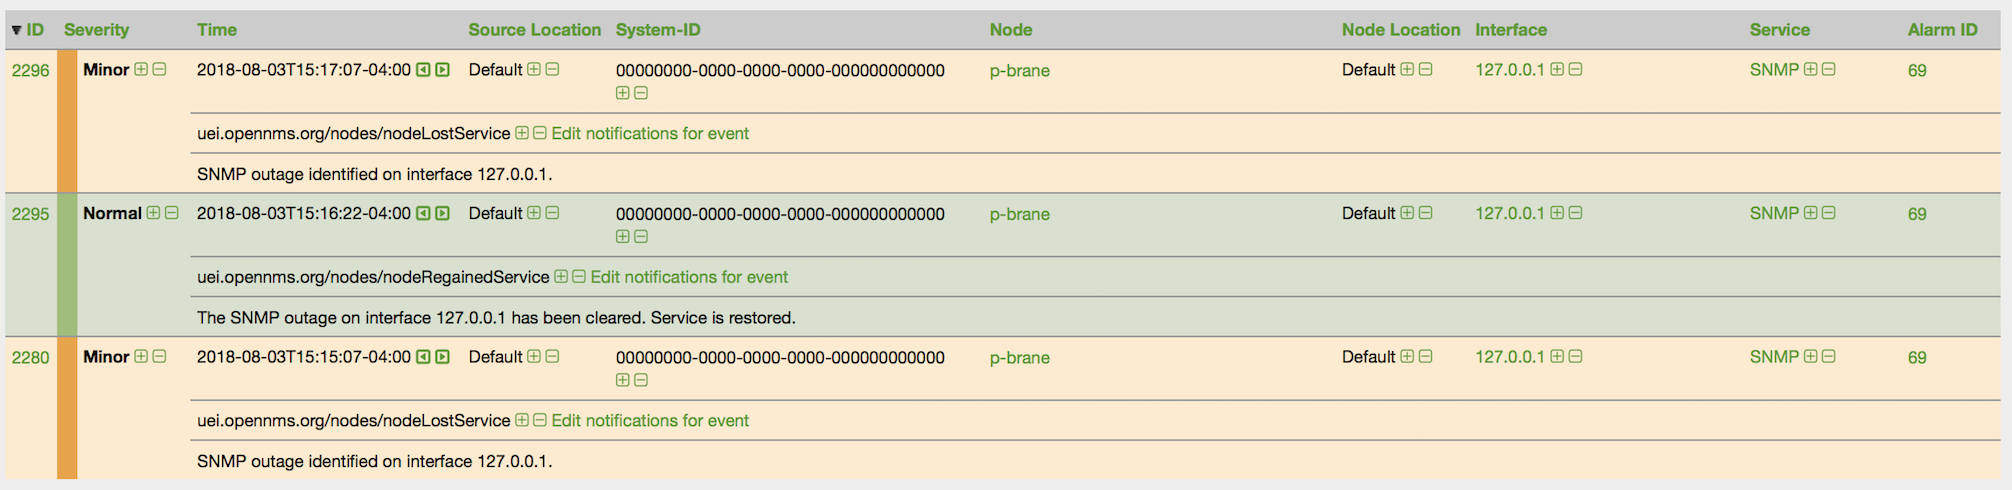

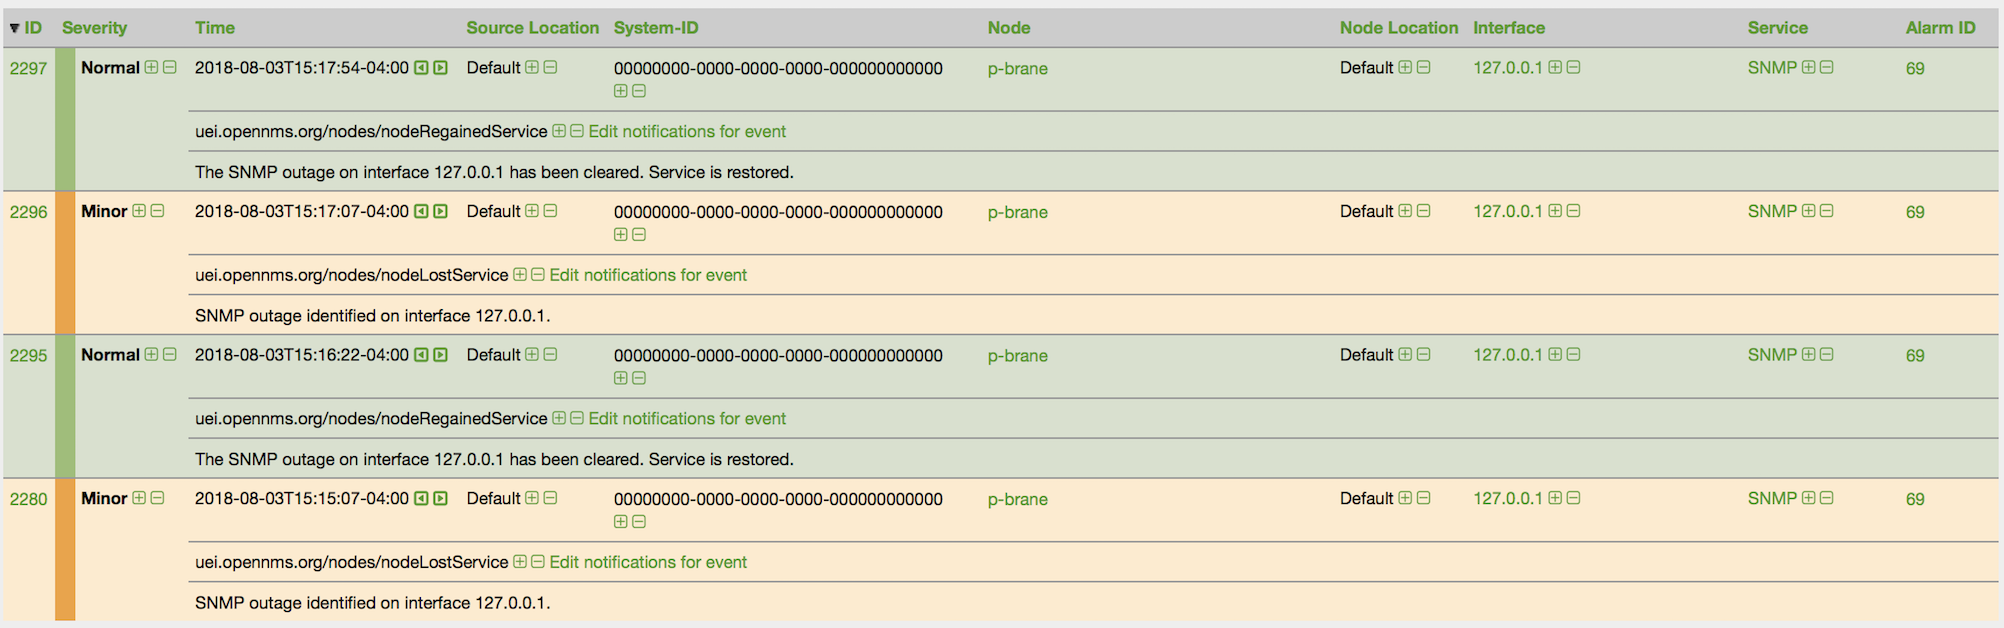
9.2. Alarm Service Daemon
Alarmd, the Alarm Service Daemon, has the very simple task of processing Events representing problems in the Network. It either instantiates a new alarm for tracking a problem’s state or reducing a reoccurring Event of an existing problem into the same Alarm. (Also known as Alarm de-duplication)
Prior to OpenNMS Horizon version 23.0.0 (H23), Alarmd had no configuration. With the release of H23, Drools is now imbedded directly inline with Alarmd’s Event processing function. This provides users with a more robust infrastructure for the effective management of workflow and problem states in the Network. Business rules now replace the function of the ''Automations'' that were previously defined in Vacuumd’s configuration. You will find these new business rules in the etc/alarmd/drools-rules.d/ folder.
alarmd.drl
9.3. Configuring Alarms
Since Alarmd instantiates Alarms from Events, defining Alarms in OpenNMS Horizon entails defining an additional XML element of an Event indicating a problem or resolution in the Network. This additional element is the "alarm-data" element.
| Any Event that is marked as "donotpersist" in the logmsg element’s "dest" attribute, will not be processed as an Alarm. |
<element name="alarm-data">
  <annotation>
    <documentation>This element is used for converting events into alarms.</documentation>
  </annotation>
  <complexType>
    <sequence>
      <element ref="this:update-field" minOccurs="0" maxOccurs="unbounded" />
    </sequence>
    <attribute name="reduction-key" type="string" use="required" />
    <attribute name="alarm-type" use="required" >
      <simpleType>
        <restriction base="int">
          <minInclusive value="1"/>
        </restriction>
      </simpleType>
    </attribute>
    <attribute name="clear-key" type="string" use="optional" />
    <attribute name="auto-clean" type="boolean" use="optional" default="false" />
    <attribute name="x733-alarm-type" type="this:x733-alarm-type" use="optional" />
    <attribute name="x733-probable-cause" type="int" use="optional" />
  </complexType>
</element>

<element name="update-field">
  <complexType>
    <attribute name="field-name" type="string" use="required" />
    <attribute name="update-on-reduction" type="boolean" use="optional" default="true" />
    <attribute name="value-expression" type="string" use="optional" default="" />
  </complexType>
</element>

<simpleType name="x733-alarm-type">
  <restriction base="string" >
    <pattern value="CommunicationsAlarm|ProcessingErrorAlarm|EnvironmentalAlarm|QualityOfServiceAlarm|EquipmentAlarm|IntegrityViolation|SecurityViolation|TimeDomainViolation|OperationalViolation|PhysicalViolation" />
  </restriction>
</simpleType>
NOTE See also: Anatomy of an Event
The critical attribute when defining the alarm-data of an Event, is the reduction-key. This attribute can contain literal strings as well as references to properties (fields and parameters) of the Event. The purpose of the reduction-key is to uniquely identify the signature of a problem and, as such, is used to reduce (de-duplicate) Events so that only one problem is instantiated. Most commonly, the event’s identifier (UEI) is used as the left most (least significant) portion of the reduction-key, followed by other properties of the Event from least to most significant and, traditionally, separated with the literal ':'.
<event>
   <uei>uei.opennms.org/nodes/nodeDown</uei>
...
   <alarm-data reduction-key="%uei%:%dpname%:%nodeid%" alarm-type="1" auto-clean="false"/>
</event>| Decreasing the significance of the reduction-key is a way to aggregate, for example, all nodes down in to a single alarm. However, there are caveats: |
<event>
  <uei>uei.opennms.org/nodes/nodeDown</uei>
  <alarm-data reduction-key="%uei%" alarm-type="1"/>
</event>
With this reduction-key, a single alarm would be instantiated for all nodes that were determined by the Poller to be down. There would be a single alarm with the count representing the number of nodes down. However, the UEI uei.opennms.org/nodes/nodeUp would not be a good ''pair wise'' reduction-key for resolving this alarm as it would take only a single ''node up'' to clear all nodes down tracked with this single alarm configuration.
The second most critical attribute is the alarm-type. There are currently three types of alarms: problem (1), resolution (2), and notification (3). The alarm-type attribute helps Alarmd with pair-wise resolution… the matching of resolution events to problem events.
This attribute is used in the pair-wise correlation feature of Alarmd. When configuring a resolution Alarm, set this attribute to match the reduction-key of a the corresponding problem Alarm.
This attribute instructs Alarmd to only retain the most recent Event reduced into an alarm. For alarms that are super chatty, this is a way to reduce the size of the most recent Events in the database.
| Do not use this feature with Alarms that have pair-wise correlation (matching problems with resolutions). |
Use this element to override Alarmd’s default behavior for which some fields are updated during reduction. The Alarm fields that are currently allowed to be controlled this way are: .Bulleted * distpoller * ipaddr * mouseover * operinstruct * severity * descr * acktime * ackuser
| With the new single alarm behavior in H23, if an Alarm transitions from an alarm-type 2 back to alarm-type 1 the Severity will be set to the most Event’s value. |
Alarmd is designed to reduce multiple occurrences of an Alarm into a single alarm.
Alarmd is also intrinsically designed to automatically match resolving events with an existing Alarm. Alarms with matching resolutions with problems (Ups with Downs), should be indicated with the alarm-type attribute. .Bulleted * alarm-type="1" (problem alarm) * alarm-type="2" (resolving alarm) * alarm-type="3" (notification alarm… alarm with no resolution such as SNMP Authentication Failures)
|
Instantiate new Alarms for existing cleared problem
Also new in H23, a global property setting that controls behavior of alarm reduction of currently cleared Alarms.
|
Create a properties file called alarmd.properties in the $OPENNMS_ETC/opennms.properties.d/ folder and add the following property set to true:
###### Alarmd Properties ######
#
# Enable this property to force Alarmd to create new alarms when an problem re-occurs and the
# existing Alarm is in a "Cleared" state.
#
# Default: false
#org.opennms.alarmd.newIfClearedAlarmExists = false
org.opennms.alarmd.newIfClearedAlarmExists = true
Now, with this property set, when a repeat incident occurs and the current state of the Alarm tracking the problem is "Cleared", instead of restating the current Alarm to it’s default severity and incrementing the counter, a new instance of the Alarm will be created.
.New node down Alarm with existing cleared Alarm

What happens is that Alarmd will alter the existing Alarm’s reductionKey to be unique. Thus preventing it from ever again being reused for a reoccurring problem in the Network (the literal ":ID:" and the alarm ID is appended to the reductionKey).
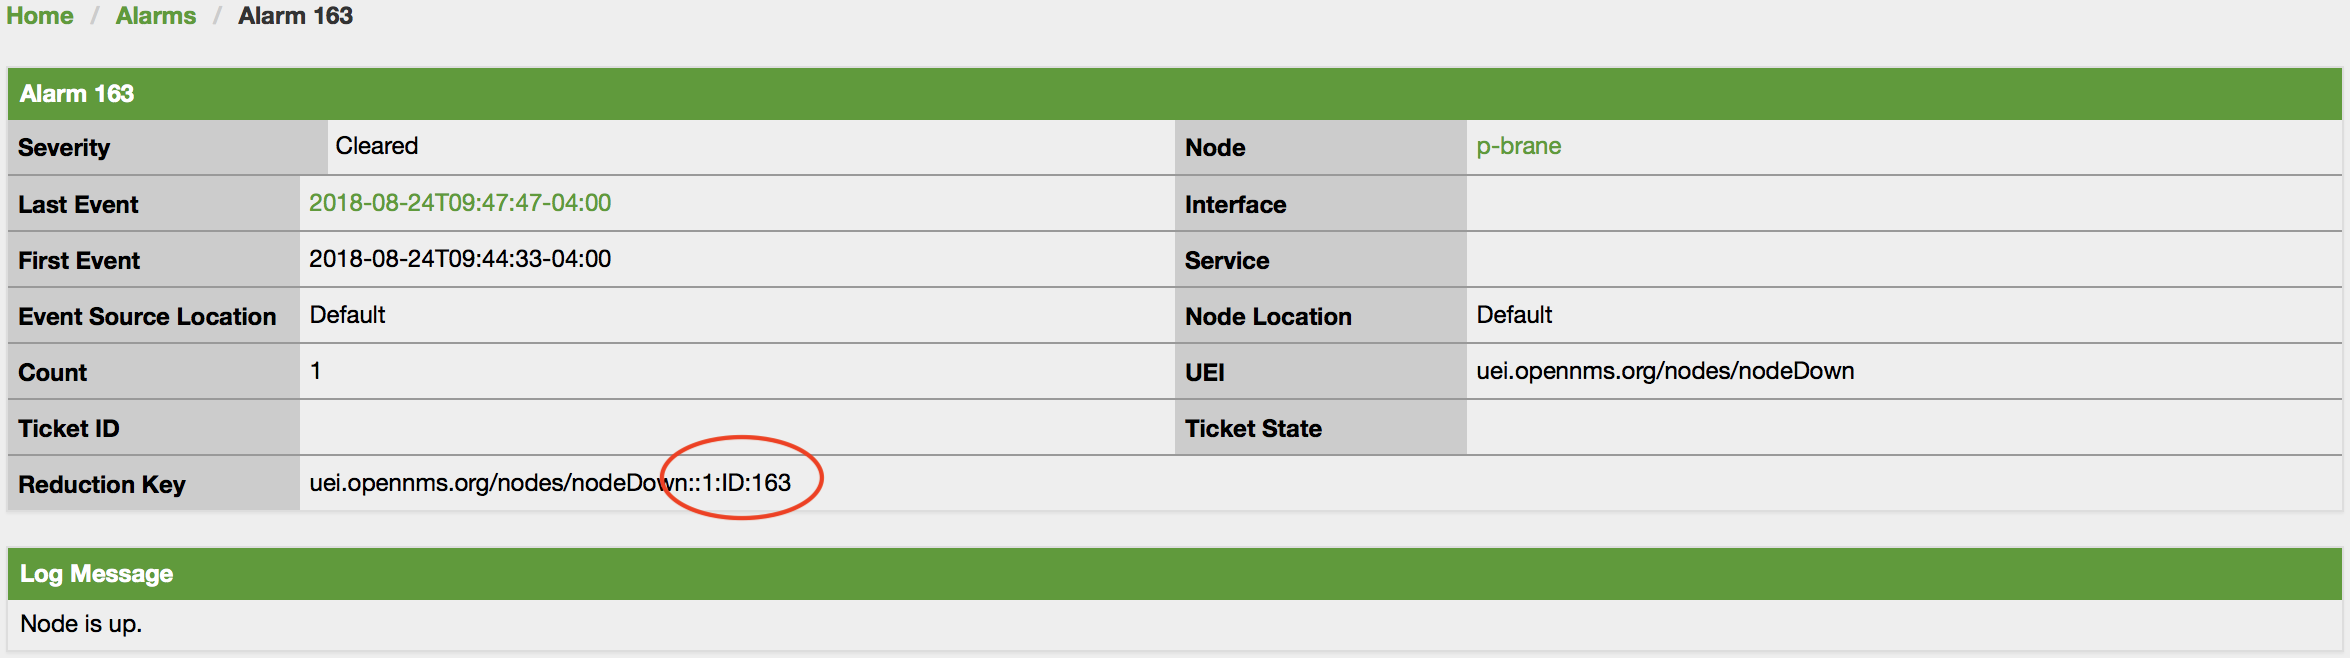
|
Re-enable legacy dual Alarm state behavior
Now in H23, a global property setting can set to re-enable the legacy dual Alarm behavior.
|
Create a properties file called alarmd.properties in the $OPENNMS_ETC/opennms.properties.d/ folder and add the following property set to true:
###### Alarmd Properties ######
# Enable this property to have the traditional dual alarm handling of alarms state
# for Alarm pairwise correlation.
# Default: false
#org.opennms.alarmd.legacyAlarmState = false
org.opennms.alarmd.legacyAlarmState = true| Setting legacyAlarmState will nullify newIfClearedAlarmExists |
9.4. Alarm Notes
OpenNMS Horizon creates an Alarm for issues in the network. Working with a few people in a team, it is helpful to share information about a current Alarm. Alarm Notes can be used to assign comments to a specific Alarm or a whole class of Alarms. . The figure Alarm Detail View shows the component to add these information in Memos to the Alarm.
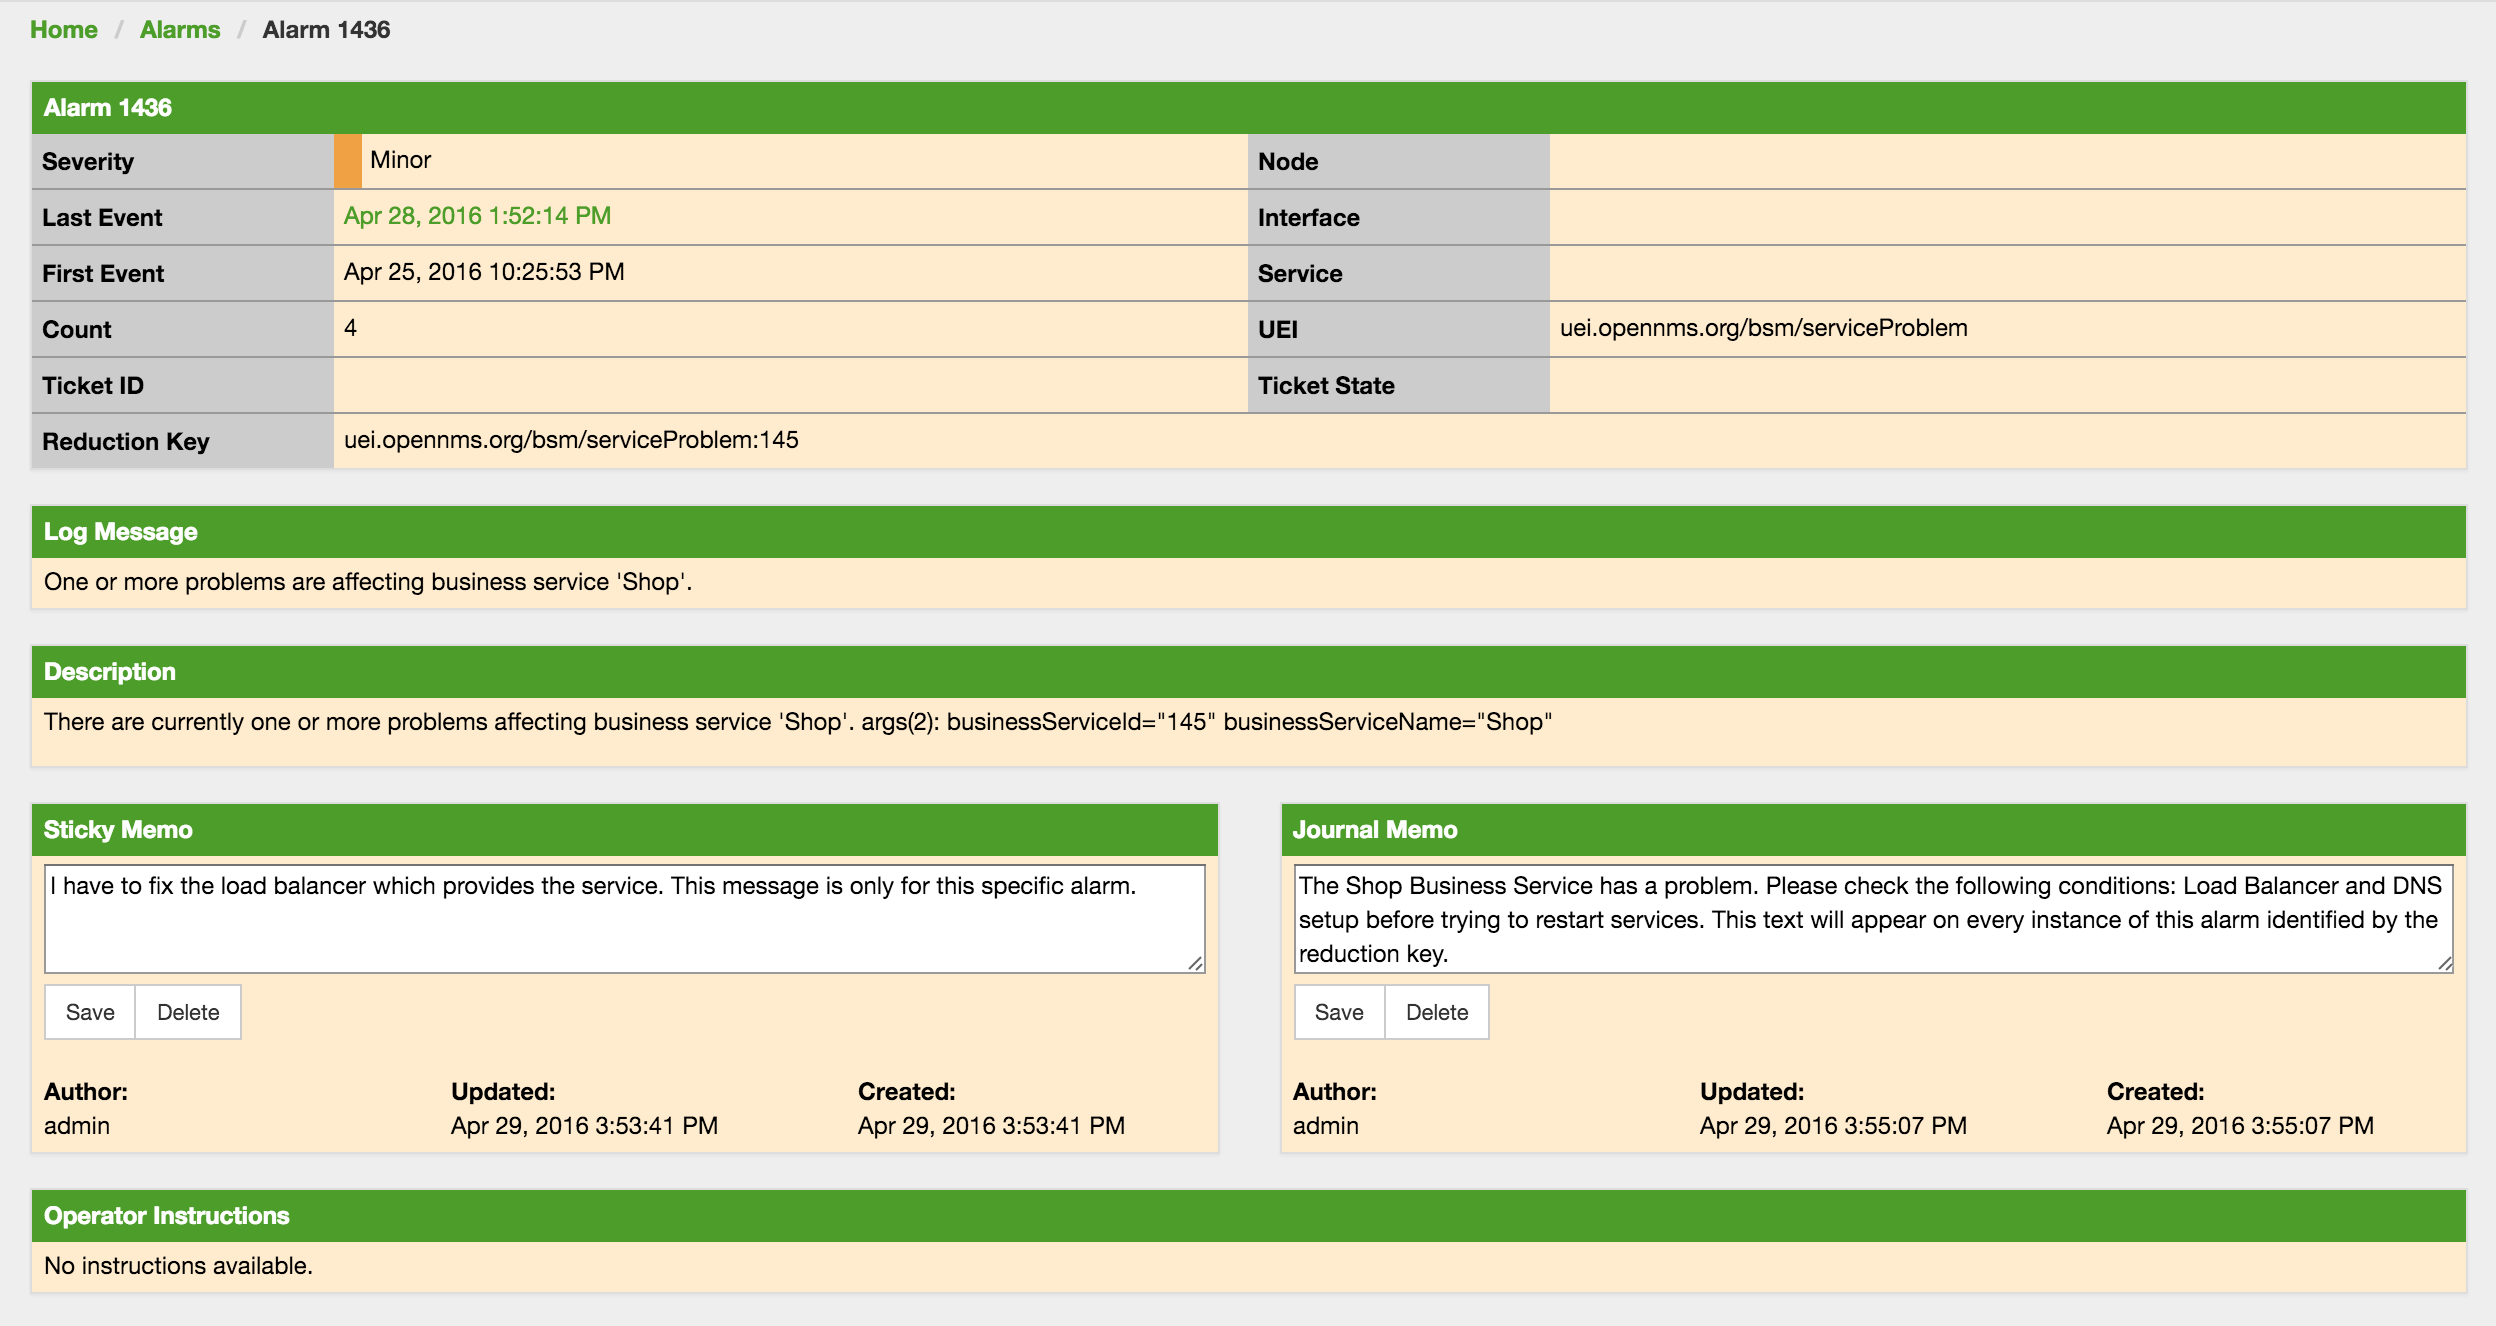
The Alarm Notes allows to add two types of notes on an existing Alarm or Alarm Class:
-
Sticky Memo: A user defined note for a specific instance of an Alarm. Deleting the Alarm will also delete the sticky memo.
-
Journal Memo: A user defined note for a whole class of alarms based on the resolved reduction key. The Journal Memo will be shown for all Alarms matching a specific reduction key. Deleting an Alarm doesn’t remove the Journal Memo, they can be removed by pressing the "Clear" button on an Alarm with the existing Journal Memo.
If an Alarm has a sticky and/or a Journal Memo it is indicated with two icons on the "Alarm list Summary" and "Alarm List Detail".
9.5. Alarm Sounds
Often users want an audible indication of a change in alarm state. The OpenNMS Horizon alarm list page has the optional ability to generate a sound either on each new alarm or (more annoyingly) on each change to an alarm event count on the page.
The figure Alarm Sounds View shows the alarm list page when alarms sounds are enabled.
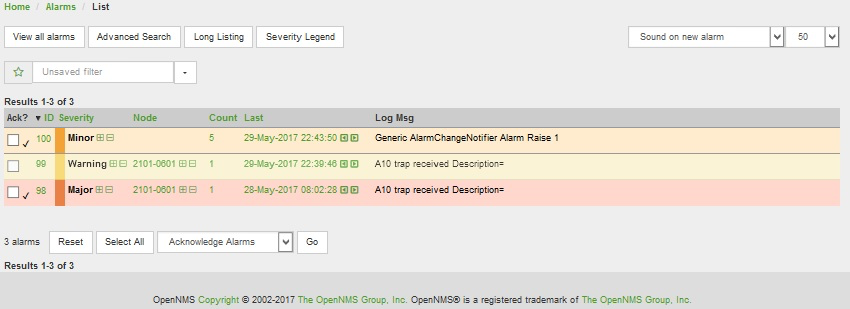
By default the alarm sound feature is disabled. System Administrators must activate the sound feature and also set the default sound setting for all users. However users can modify the default sound setting for the duration of their logged-in session using a drop down menu with the following options:
-
Sound off: no sounds generated by the page.
-
Sound on new alarm: sounds generated for every new alarm on the page.
-
Sound on new alarm count: sounds generated for every increase in alarm event count for alarms on the page.
9.6. Flashing Unacknowledged Alarms
By default OpenNMS Horizon displays the alarm list page with acknowledged and unacknowledged alarms listed in separate search tabs. In a number of operational environments it is useful to see all of the alarms on the same page with unacknowledged alarms flashing to indicate that they haven’t yet been noticed by one of the team. This allows everyone to see at a glance the real time status of all alarms and which alarms still need attention.
The figure Alarm Sounds View also shows the alarm list page when flashing unacknowledged alarms are enabled. Alarms which are unacknowledged flash steadily. Alarms which have been acknowledged do not flash and also have a small tick beside the selection check box. All alarms can be selected to be escalated, cleared, acknowledged and unacknowledged.
9.7. Configuring Alarm Sounds and Flashing
By default OpenNMS Horizon does not enable alarm sounds or flashing alarms. The default settings are included in opennms.properties. However rather than editing the default opennms.properties file, the system administrator should enable these features by creating a new file in opennms.properties.d and applying the following settings;
${OPENNMS_HOME}/etc/opennms.properties.d/alarm.listpage.properties
# ###### Alarm List Page Options ######
# Several options are available to change the default behaviour of the Alarm List Page.
# <opennms url>/opennms/alarm/list.htm
#
# The alarm list page has the ability to generate a sound either on each new alarm
# or (more annoyingly) on each change to an alarm event count on the page.
#
# Turn on the sound feature. Set true and Alarm List Pages can generate sounds in the web browser.
opennms.alarmlist.sound.enable=true
#
# Set the default setting for how the Alarm List Pages generates sounds. The default setting can be
# modified by users for the duration of their logged-in session using a drop down menu .
#    off = no sounds generated by the page.
#    newalarm = sounds generated for every new alarm in the page
#    newalarmcount = sounds generated for every increase in alarm event count for alarms on the page
#
opennms.alarmlist.sound.status=off

# By default the alarm list page displays acknowledged and unacknowledged alarms in separate search tabs
# Some users have asked to be able to see both on the same page. This option allows the alarm list page
# to display acknowledged and unacknowledged alarms on the same list but unacknowledged alarms
# flash until they are acknowledged.
#
opennms.alarmlist.unackflash=true
The sound played is determined by the contents of the following file ${OPENNMS_HOME}/jetty-webapps/opennms/sounds/alert.wav
If you want to change the sound, create a new wav file with your desired sound, name it alert.wav and replace the default file in the same directory.
9.8. Alarm History
The Alarm History feature integrates with Elasticsearch to provide long term storage and maintain a history of alarm state changes.
When enabled, alarms are indexed in Elasticsearch when they are created, deleted, or when any of the "interesting" fields on the alarm are updated (more on this below.)
Alarms are indexed in such a fashion that allows operators to answer the following questions:
-
What were all the state changes of a particular alarm?
-
What was the last known state of an alarm at a given point in time?
-
Which alarms were present (i.e. not deleted) on the system at a given point in time?
-
Which alarms are currently present on the system?
A simple REST API is also made available for the purposes of evaluating the results, verifying the data that is stored and providing examples on how to query the data.
9.8.1. Requirements
This feature requires Elasticsearch 7.x.
9.8.2. Setup
Alarm history indexing can be enabled as follows:
First, login to the Karaf shell of your OpenNMS Horizon instance and configure the Elasticsearch client settings to point to your Elasticsearch cluster. See Elasticsearch Integration Configuration for a complete list of available options.
$ ssh -p 8101 admin@localhost
...
admin@opennms()> config:edit org.opennms.features.alarms.history.elastic
admin@opennms()> config:property-set elasticUrl http://es:9200
admin@opennms()> config:update
Next, install the opennms-alarm-history-elastic feature from that same shell using:
admin@opennms()> feature:install opennms-alarm-history-elasticIn order to ensure that the feature continues to be installed as subsequent restarts, add opennms-alarm-history-elastic to the featuresBoot property in the ${OPENNMS_HOME}/etc/org.apache.karaf.features.cfg.
9.8.3. Alarm indexing
When alarms are initially created, we push a document to Elasticsearch that includes all of the alarm fields as well as additional details on some of the related objects (i.e. the node.)
In order to avoid pushing a new document every time a new event is reduced on to an existing alarm, we only push a new document when (at least) one of these conditions are met:
-
We have not recently pushed a document for that alarm. (See
alarmReindexDurationMs.) -
The severity of the alarm has changed.
-
The alarm has been acknowledged or unacknowledged.
-
Either of the associated sticky or journal memos have changed.
-
The state of the associated ticket has changed.
-
The alarm has been associated with, or removed, from a situation.
-
A related alarm has been added or removed from the situation.
To change this behaviour and push a new document for every change, you can set indexAllUpdates to true.
|
When alarms are deleted, we push a new document that contains the alarm id, reduction key, and deletion time.
The following table describes a subset of the fields in the alarm document:
| Field | Description |
|---|---|
|
Timestamp in milliseconds associated with the first event that triggered this alarm. |
|
Timestamp in milliseconds associated with the last event that triggered this alarm. |
|
Timestamp in milliseconds at which the document was created. |
|
Timestamp in milliseconds when the alarm was deleted. |
|
Database ID associated with the alarm. |
|
Key used to reduce events on to the alarm. |
|
Severity of the alarm. |
|
Numerical ID used to represent the severity. |
9.8.4. Options
In addition to those mentioned in Elasticsearch Integration Configuration, the following properties can be set in ${OPENNMS_HOME}/etc/org.opennms.features.alarms.history.elastic.cfg:
| Property | Description | Required | default |
|---|---|---|---|
indexAllUpdates |
Index every alarm update, including simple event reductions. |
optional |
|
alarmReindexDurationMs |
Number of milliseconds to wait before re-indexing an alarm if nothing "interesting" has changed. |
optional |
|
lookbackPeriodMs |
Number of milliseconds to go back when searching for alarms. |
optional |
|
batchIndexSize |
Maximum number of records inserted in a single batch insert. |
optional |
|
bulkRetryCount |
Number of retries until a bulk operation is considered failed. |
optional |
|
taskQueueCapacity |
Maximum number of tasks to hold in memory. |
optional |
|
10. Notifications
10.1. Introduction
OpenNMS Horizon uses notifications to make users aware of an event. Common notification methods are email and paging, but notification mechanisms also exist for:
-
Browser based desktop notifications
-
Arbitrary HTTP GET and POST operations
-
Arbitrary external commands
-
Asterisk call origination
-
IRCcat Internet Relay Chat bot
-
SNMP Traps
-
Slack, Mattermost, and other API-compatible team chat platforms
-
Twitter, GNU Social, and other API-compatible microblog services
-
User-provided scripts in any JSR-223 compatible language
-
XMPP
The notification daemon Notifd creates and sends notifications according to configured rules when selected events occur in OpenNMS Horizon.
10.2. Getting Started
The status of notifications is indicated by an icon at the top right of the web UI’s navigation bar. OpenNMS Horizon installs with notifications globally disabled by default.
10.2.1. Enabling Notifications
To enable notifications in OpenNMS Horizon, log in to the web UI as a user with administrator privileges. Hover over the user icon and click the Configure OpenNMS link. The controls for global notification status appear in the top-level configuration menu as Notification Status. Click the On radio button and then the Update button. Notifications are now globally enabled.
The web workflow above is functionally equivalent to editing the notifd-configuration.xml file and setting status="on" in the top-level notifd-configuration element.
This configuration file change is picked up on the fly with no need to restart or send an event.
|
10.2.2. Configuring Destination Paths
To configure notification destination paths in OpenNMS Horizon, navigate to Configure OpenNMS and, in the Event Management section, choose Configure Notifications. In the resulting dialog choose Configure Destination Paths.
The destination paths configuration is stored in the destinationPaths.xml file.
Changes to this file are picked up on the fly with no need to restart or send an event.
|
10.2.3. Configuring Event Notifications
To configure notifications for individual events in OpenNMS Horizon, navigate to Configure OpenNMS and, in the Event Management section, choose _Configure Notifications. Then choose Configure Event Notifications.
The event notification configuration is stored in the notifications.xml file.
Changes to this file are picked up on the fly with no need to restart or send an event.
|
The filter rule configured in notifications.xml, for ex: <rule>IPADDR != '0.0.0.0'</rule> is not strict by default.
That means if there is any event that is not associated with any node/interface, it would not validate rule and by default notification would be saved. The rule can be changed to be strict i.e.
<rule strict="true">IPADDR != '0.0.0.0'</rule> then the rule will always be evaluated and if there is no node/interface associated with event, notification wouldn’t be saved.
|
By default, OpenNMS executes the destination path of all notifications matching the event’s uei.
You can configure OpenNMS to only execute the destination path of the first matching notification by editing the notifd-configuration.xml file and setting match-all="false" in
the top-level notifd-configuration element.
This configuration file change is picked up on the fly with no need to restart or send an event.
|
10.3. Concepts
Notifications are how OpenNMS Horizon informs users about an event that happened in the network, without the users having to log in and look at the UI. The core concepts required to understand notifications are:
-
Events and UEIs
-
Users, Groups, and On-Call Roles
-
Duty Schedules
-
Destination Paths
-
Notification Commands
These concepts fit together to form an Event Notification Definition. Also related, but presently only loosely coupled to notifications, are Alarms and Acknowledgments.
10.3.1. Events and UEIs
As discussed in the chapter on Events, events are central to the operation of OpenNMS Horizon. Almost everything that happens in the system is the result of, or the cause of, one or more events; Every notification is triggered by exactly one event. A good understanding of events is therefore essential to a working knowledge of notifications.
Every event has a UEI (Uniform Event Identifier), a string uniquely identifying the event’s type.
UEIs are typically formatted in the style of a URI, but the only requirement is that they start with the string uei..
Most notifications are triggered by an exact UEI match (though they may also be triggered with partial UEI matches using regular expression syntax).
10.3.2. Users, Groups, and On-Call Roles
Users are entities with login accounts in the OpenNMS Horizon system. Ideally each user corresponds to a person. They are used to control access to the web UI, but also carry contact information (e-mail addresses, phone numbers, etc.) for the people they represent. A user may receive a notification either individually or as part of a Group or On-Call Role. Each user has several technology-specific contact fields, which must be filled if the user is to receive notifications by the associated method.
Groups are lists of users. In large systems with many users it is helpful to organize them into Groups. A group may receive a notification, which is often a more convenient way to operate than on individual user. Groups allow to assign a set of users to On Call Roles to build more complex notification workflows.
-
Login as a User with administrative permissions
-
Choose Configure OpenNMS from the user specific main navigation which is named as your login user name
-
Choose Configure Users, Groups and On-Call roles and select Configure Groups
-
Create a new Group with Add new group or modify an existing Group by clicking the Modify icon next to the Group
-
Select User from Available Users and use the >> to add them to the Currently in Group or select the users in the Currently in Group list and use << to remove them from the list.
-
Click Finish to persist and apply the changes
| The order of the Users in the group is relevant and is used as the order for Notifications when this group is used as Target in a Destination Path. |
-
Login as a User with administrative permissions
-
Choose Configure OpenNMS from the user specific main navigation which is named as your login user name
-
Choose Configure Users, Groups and On-Call roles and select Configure Groups
-
Use the trash bin icon next to the Group to delete
-
Confirm delete request with OK
On-Call Roles are an overlay on top of groups, designed to enable OpenNMS Horizon to target the appropriate user or users according to a calendar configuration. A common use case is to have System Engineers in On-Call rotations with a given schedule. The On-Call Roles allow to assign a predefined Duty Schedule to an existing Group with Users. For each On-Call Role a User is assigned as a Supervisor to be responsible for the group of people in this On-Call Role.
-
Login as a User with administrative permissions
-
Choose Configure OpenNMS from the user specific main navigation which is named as your login user name
-
Choose Configure Users, Groups and On-Call roles and select Configure On-Call Roles
-
Use Add New On-Call Role and set a Name for this On-Call Role, assign an existing Group and give a meaningful description
-
Click Save to persist
-
Define a Duty Schedule in the calendar for the given date by click on the Plus (+) icon of the day and provide a notification time for a specific User from the associated Group
-
Click Save to persist the Schedule
-
Click Done to apply the changes
10.3.3. Duty Schedules
Every User and Group may have a Duty Schedule, which specifies that user’s (or group’s) weekly schedule for receiving notifications. If a notification should be delivered to an individual user, but that user is not on duty at the time, the notification will never be delivered to that user. In the case of notifications targeting a user via a group, the logic differs slightly. If the group is on duty at the time the notification is created, then all users who are also on duty will be notified. If the group is on duty, but no member user is currently on duty, then the notification will be queued and sent to the next user who comes on duty. If the group is off duty at the time the notification is created, then the notification will never be sent.
10.3.4. Destination Paths
A Destination Path is a named, reusable set of rules for sending notifications. Every destination path has an initial step and zero or more escalation steps.
Each step in a destination path has an associated delay which defaults to zero seconds. The initial step’s delay is called the initial delay, while an escalation step’s delay is simply called its delay.
Each step has one or more targets. A target may be a user, a group, an on-call role, or a one-off e-mail address.
| While it may be tempting to use one-off e-mail addresses any time an individual user is to be targeted, it’s a good idea to reserve one-off e-mail addresses for special cases. If a user changes her e-mail address, for instance, you’ll need to update in every destination path where it appears. The use of one-off e-mail addresses is meant for situations where a vendor or other external entity is assisting with troubleshooting in the short term. |
When a step targets one or more groups, a delay may also be specified for each group. The default is zero seconds, in which case all group members are notified simultaneously. If a longer delay is set, the group members will be notified in alphabetical order of their usernames.
Avoid using the same name for a group and a user.
The destination path configuration does not distinguish between users and groups at the step level, so the behavior is undefined if you have both a user and a group named admin.
It is for this reason that the default administrators group is called Admin (with a capital A) — case matters.
|
Within a step, each target is associated with one or more notification commands. If multiple commands are selected, they will execute simultaneously.
Each step also has an auto-notify switch, which may be set to off, on, or auto.
This switch specifies the logic used when deciding whether or not to send a notice for an auto-acknowledged notification to a target that was not on duty at the time the notification was first created.
If off, notices will never be sent to such a target; if on, they will always be sent; if auto, the system employs heuristics aimed at "doing the right thing".
10.3.5. Notification Commands
A Notification Command is a named, reusable execution profile for a Java class or external program command used to convey notices to targets. The following notification commands are included in the default configuration:
callHomePhone,callMobilePhone, andcallWorkPhone-
Ring one of the phone numbers configured in the user’s contact information. All three are implemented using the in-process Asterisk notification strategy, and differ only in which contact field is used.
ircCat-
Conveys a notice to an instance of the IRCcat Internet Relay Chat bot. Implemented by the in-process IRCcat notification strategy.
javaEmailandjavaPagerEmail-
By far the most commonly used commands, these deliver a notice to a user’s
emailorpagerEmailcontact field value. By configuring a user’spagerEmailcontact field value to target an email-to-SMS gateway, SMS notifications are trivially easy to configure. Both are implemented using the in-process JavaMail notification strategy. microblogDM,microblogReply, andmicroblogUpdate-
Sends a notice to a user as a direct message, at a user via an at-reply, or to everybody as an update via a microblog service with a Twitter v1-compatible API. Each command is implemented with a separate, in-process notification strategy.
numericPageandtextPage-
Sends a notice to a user’s numeric or alphanumeric pager. Implemented as an external command using the
qpageutility. xmppGroupMessageandxmppMessage-
Sends a message to an XMPP group or user. Implemented with the in-process XMPP notification strategy.
Notification commands are customizable and extensible by editing the notificationCommands.xml file.
Use external binary notification commands sparingly to avoid fork-bombing your OpenNMS Horizon system.
Originally, all notification commands were external.
Today only the numericPage and textPage commands use external programs to do their work.
|
10.4. Bonus Notification Methods
A handful of newer notification methods are included in OpenNMS Horizon but currently require manual steps to activate.
10.4.1. Mattermost
If your organization uses the Mattermost team communications platform, you can configure OpenNMS Horizon to send notices to any Mattermost channel via an incoming webhook. You must configure an incoming webhook in your Mattermost team and do a bit of manual configuration to your OpenNMS Horizon instance.
First, add the following bit of XML to the notificationCommands.xml configuration file (no customization should be needed):
<command binary="false">
  <name>mattermost</name>
  <execute>org.opennms.netmgt.notifd.MattermostNotificationStrategy</execute>
  <comment>class for sending messages to a Mattermost team channel for notifications</comment>
  <argument streamed="false">
    <switch>-subject</switch>
  </argument>
  <argument streamed="false">
    <switch>-tm</switch>
  </argument>
</command>
Then create a new file called mattermost.properties in the opennms.properties.d directory with the following contents (customizing values as appropriate):
org.opennms.netmgt.notifd.mattermost.webhookURL=https://mattermost.example.com/hooks/bf980352b5f7232efe721dbf0626bee1Restart OpenNMS so that the mattermost.properties file will be loaded. Your new mattermost notification command is now available for use in a destination path.
Additional Options
The following table lists optional properties that you may use in mattermost.properties to customize your Mattermost notifications.
To improve the layout, the property names have been shortened to their final component; you must prepend org.opennms.netmgt.notifd.mattermost. when using them.
|
| Parameter | Description | Required | Default value | Example |
|---|---|---|---|---|
|
Specify a channel or private group other than the one targeted by the webhook |
optional |
Webhook default |
|
|
The username to associate with the notification posts |
optional |
None |
|
|
An emoji sequence to use as the icon for the notification posts |
optional |
No icon |
|
|
The URL of an image to use as the icon for the notification posts |
optional |
No icon |
|
|
Should the system wide proxy settings be used? The system proxy settings can be configured via system properties |
optional |
|
|
Some of the optional configuration parameters are incompatible with some versions of Mattermost.
For instance, the channel option is known not to work with Mattermost 3.7.0.
|
For more information on incoming webhooks in Mattermost, see Mattermost Integration Guide.
10.4.2. Slack Notifications
If your organization uses the Slack team communications platform, you can configure OpenNMS Horizon to send notices to any Slack channel via an incoming webhook. You must configure an incoming webhook in your Slack team and do a bit of manual configuration to your OpenNMS Horizon instance.
First, add the following bit of XML to the notificationCommands.xml configuration file (no customization should be needed):
<command binary="false">
  <name>slack</name>
  <execute>org.opennms.netmgt.notifd.SlackNotificationStrategy</execute>
  <comment>class for sending messages to a Slack team channel for notifications</comment>
  <argument streamed="false">
    <switch>-subject</switch>
  </argument>
  <argument streamed="false">
    <switch>-tm</switch>
  </argument>
</command>
Then create a new file called slack.properties in the opennms.properties.d directory with the following contents (customizing values as appropriate):
org.opennms.netmgt.notifd.slack.webhookURL=https://hooks.slack.com/services/AEJ7IIYAI/XOOTH3EOD/c3fc4a662c8e07fe072aeeecRestart OpenNMS so that the slack.properties file will be loaded. Your new slack notification command is now available for use in a destination path.
Additional Options
The following table lists optional properties that you may use in slack.properties to customize your Slack notifications.
To improve the layout, the property names have been shortened to their final component; you must prepend org.opennms.netmgt.notifd.slack. when using them.
|
| Parameter | Description | Required | Default value | Example |
|---|---|---|---|---|
|
Specify a channel or private group other than the one targeted by the webhook |
optional |
Webhook default |
|
|
The username to associate with the notification posts |
optional |
None |
|
|
An emoji sequence to use as the icon for the notification posts |
optional |
No icon |
|
|
The URL of an image to use as the icon for the notification posts |
optional |
No icon |
|
|
Should the system wide proxy settings be used? The system proxy settings can be configured via system properties |
optional |
|
|
For more information on incoming webhooks in Slack, see Slack API.
11. Provisioning
11.1. Introduction
The introduction of OpenNMS version 1.8 empowers enterprises and services providers like never before with a new service daemon for maintaining the managed entity inventory in OpenNMS. This new daemon, Provisiond, unifies all previous entity control mechanisms available in 1.6 (Capsd and the Importer), into a new and improved, massively parallel, policy based provisioning system. System integrators should note, Provisiond comes complete with a RESTFul Web Service API for easy integration with external systems such as CRM or external inventory systems as well as an adapter API for interfacing with other management systems such as configuration management.
OpenNMS 1.0, introduced almost a decade ago now, provided a capabilities scanning daemon, Capsd, as the mechanism for provisioning managed entities. Capsd, deprecated with the release of 1.8.0, provided a rich automatic provisioning mechanism that simply required an IP address to seed its algorithm for creating and maintaining the managed entities (nodes, interfaces, and IP based services). Version 1.2 added and XML-RPC API as a more controlled (directed) strategy for provisioning services that was mainly used by non telco based service providers (i.e. managed hosting companies). Version 1.6 followed this up with yet another and more advanced mechanism called the Importer service daemon. The Importer provided large service providers with the ability to strictly control the OpenNMS entity provisioning with an XML based API for completely defining and controlling the entities where no discovery and service scanning scanning was feasible.
The Importer service improved OpenNMS' scalability for maintaining managed entity databases by an order of magnitude. This daemon, while very simple in concept and yet extremely powerful and flexible provisioning improvement, has blazed the trail for Provisiond. The Importer service has been in production for 3 years in service provider networks maintaining entity counts of more than 50,000 node level entities on a single instances of OpenNMS. It is a rock solid provisioning tool.
Provisiond begins a new era of managed entity provisioning in OpenNMS.
11.2. Concepts
Provisioning is a term that is familiar to service providers (a.k.a. operators, a.k.a. telephone companies) and OSS systems but not so much in the non OSS enterprises.
Provisiond receives "requests" for adding managed entities via 2 basic mechanisms, the OpenNMS Horizon traditional "New Suspect" event, typically via the Discovery daemon, and the import requisition (XML definition of node entities) typically via the Provisioning Groups UI. If you are familiar with all previous releases of OpenNMS, you will recognize the New Suspect Event based Discovery to be what was previously the Capsd component of the auto discovery behavior. You will also recognize the import requisition to be of the Model Importer component of OpenNMS. Provisiond now unifies these two separate components into a massively parallel advanced policy based provisioning service.
11.2.1. Terminology
The following terms are used with respect to the OpenNMS Horizon provisioning system and are essential for understanding the material presented in this guide.
Entity
Entities are managed objects in OpenNMS Horizon such as Nodes, IP interfaces, SNMP Interfaces, and Services.
Foreign Source and Foreign ID
The Importer service from 1.6 introduced the idea of foreign sources and foreign IDs. The Foreign Source uniquely identifies a provisioning source and is still a basic attribute of importing node entities into OpenNMS Horizon. The concept is to provide an external (foreign) system with a way to uniquely identify itself and any node entities that it is requesting (via a requisition) to be provisioned into OpenNMS Horizon.
The Foreign ID is the unique node ID maintained in foreign system and the foreign source uniquely identifies the external system in OpenNMS Horizon.
OpenNMS Horizon uses the combination of the foreign source and foreign ID become the unique foreign key when synchronizing the set of nodes from each source with the nodes in the OpenNMS Horizon DB. This way the foreign system doesn’t have to keep track of the OpenNMS Horizon node IDs that are assigned when a node is first created. This is how Provisiond can decided if a node entity from an import requisition is new, has been changed, or needs to be deleted.
Foreign Source Definition
Additionally, the foreign source has been extended to also contain specifications for how entities should be discovered and managed on the nodes from each foreign source. The name of the foreign source has become pervasive within the provisioning system and is used to simply some of the complexities by weaving this name into:
-
the name of the provisioning group in the Web-UI
-
the name of the file containing the persisted requisition (as well as the pending requisition if it is in this state)
-
the foreign-source attribute value inside the requisition (obviously, but, this is pointed out to indicate that the file name doesn’t necessarily have to equal the value of this attribute but is highly recommended as an OpenNMS Horizon best practice)
-
the building attribute of the node defined in the requisition (this value is called “site” in the Web-UI and is assigned to the building column of the node’s asset record by Provisiond and is the default value used in the Site Status View feature)
Import Requisition
Import requisition is the terminology OpenNMS Horizon uses to represent the set of nodes, specified in XML, to be provisioned from a foreign source into OpenNMS Horizon. The requisition schema (XSD) can be found at the following location. http://xmlns.opennms.org/xsd/config/model-import
Auto Discovery
Auto discovery is the term used by OpenNMS Horizon to characterize the automatic provisioning of nodes entities. Currently, OpenNMS Horizon uses an ICMP ping sweep to find IP address on the network. Auto-discovery-with-detectors will allow defining specific detectors for auto discovery to succeed. For the IPs that succeed and that are not currently in the DB, OpenNMS Horizon generates a new suspect event. When this event is received by Provisiond, it creates a node and it begins a node scan based on the default foreign source definition.
Directed Discovery
Provisiond takes over for the Model Importer found in version 1.6 which implemented a unique, first of its kind, controlled mechanism for specifying managed entities directly into OpenNMS Horizon from one or more data sources. These data sources often were in the form of an in-house developed inventory or stand-alone provisioning system or even a set of element management systems. Using this mechanism, OpenNMS Horizon is directed to add, update, or delete a node entity exactly as defined by the external source. No discovery process is used for finding more interfaces or services.
Enhanced Directed Discovery
Directed discovery is enhanced with the capability to scan nodes that have been directed nodes for entities (interfaces.
Policy-Based Discovery
The phrase policy-based directed discovery, is a term that represents the latest step in OpenNMS Horizon provisioning evolution and best describes the new provisioning architecture now in OpenNMS Horizon for maintaining its inventory of managed entities. This term describes the control that is given over the Provisioning system to OpenNMS Horizon users for managing the behavior of the NMS with respect to the new entities that are being discovered. Current behaviors include persistence, data collection, service monitoring, and categorization policies.
11.2.2. Addressing Scalability
The explosive growth and density of the IT systems being deployed today to support not traditional IP services is impacting management systems like never before and is demanding from them tremendous amounts of scalability. The scalability of a management system is defined by its capacity for maintaining large numbers of managing entities coupled with its efficiency of managing the entities.
Today, It is not uncommon for OpenNMS Horizon deployments to find node entities with tens of thousands of physical interfaces being reported by SNMP agents due to virtualization (virtual hosts, interfaces, as well as networks). An NMS must be capable of using the full capacity every resource of its computing platform (hardware and OS) as effectively as possible in order to manage these environments. The days of writing scripts or single threaded applications will just no longer be able to do the work required an NMS when dealing with the scalability challenges facing systems and systems administrators working in this domain.
Parallelization and Non-Blocking I/O
Squeezing out every ounce of power from a management system’s platform (hardware and OS) is absolutely required to complete all the work of a fully functional NMS such as OpenNMS Horizon. Fortunately, the hardware and CPU architecture of a modern computing platform provides multiple CPUs with multiple cores having instruction sets that include support for atomic operations. While these very powerful resources are being provided by commodity systems, it makes the complexity of developing applications to use them vs. not using them, orders of magnitude more complex. However, because of scalability demands of our complex IT environments, multi-threaded NMS applications are now essential and this has fully exposed the complex issues of concurrency in software development.
OpenNMS Horizon has stepped up to this challenge with its new concurrency strategy. This strategy is based on a technique that combines the efficiency of parallel (asynchronous) operations (traditionally used by most effectively by single threaded applications) with the power of a fully current, non-blocking, multi-threaded design. The non-blocking component of this new concurrency strategy added greater complexity but OpenNMS Horizon gained orders of magnitude in increased scalability.
| Java Runtimes, based on the Sun JVM, have provided implementations for processor based atomic operations and is the basis for OpenNMS Horizon’ non-blocking concurrency algorithms. |
Provisioning Policies
Just because you can, doesn’t mean you should! Because the massively parallel operations being created for Provisiond allows tremendous numbers of nodes, interfaces, and services to be very rapidly discovered and persisted, doesn’t mean it should. A policy API was created for Provisiond that allows implementations to be developed that can be applied to control the behavior of Provisiond. The 1.8 release includes a set of flexible provisioning policies that control the persistence of entities and their attributes constrain monitoring behavior.
When nodes are imported or re-scanned, there is, potentially, a set of zero or more provisioning policies that are applied. The policies are defined in the foreign source’s definition. The policies for an auto-discovered node or nodes from provisioning groups that don’t have a foreign source definition, are the policies defined in the default foreign source definition.
The Default Foreign Source Definition
Contained in the libraries of the Provisioning service is the "template" or default foreign source.
The template stored in the library is used until the OpenNMS Horizon admin user alters the default from the Provisioning Groups WebUI.
Upon edit, this template is exported to the OpenNMS Horizon etc/ directory with the file name: default-foreign-source.xml.
<?xml version="1.0" encoding="UTF-8" standalone="yes"?>
<foreign-source date-stamp="2009-10-16T18:04:12.844-05:00"
                name="default"
                xmlns="http://xmlns.opennms.org/[http://xmlns.opennms.org/xsd/config/foreign-source">
    <scan-interval>1d</scan-interval>
    <detectors>
      <detector class="org.opennms.netmgt.provision.detector.datagram.DnsDetector" name="DNS"/>
      <detector class="org.opennms.netmgt.provision.detector.simple.FtpDetector" name="FTP"/>
      <detector class="org.opennms.netmgt.provision.detector.simple.HttpDetector" name="HTTP"/>
      <detector class="org.opennms.netmgt.provision.detector.simple.HttpsDetector" name="HTTPS"/>
      <detector class="org.opennms.netmgt.provision.detector.icmp.IcmpDetector" name="ICMP"/>
      <detector class="org.opennms.netmgt.provision.detector.simple.ImapDetector" name="IMAP"/>
      <detector class="org.opennms.netmgt.provision.detector.simple.LdapDetector" name="LDAP"/>
      <detector class="org.opennms.netmgt.provision.detector.simple.NrpeDetector" name="NRPE"/>
      <detector class="org.opennms.netmgt.provision.detector.simple.Pop3Detector" name="POP3"/>
      <detector class="org.opennms.netmgt.provision.detector.radius.RadiusAuthDetector" name="Radius"/>
      <detector class="org.opennms.netmgt.provision.detector.simple.SmtpDetector" name="SMTP"/>
      <detector class="org.opennms.netmgt.provision.detector.snmp.SnmpDetector" name="SNMP"/>
      <detector class="org.opennms.netmgt.provision.detector.ssh.SshDetector" name="SSH"/>
  </detectors>
  <policies/>
</foreign-source>
Automatic Rescanning
The default foreign source defines a scan-interval of 1d, which will cause all nodes in the requisition to be scanned daily. You may set the scan interval using any combination of the following signifiers:
-
w: Weeks
-
d: Days
-
h: Hours
-
m: Minutes
-
s: Seconds
-
ms: Milliseconds
For example, to rescan every 6 days and 53 minutes, you would set the scan-interval to 6d 53m.
Don’t forget, for the new scan interval to take effect, you will need to import the requisition one more time so that the foreign source becomes active.
Disabling Rescan
For a large number of devices, you may want to set the scan-interval to 0 to disable automatic rescan altogether. OpenNMS Horizon will not attempt to rescan the nodes in the requisition unless you trigger a manual (forced) rescan through the web UI or Provisioning ReST API.
11.3. Getting Started
An NMS is of no use until it is setup for monitoring and entities are added to the system. OpenNMS Horizon installs with a base configuration with a configuration that is sufficient get service level monitoring and performance management quickly up and running. As soon as managed entities are provisioned, the base configuration will automatically begin monitoring and reporting.
Generally speaking, there are two methods of provisioning in OpenNMS Horizon: Auto Discovery and Directed Discovery. We’ll start with Auto Discovery, but first, we should quickly review the configuration of SNMP so that newly discovered devices can be immediately scanned for entities as well as have reporting and thresholding available.
11.3.1. Provisioning the SNMP Configuration
OpenNMS Horizon requires SNMP configuration to be properly setup for your network in order to properly understand Network and Node topology as well as to automatically enable performance data collection. Network topology is updated as nodes (a.k.a. devices or hosts) are provisioned. Navigate to the Admin/Configure SNMP Community Names by IP address as shown below.
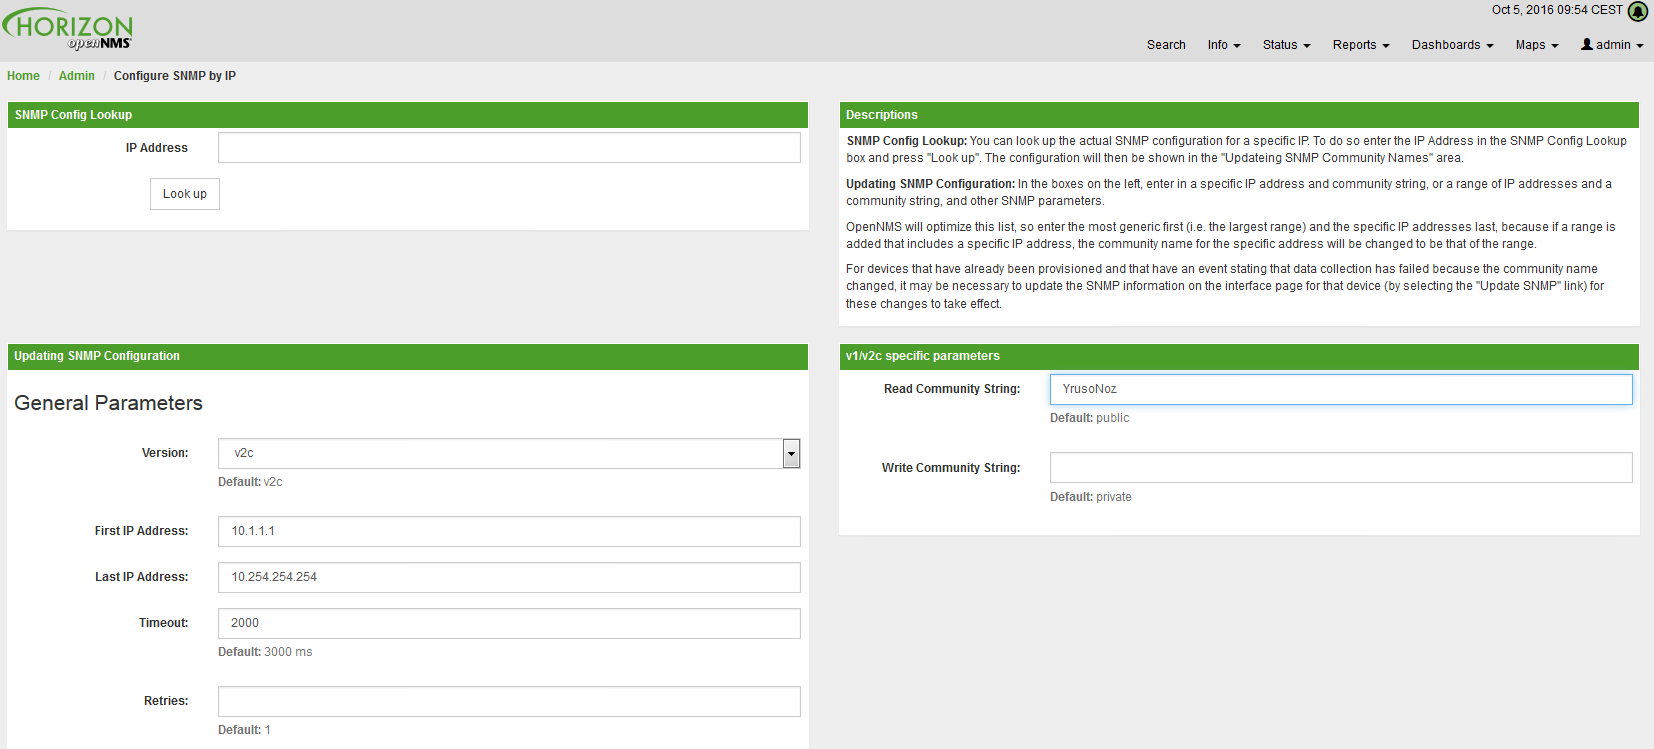
| Provisiond includes an option to add community information in the Single Node provisioning interface. This, is equivalent of entering a single IP address in the screen with the convenience of setting the community string at the same time a node is provisioned. See the Quick Node Add feature below for more details about this capability. |
This screen sets up SNMP within OpenNMS Horizon for agents listening on IP addresses 10.1.1.1 through 10.254.254.254.
These settings are optimized into the snmp-configuration.xml file.
Optimization means that the minimal configuration possible will be written.
Any IP addresses already configured that are eclipsed by this range will be removed.
Here is the resulting configuration.
<?xml version="1.0" encoding="UTF-8"?>

<snmp-config
xmlns="http://xmlns.opennms.org/xsd/config/snmp[http://xmlns.opennms.org/xsd/config/snmp]"
port="161" retry="3" timeout="800" read-community="public"

version="v1" max-vars-per-pdu="10">

<definition retry="1" timeout="2000"

read-community="public" version="v2c">

<specific>10.12.23.32</specific>

</definition>

</snmp-config>
However, If an IP address is then configured that is within the range,
the range will be split into two separate ranges and a specific entry will
be added. For example, if a configuration was added through the same UI for
the IP: 10.12.23.32 having the community name public, then the
resulting configuration will be:
<?xml version="1.0" encoding="UTF-8"?>
<snmp-config xmlns="http://xmlns.opennms.org/xsd/config/snmp"
             port="161"
             retry="3"
             timeout="800"
             read-community="public"
             version="v1"
             max-vars-per-pdu="10">

    <definition retry="1" timeout="2000" read-community="YrusoNoz" version="v2c">
        <range begin="10.1.1.1" end="10.12.23.31"/>
        <range begin="10.12.23.33" end="10.254.254.254"/>
    </definition>

    <definition retry="1" timeout="2000" read-community="public" version="v2c">
        <specific>10.12.23.32</specific>
    </definition>
</snmp-config>| the bold IP addresses show where the range was split and the specific with community name "public" was added. |
Now, with SNMP configuration provisioned for our 10 networks, we are ready to begin adding nodes. Our first example will be to automatically discover and add all managed entities (nodes, IP interfaces, SNMP Interfaces, and Monitored IP based Services). We will then give an example of how to be more directed and deliberate about your discovery by using Provisioning Groups.
Automatically discovered entities are analyzed, persisted to the relational data store, and then managed based on the policies defined in the default foreign source definition. This is very similar to the way that entities were previously handled by the (now obsolete) Capsd daemon but with finer grained sense of control.
11.3.2. Automatic Discovery
Currently in OpenNMS Horizon, the ICMP is used to automatically provision node entities into OpenNMS Horizon. This functionality has been in OpenNMS since its 1.0 release, however, in 1.8, a few of the use cases have been updated with Provisiond’s replacement of Capsd.
Separation of Concerns
Version 1.8 Provisiond separates what was called Capsd scanning in to 3 distinct phases: entity scanning, service detection, and node merging. These phases are now managed separately by Provisiond. Immediately following the import of a node entity, tasks are created for scanning a node to discover the node entity’s interfaces (SNMP and IP). As interfaces are found, they are persisted and tasks are scheduled for service detection of each IP interface.
For auto discovered nodes, a node merging phase is scheduled; Nodes that have been directly provisioned will not be included in the node merging process. Merging will only occur when 2 automatically discovered nodes appear to be the same node.
| the use case and redesign of node merging is still an outstanding issue with the 1.8.0 release |
11.3.3. Enhanced Directed Discovery
This new form of provisioning first appears in OpenNMS with version 1.8 and the new Provisiond service. It combines the benefits of the Importer’s strictly controlled methodology of directed provisioning (from version 1.6) with OpenNMS’ robustly flexible auto discovery. Enhanced Directed discovery begins with an enhanced version of the same import requisition used in directed provisioning and completes with a policy influenced persistence phase that sorts though the details of all the entities and services found during the entity and service scanning phase.
If you are planning to use this form of provisioning, it important to understand the conceptual details of how Provisiond manages entities it is directed to provision. This knowledge will enable administrators and systems integrators to better plan, implement, and resolve any issues involved with this provisioning strategy.
Understanding the Process
There are 3 phases involved with directing entities to be discovered: import, node scan, and service scan. The import phase also has sub phases: marshal, audit, limited SNMP scan, and re-parent.
Marshal and Audit Phases
It is important to understand that the nodes requisitioned from each foreign source are managed as a complete set. Nodes defined in a requisition from the foreign source CRM and CMDB, for example, will be managed separately from each other even if they should contain exactly the same node definitions. To OpenNMS Horizon, these are individual entities and they are managed as a set.
Requisitions are referenced via a URL.
Currently, the URL can be specified as one of the following protocols: FILE, HTTP, HTTPS, and DNS.
Each protocol has a protocol handler that is used to stream the XML from a foreign source, i.e. http://inv.corp.org/import.cgi?customer=acme or file:/opt/opennms/etc/imports/acme.xml.
The DNS protocol is a special handler developed for Provisioning sets of nodes as a foreign-source from a corporate DNS server.
See DNS Protocol Handler for details.
Upon the import request (either on schedule or on demand via an Event) the requisition is marshaled into Java objects for processing. The nodes defined in the requisition represent what OpenNMS Horizon should have as the current set of managed entities from that foreign source. The audit phase determines for each node defined (or not defined) in the requisition which are to be processed as an Add, Update, or Delete operation during the Import Phase. This determination is made by comparing the set foreign IDs of each node in the requisition set with the set of foreign IDs of currently managed entities in OpenNMS Horizon.
The intersection of the IDs from each set will become the Update operations, the extra set of foreign IDs that are in the requisition become the Add operations, and the extra set of foreign IDs from the managed entities become the Delete operations. This implies that the foreign IDs from each foreign source must be unique.
Naturally, the first time an import request is processed from a foreign source there will be zero (0) node entities from the set of nodes currently being managed and each node defined in the requisition will become an Add Operation. If a requisition is processed with zero (0) node definitions, all the currently managed nodes from that foreign source will become Delete operations (all the nodes, interfaces, outages, alarms, etc. will be removed from OpenNMS Horizon).
When nodes are provisioned using the Provisioning Groups Web-UI, the requisitions are stored on the local file system and the file protocol handler is used to reference the requisition. Each Provisioning Group is a separate foreign source and unique foreign IDs are generated by the Web-UI. An MSP might use Provisioning Groups to define the set of nodes to be managed by customer name where each customer’s set of nodes are maintained in a separate Provisioning Group.
Import Phase
The import phase begins when Provisiond receives a request to import a requisition from a URL. The first step in this phase is to load the requisition and marshal all the node entities defined in the requisition into Java objects.
If any syntactical or XML structural problems occur in the requisition, the entire import is abandoned and no import operations are completed.
Once the requisition is marshaled, the requisition nodes are audited against the persisted node entities. The set of requisitioned nodes are compared with a subset of persisted nodes and this subset is generated from a database query using the foreign source defined in the requisition. The audit generates one of three operations for each requisition node: insert, update, delete based on each requisitioned node’s foreign ID. Delete operations are created for any nodes that are not in the requisition but are in the DB subset, update operations are created for requisition nodes that match a persisted node from the subset (the intersection), and insert operations are created from the remaining requisition nodes (nodes in the requisition that are not in the DB subset).
If a requisition node has an interface defined as the Primary SNMP interface, then during the update and insert operations the node will be scanned for minimal SNMP attribute information. This scan find the required node and SNMP interface details required for complete SNMP support of the node and only the IP interfaces defined in the requisition.
| this not the same as Provisiond SNMP discovery scan phases: node scan and interface scan. |
Node Scan Phase
Where directed discovery leaves off and enhanced directed discovery begins is that after all the operations have completed, directed discovery is finished and enhanced directed discovery takes off. The requisitioned nodes are scheduled for node scans where details about the node are discovered and interfaces that were not directly provisioned are also discovered. All physical (SNMP) and logical (IP) interfaces are discovered and persisted based on any Provisioning Policies that may have been defined for the foreign source associated with the import requisition.
Service Scan (detection) Phase
Additionally, the new Provisiond enhanced directed discovery mechanism follows interface discovery with service detection on each IP interface entity. This is very similar to the Capsd plugin scanning found in all former releases of OpenNMS except that the foreign source definition is used to define what services should be detected on these interfaces found for nodes in the import requisition.
11.4. Import Handlers
The new Provisioning service in OpenNMS Horizon is continuously improving and adapting to the needs of the community.
One of the most recent enhancements to the system is built upon the very flexible and extensible API of referencing an import requisition’s location via a URL.
Most commonly, these URLs are files on the file system (i.e. file:/opt/opennms/etc/imports/<my-provisioning-group.xml>) as requisitions created by the Provisioning Groups UI.
However, these same requisitions for adding, updating, and deleting nodes (based on the original model importer) can also come from URLs.
For example a requisition can be retrieving the using HTTP protocol: http://myinventory.server.org/nodes.cgi
In addition to the standard protocols supported by Java, we provide a series of custom URL handlers to help retrieve requisitions from external sources.
11.4.1. Generic Handler
The generic handler is made available using URLs of the form: requisition://type?param=1;param=2
Using these URLs various type handlers can be invoked, both locally and via a Minion.
In addition to the type specific parameters, the following parameters are supported:
| Parameter | Description | Required | Default value |
|---|---|---|---|
|
The name of location at which the handler should be run |
optional |
Default |
|
The maximum number of miliseconds to wait for the handler when ran remotely |
optional |
20000 |
See the relevant sections bellow for additional details on the support types.
The opennms:show-import command available via the Karaf Shell can be used to show the results of an import (without persisting or triggering the import):
opennms:show-import -l MINION http url=http://127.0.0.1:8000/req.xml11.4.2. File Handler
Examples:
file:///path/to/my/requisition.xml
requisition://file?path=/path/to/my/requisition.xml;location=MINION
11.4.3. HTTP Handler
Examples:
http://myinventory.server.org/nodes.cgi
requisition://http?url=http%3A%2F%2Fmyinventory.server.org%2Fnodes.cgi
| When using the generic handler, the URL should be "URL encoded". |
11.4.4. DNS Handler
The DNS handler requests a Zone Transfer (AXFR) request from a DNS server. The A records are recorded and used to build an import requisition. This is handy for organizations that use DNS (possibly coupled with an IP management tool) as the data base of record for nodes in the network. So, rather than ping sweeping the network or entering the nodes manually into OpenNMS Horizon Provisioning UI, nodes can be managed via 1 or more DNS servers.
The format of the URL for this new protocol handler is: dns://<host>[:port]/<zone>[/<foreign-source>/][?expression=<regex>]
DNS Import Examples:
dns://my-dns-server/myzone.com
This URL will import all A records from the host my-dns-server on port 53 (default port) from zone "myzone.com" and since the foreign source (a.k.a. the provisioning group) is not specified it will default to the specified zone.
dns://my-dns-server/myzone.com/portland/?expression=^por-.*
This URL will import all nodes from the same server and zone but will only manage the nodes in the zone matching the regular expression ^port-.* and will and they will be assigned a unique foreign source (provisioning group) for managing these nodes as a subset of nodes from within the specified zone.
If your expression requires URL encoding (for example you need to use a ? in the expression) it must be properly encoded.
dns://my-dns-server/myzone.com/portland/?expression=^por[0-9]%3F
You can use the location parameter to assign a single location to all nodes in this requisition:
dns://my-dns-server/myzone.com/portland/?location=Raleigh
By preceding a ~ you can specify a properly encoded regular expression to determine the location based on the host entries.
In the following, for example, we want to derive the location based on the subdomain.
We use the regular expression ^(?:.\.|)(.?)\.hs-fulda\.de\.$ with exactly one capturing group:
dns://my-dns-server/hs-fulda.de/?location=~%5E%28%3F%3A.%2A%5C.%7C%29%28.%2A%3F%29%5C.hs-fulda%5C.de%5C.%24
This will associate nodes for the host entries foo.e46.hs-fulda.de. and bar.e46.hs-fulda.de. to the location e46 while hosts like aaa.g51.hs-fulda.de and bbb.g51.hs-fulda.de will be assigned location g51.
You can use online tools like https://www.urlencoder.org to en- and decode your parameters.
|
Currently, the DNS server requires to be setup to allow a zone transfer from the OpenNMS Horizon server. It is recommended that a secondary DNS server is running on OpenNMS Horizon and that the OpenNMS Horizon server be allowed to request a zone transfer. A quick way to test if zone transfers are working is:
dig -t AXFR @<dnsServer> <zone>
The configuration of the Provisoning system has moved from a properties file (model-importer.properties) to an XML based configuration container.
The configuration is now extensible to allow the definition of 0 or more import requisitions each with their own cron based schedule for automatic importing from various sources (intended for integration with external URL such as http and this new dns protocol handler.
A default configuration is provided in the OpenNMS Horizon etc/ directory and is called: provisiond-configuration.xml.
This default configuration has an example for scheduling an import from a DNS server running on the localhost requesting nodes from the zone, localhost and will be imported once per day at the stroke of midnight.
Not very practical but is a good example.
<?xml version="1.0" encoding="UTF-8"?>
    <provisiond-configuration xmlns:xsi="http://www.w3.org/2001/XMLSchema-instance" xsi:schemaLocation="http://xmlns.opennms.org/xsd/config/provisiond-configuration"
                              foreign-source-dir="/opt/opennms/etc/foreign-sources"
                              requistion-dir="/opt/opennms/etc/imports"
                              importThreads="8"
                              scanThreads="10"
                              rescanThreads="10"
                              writeThreads="8" >

    <!--http://www.quartz-scheduler.org/documentation/quartz-1.x/tutorials/crontrigger
        Field Name Allowed Values Allowed Special Characters
        Seconds 0-59 , - * / Minutes 0-59 , - * / Hours 0-23 , - * /
        Day-of-month1-31, - * ? / L W C Month1-12 or JAN-DEC, - * /
        Day-of-Week1-7 or SUN-SAT, - * ? / L C # Year (Opt)empty, 1970-2099, - * /
    -->

    <requisition-def import-name="localhost"
                     import-url-resource="dns://localhost/localhost">

        <cron-schedule>0 0 0 * * ? *</cron-schedule> <!-- daily, at midnight -->
    </requisition-def>
</provisiond-configuration>Like many of the daemon configuration in the 1.7 branch, the configurations are reloadable without having to restart OpenNMS Horizon, using the reloadDaemonConfig uei:
/opt/opennms/bin/send-event.pl
uei.opennms.org/internal/reloadDaemonConfig --parm 'daemonName Provisiond'
This means that you don’t have to restart OpenNMS Horizon every time you update the configuration.
11.5. Provisioning Examples
Here are a few practical examples of enhanced directed discovery to help with your understanding of this feature.
11.5.1. Basic Provisioning
This example adds three nodes and requires no OpenNMS Horizon configuration other than specifying the node entities to be provisioned and managed in OpenNMS Horizon.
Defining the Nodes via the Web-UI
Using the Provisioning Groups Web-UI, three nodes are created given a single IP address. Navigate to the Admin Menu and click Provisioning Groups Menu from the list of Admin options and create the group Bronze.
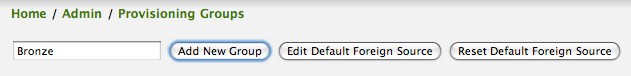
Clicking the Add New Group button will create the group and will redisplay the page including this new group among the list of any group(s) that have already been created.
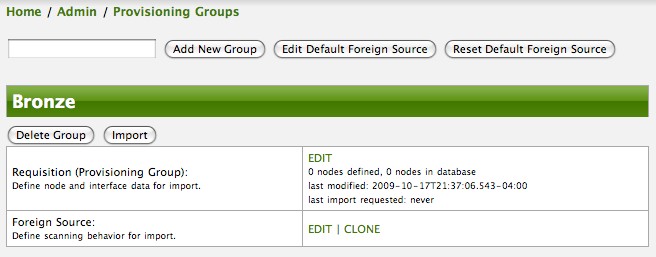
| At this point, the XML structure for holding the new provisioning group (a.k.a. an import requisition) has been persisted to the '$OPENNMS_ETC/imports/pending' directory. |
Clicking the Edit link will bring you to the screen where you can begin the process of defining node entities that will be imported into OpenNMS Horizon. Click the Add Node button will begin the node entity creation process fill in the node label and click the Save button.
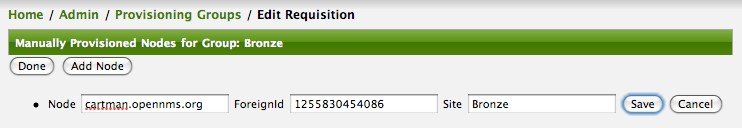
At this point, the provisioning group contains the basic structure of a node entity but it is not complete until the interface(s) and interface service(s) have been defined. After having clicked the Save button, as we did above presents, in the Web-UI, the options Add Interface, Add Node Category, and Add Node Asset. Click the Add Interface link to add an interface entity to the node.
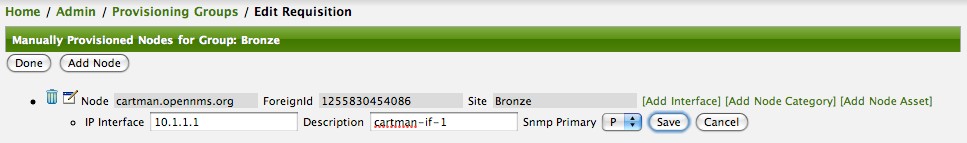
Enter the IP address for this interface entity, a description, and specify the Primary attribute as P (Primary), S (Secondary), N (Not collected), or C (Collected) and click the save button.
Now the node entity has an interface for which services can be defined for which the Web-UI now presents the Add Service link.
Add two services (ICMP, SNMP) via this link.
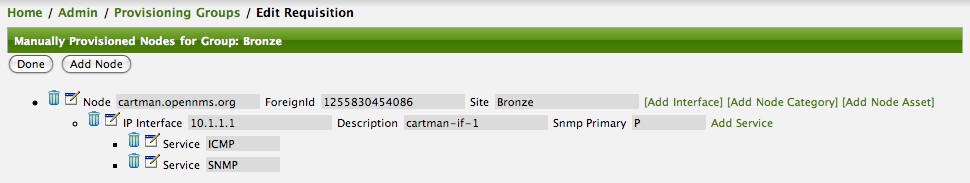
Now the node entity definition contains all the required elements necessary for importing this requisition into OpenNMS Horizon. At this point, all the interfaces that are required for the node should be added. For example, NAT interfaces should be specified there are services that they provide because they will not be discovered during the Scan Phase.
Two more node definitions will be added for the benefit of this example.
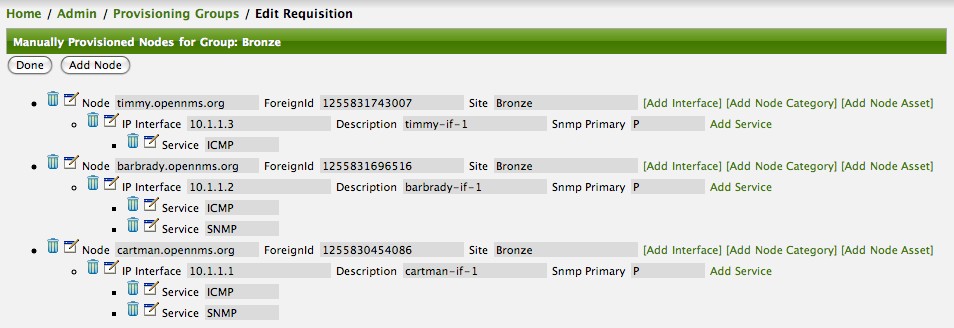
This set of nodes represents an import requisition for the Bronze provisioning group.
As this requisition is being edited via the WebUI, changes are being persisted into the OpenNMS Horizon configuration directory '$OPENNMS_etc/imports/' pending as an XML file having the name bronze.xml.
| The name of the XML file containing the import requisition is the same as the provisioning group name. Therefore naming your provisioning group without the use of spaces makes them easier to manage on the file system. |
Click the Done button to return to the Provisioning Groups list screen. The details of the “Bronze” group now indicates that there are 3 nodes in the requisition and that there are no nodes in the DB from this group (a.k.a. foreign source). Additionally, you can see that time the requisition was last modified and the time it last imported are given (the time stamps are stored as attributes inside the requisition and are not the file system time stamps). These details are indicative of how well the DB represents what is in the requisition.
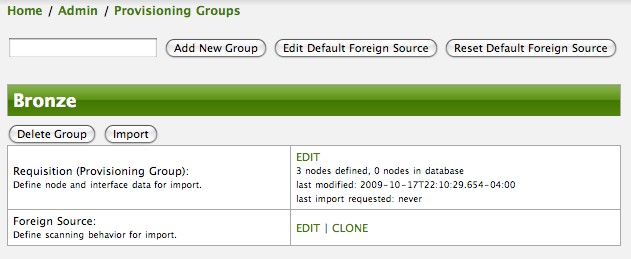
| You can tell that this is a pending requisition for 2 reasons: 1) there are 3 nodes defined and 0 nodes in the DB, 2) the requisition has been modified since the last import (in this case never). |
Import the Nodes
In this example, you see that there are 3 nodes in the pending requisition and 0 in the DB. Click the Import button to submit the requisition to the provisioning system (what actually happens is that the Web-UI sends an event to the Provisioner telling it to begin the Import Phase for this group).
| Do not refresh this page to check the values of these details. To refresh the details to verify the import, click the Provisioning Groups bread crumb item. |
You should be able to immediately verify the importation of this provisioning group because the import happens very quickly. Provisiond has several threads ready for processing the import operations of the nodes defined in this requisition.
A few SNMP packets are sent and received to get the SNMP details of the node and the interfaces defined in the requisition. Upon receipt of these packets (or not) each node is inserted as a DB transaction.
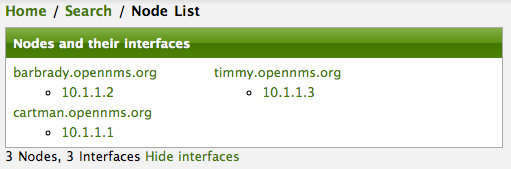
Following the import of a node with thousands of interfaces, you will be able to refresh the Interface table browser on the Node page and see that interfaces and services are being discovered and added in the background. This is the discovery component of directed discovery.
To direct that another node be added from a foreign source (in this example the Bronze Provisioning Group) simply add a new node definition and re-import. It is important to remember that all the node definitions will be re-imported and the existing managed nodes will be updated, if necessary.
Changing a Node
To direct changes to an existing node, simply add, change, or delete elements or attributes of the node definition and re- import. This is a great feature of having directed specific elements of a node in the requisition because that attributes will simply be changed. For example, to change the IP address of the Primary SNMP interface for the node, barbrady.opennms.org, just change the requisition and re-import.
Each element in the Web-UI has an associated Edit icon Click this icon to change the IP address for barbrady.opennms.org, click save, and then Click the Done button.

The Web-UI will return you to the Provisioning Groups screen where you will see that there are the time stamp showing that the requisition’s last modification is more recent that the last import time.
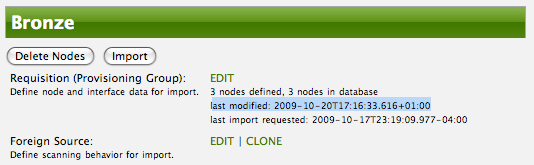
This provides an indication that the group must be re-imported for the changes made to the requisition to take effect. The IP Interface will be simply updated and all the required events (messages) will be sent to communicate this change within OpenNMS Horizon.
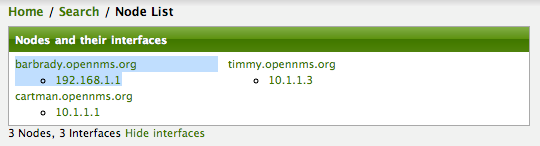
Deleting a Node
Barbrady has not been behaving, as one might expect, so it is time to remove him from the system. Edit the provisioning group, click the delete button next to the node barbrady.opennms.org, click the Done button.
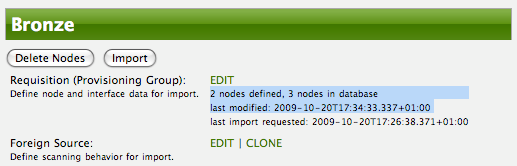
Click the Import button for the Bronze group and the Barbrady node and its interfaces, services, and any other related data will be immediately deleted from the OpenNMS Horizon system. All the required Events (messages) will be sent by Provisiond to provide indication to the OpenNMS Horizon system that the node Barbrady has been deleted.
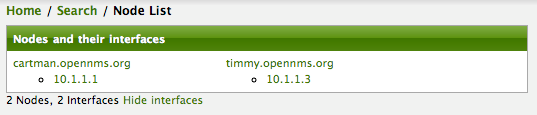
Deleting all the Nodes
There is a convenient way to delete all the nodes that have been provided from a specific foreign source.
From the main Admin/Provisioning Groups screen in the Web-UI, click the Delete Nodes button.
This button deletes all the nodes defined in the Bronze requisition.
It is very important to note that once this is done, it cannot be undone!
Well it can’t be undone from the Web-UI and can only be undone if you’ve been good about keeping a backup copy of your '$OPENMS_ETC/' directory tree.
If you’ve made a mistake, before you re-import the requisition, restore the Bronze.xml requisition from your backup copy to the '$OPENNMS_ETC/imports' directory.

Clicking the Import button will cause the Audit Phase of Provisiond to determine that all the nodes from the Bronze group (foreign source) should be deleted from the DB and will create Delete operations. At this point, if you are satisfied that the nodes have been deleted and that you will no longer require nodes to be defined in this Group, you will see that the Delete Nodes button has now changed to the Delete Group button. The Delete Group button is displayed when there are no nodes entities from that group (foreign source) in OpenNMS Horizon.
When no node entities from the group exist in OpenNMS Horizon, then the Delete Group button is displayed.
11.5.2. Advanced Provisioning Example
In the previous example, we provisioned 3 nodes and let Provisiond complete all of its import phases using a default foreign source definition. Each Provisioning Group can have a separate foreign source definition that controls:
-
The rescan interval
-
The services to be detected
-
The policies to be applied
This example will demonstrate how to create a foreign source definition and how it is used to control the behavior of Provisiond when importing a Provisioning Group/foreign source requisition.
First let’s simply provision the node and let the default foreign source definition apply.
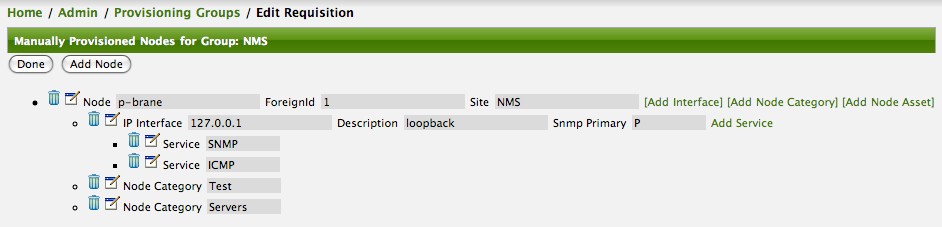
Following the import, All the IP and SNMP interfaces, in addition to the interface specified in the requisition, have been discovered and added to the node entity. The default foreign source definition has no polices for controlling which interfaces that are discovered either get persisted or managed by OpenNMS Horizon.
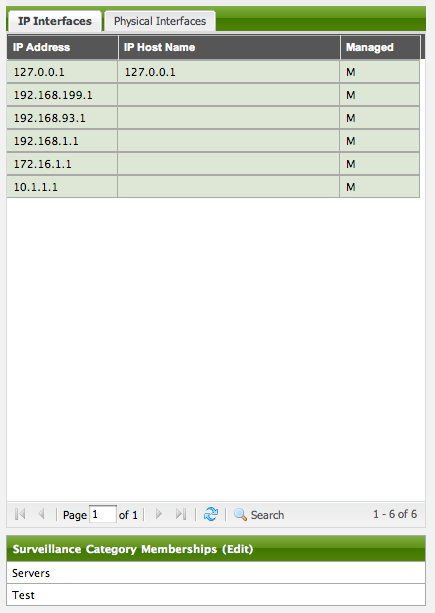
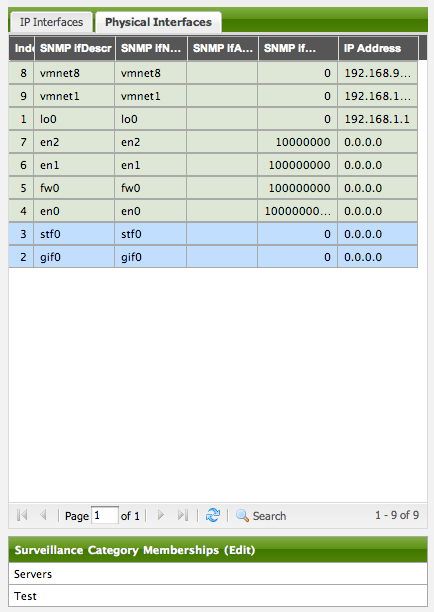
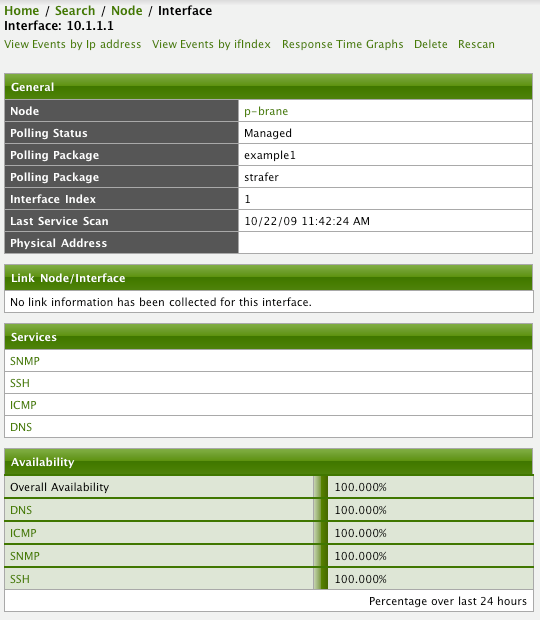
Service Detection
As IP interfaces are found during the node scan process, service detection tasks are scheduled for each IP interface. The service detections defined in the foreign source determines which services are to be detected and how (i.e. the values of the parameters that parameters control how the service is detected, port, timeout, etc.).
Applying a New Foreign Source Definition
This example node has been provisioned using the Default foreign source definition. By navigating to the Provisioning Groups screen in the OpenNMS Horizon Web-UI and clicking the Edit Foreign Source link of a group, you can create a new foreign source definition that defines service detection and policies. The policies determine entity persistence and/or set attributes on the discovered entities that control OpenNMS Horizon management behaviors.
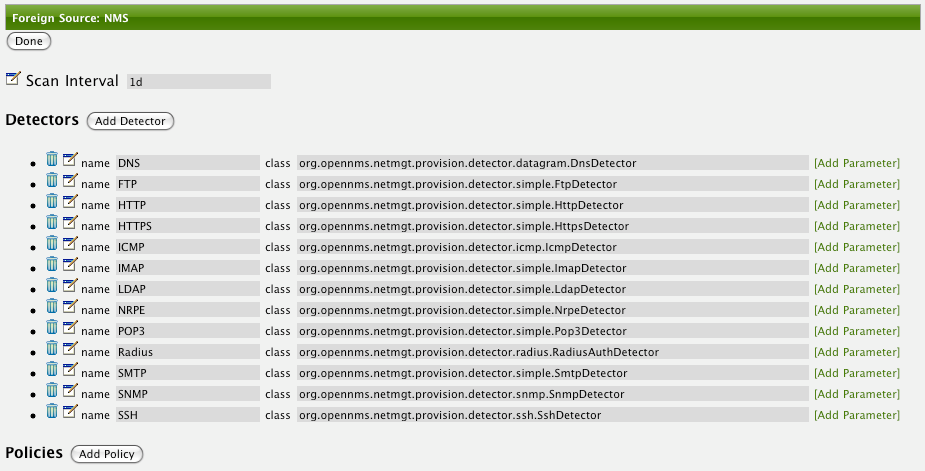
In this UI, new Detectors can be added, changed, and removed. For this example, we will remove detection of all services accept ICMP and DNS, change the timeout of ICMP detection, and a new Service detection for OpenNMS Horizon Web-UI.
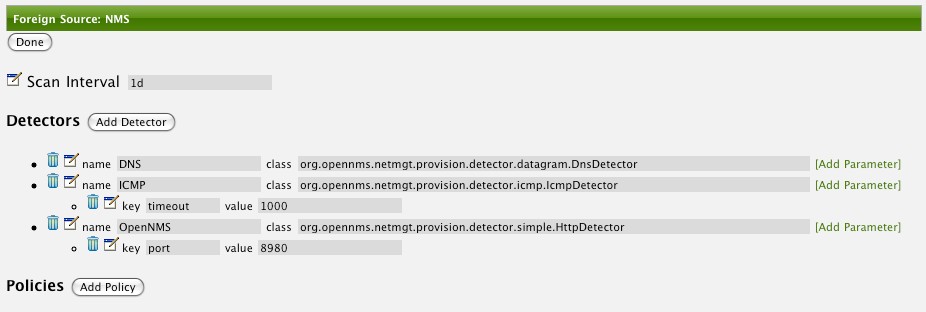
Click the Done button and re-import the NMS Provisioning Group. During this and any subsequent re-imports or re- scans, the OpenNMS Horizon detector will be active, and the detectors that have been removed will no longer test for the related services for the interfaces on nodes managed in the provisioning group (requisition), however, the currently detected services will not be removed. There are 2 ways to delete the previously detected services:
-
Delete the node in the provisioning group, re-import, define it again, and finally re-import again
-
Use the ReST API to delete unwanted services. Use this command to remove each unwanted service from each interface, iteratively:
curl -X DELETE -H "Content-Type: application/xml" -u admin:admin http://localhost:8980/opennms/rest/nodes/6/ipinterfaces/172.16.1.1/services/DNS
| There is a sneaky way to do #1. Edit the provisioning group and just change the foreign ID. That will make Provisiond think that a node was deleted and a new node was added in the same requisition! Use this hint with caution and an full understanding of the impact of deleting an existing node. |
Provisioning with Policies
The Policy API in Provisiond allow you to control the persistence of discovered IP and SNMP Interface entities and Node Categories during the Scan phase.
The Matching IP Interface policy controls whether discovered interfaces are to be persisted and if they are to be persisted, whether or not they will be forced to be Managed or Unmanaged.
Continuing with this example Provisioning Group, we are going to define a few policies that:
-
Prevent discovered 10 network addresses from being persisted
-
Force 192.168 network addresses to be unmanaged
From the foreign source definition screen, click the Add Policy button and the definition of a new policy will begin with a field for naming the policy and a drop down list of the currently installed policies. Name the policy no10s, make sure that the Match IP Interface policy is specified in the class list and click the Save button. This action will automatically add all the parameters required for the policy.
The two required parameters for this policy are action and matchBehavior.
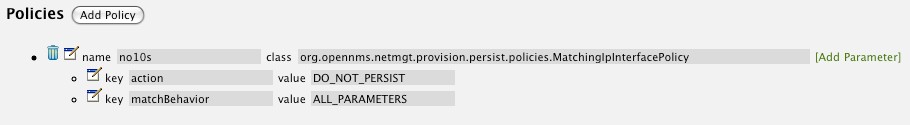
The DO_NOT_PERSIST action does just what it indicates, it prevents discovered IP interface entities from being added to OpenNMS Horizon when the matchBehavior is satisfied. The Manage and UnManage values for this action allow the IP interface entity to be persisted by control whether or not that interface should be managed by OpenNMS Horizon.
The matchBehavior action is a boolean control that determines how the optional parameters will be evaluated. Setting this parameter’s value to ALL_PARAMETERS causes Provisiond to evaluate each optional parameter with boolean AND logic and the value ANY_PARAMETERS will cause OR logic to be applied.
Now we will add one of the optional parameters to filter the 10 network addresses.
The Matching IP Interface policy supports two additional parameters, hostName and ipAddress.
Click the Add Parameter link and choose ipAddress as the key.
The value for either of the optional parameters can be an exact or regular expression match.
As in most configurations in OpenNMS Horizon where regular expression matching can be optionally applied, prefix the value with the ~ character.
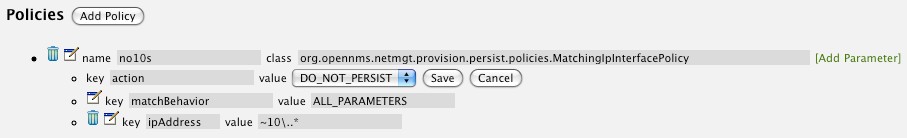
Any subsequent scan of the node or re-imports of NMS provisioning group will force this policy to be applied. IP Interface entities that already exist that match this policy will not be deleted. Existing interfaces can be deleted by recreating the node in the Provisioning Groups screen (simply change the foreign ID and re-import the group) or by using the ReST API:
curl -X DELETE -H "Content-Type: application/xml" -u admin:admin http://localhost:8980/opennms/rest/nodes/6/ipinterfaces/10.1.1.1
The next step in this example is to define a policy that sets discovered 192.168 network addresses to be unmanaged (not managed) in OpenNMS Horizon. Again, click the Add Policy button and let’s call this policy noMgt192168s. Again, choose the Mach IP Interface policy and this time set the action to UNMANAGE.
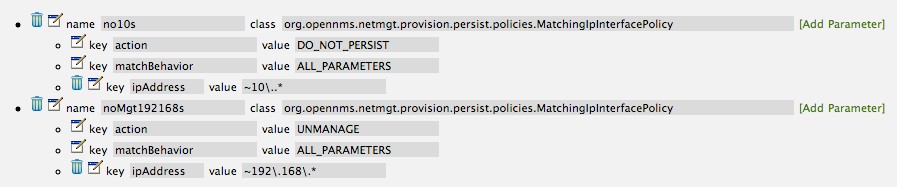
| The UNMANAGE behavior will be applied to existing interfaces. |
Like the Matching IP Interface Policy, this policy controls the whether discovered SNMP interface entities are to be persisted and whether or not OpenNMS Horizon should collect performance metrics from the SNMP agent for Interface’s index (MIB2 IfIndex).
In this example, we are going to create a policy that doesn’t persist interfaces that are AAL5 over ATM or type 49 (ifType). Following the same steps as when creating an IP Management Policy, edit the foreign source definition and create a new policy. Let’s call it: noAAL5s. We’ll use Match SNMP Interface class for each policy and add a parameter with ifType as the key and 49 as the value.
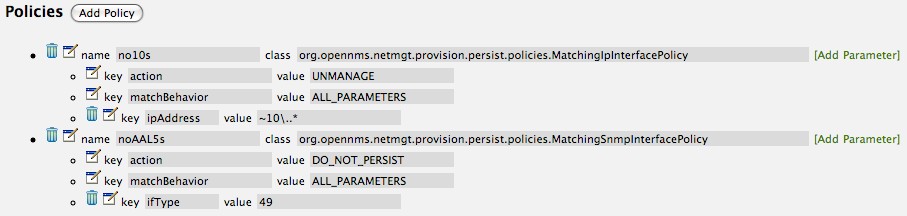
| At the appropriate time during the scanning phase, Provisiond will evaluate the policies in the foreign source definition and take appropriate action. If during the policy evaluation process any policy matches for a “DO_NOT_PERSIST” action, no further policy evaluations will happen for that particular entity (IP Interface, SNMP Interface). |
With this policy, nodes entities will automatically be assigned categories.
The policy is defined in the same manner as the IP and SNMP interface polices.
Click the Add Policy button and give the policy name, cisco and choose the Set Node Category class.
Edit the required category key and set the value to Cisco.
Add a policy parameter and choose the sysObjectId key with a value ~^\.1\.3\.6\.1\.4\.1\.9\..*.
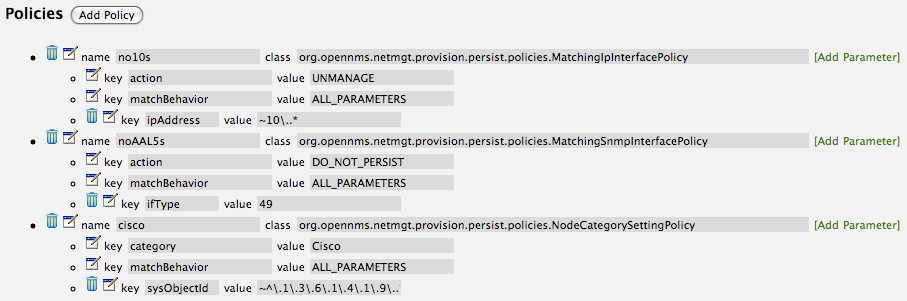
This policy allows to use Groovy scripts to modify provisioned node data.
These scripts have to be placed in the OpenNMS Horizon etc/script-policies directory.
An example would be the change of the node’s primary interface or location.
The script will be invoked for each matching node.
The following example shows the source code for setting the 192.168.100.0/24 interface to PRIMARY while all remaining interfaces are set to SECONDARY.
Furthermore the node’s location is set to Minneapolis.
import org.opennms.netmgt.model.OnmsIpInterface;
import org.opennms.netmgt.model.monitoringLocations.OnmsMonitoringLocation;
import org.opennms.netmgt.model.PrimaryType;

for(OnmsIpInterface iface : node.getIpInterfaces()) {
    if (iface.getIpAddressAsString().matches("^192\\.168\\.100\\..*")) {
        LOG.warn(iface.getIpAddressAsString() + " set to PRIMARY")
        iface.setIsSnmpPrimary(PrimaryType.PRIMARY)
    } else {
        LOG.warn(iface.getIpAddressAsString() + " set to SECONDARY")
        iface.setIsSnmpPrimary(PrimaryType.SECONDARY)
    }
}

node.setLocation(new OnmsMonitoringLocation("Minneapolis", ""));

return node;
New Import Capabilities
Several new XML entities have been added to the import requisition since the introduction of the OpenNMS Importer service in version 1.6. So, in addition to provisioning the basic node, interface, service, and node categories, you can now also provision asset data.
Provisiond Configuration
The configuration of the Provisioning system has moved from a properties file (model-importer.properties) to an XML based configuration container.
The configuration is now extensible to allow the definition of 0 or more import requisitions each with their own Cron based schedule for automatic importing from various sources (intended for integration with external URL such as HTTP and this new DNS protocol handler.
A default configuration is provided in the OpenNMS Horizon etc/ directory and is called: provisiond-configuration.xml.
This default configuration has an example for scheduling an import from a DNS server running on the localhost requesting nodes from the zone, localhost and will be imported once per day at the stroke of midnight. Not very practical but is a good example.
<?xml version="1.0" encoding="UTF-8"?>
    <provisiond-configuration xmlns:xsi="http://www.w3.org/2001/XMLSchema-instance" xsi:schemaLocation="http://xmlns.opennms.org/xsd/config/provisiond-configuration"
        foreign-source-dir="/opt/opennms/etc/foreign-sources"
        requistion-dir="/opt/opennms/etc/imports"
        importThreads="8"
        scanThreads="10"
        rescanThreads="10"
        writeThreads="8" >
    <!--
        http://www.quartz-scheduler.org/documentation/quartz-1.x/tutorials/crontrigger[http://www.quartz-scheduler.org/documentation/quartz-1.x/tutorials/crontrigger]
        Field Name Allowed Values Allowed Special Characters
        Seconds 0-59 , - * / Minutes 0-59 , - * / Hours 0-23 , - * /
        Day-of-month1-31, - * ? / L W C Month1-12 or JAN-DEC, - * /
        Day-of-Week1-7 or SUN-SAT, - * ? / L C # Year (Opt)empty, 1970-2099, - * /
    -->

    <requisition-def import-name="NMS"
                     import-url-resource="file://opt/opennms/etc/imports/NMS.xml">
        <cron-schedule>0 0 0 * * ? *</cron-schedule> <!-- daily, at midnight -->
    </requisition-def>
</provisiond-configuration>Like many of the daemon configurations in the 1.7 branch, Provisiond’s configuration is re-loadable without having to restart OpenNMS. Use the reloadDaemonConfig uei:
/opt/opennms/bin/send-event.pl uei.opennms.org/internal/reloadDaemonConfig --parm 'daemonName Provisiond'
This means that you don’t have to restart OpenNMS Horizon every time you update the configuration!
Provisioning Asset Data
The Provisioning Groups Web-UI had been updated to expose the ability to add Node Asset data in an import requisition. Click the Add Node Asset link and you can select from a drop down list all the possible node asset attributes that can be defined.
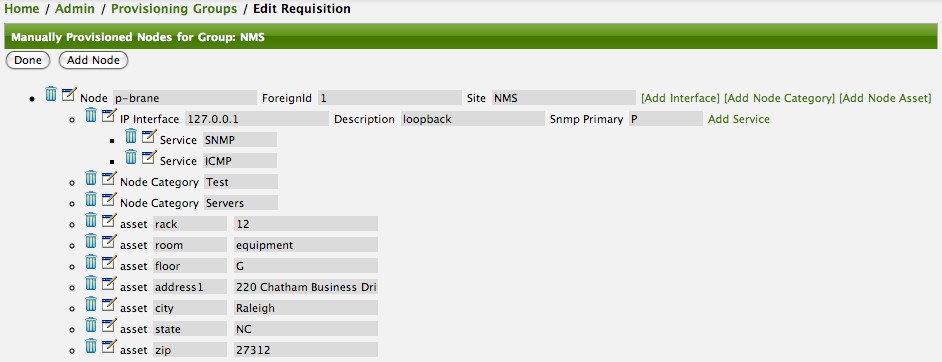
After an import, you can navigate to the Node Page and click the Asset Info link and see the asset data that was just provided in the requisition.
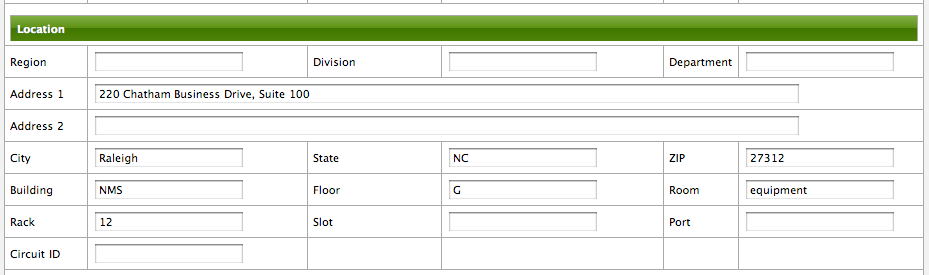
External Requisition Sources
Because Provisiond takes a URL as the location service for import requisitions, OpenNMS Horizon can be easily extended to support sources in addition to the native URL handling provided by Java: file://, http://, and https://. When you configure Provisiond to import requisitions on a schedule you specify using a URL Resource. For requisitions created by the Provisioning Groups WebUI, you can specify a file based URL.
| <need further documentation> |
Provisioning Nodes from DNS
The new Provisioning service in OpenNMS Horizon is continuously improving and adapting to the needs of the community.
One of the most recent enhancements to the system is built upon the very flexible and extensible API of referencing an import requisition’s location via a URL.
Most commmonly, these URLs are files on the file system (i.e. file:/opt/opennms/etc/imports/<my-provisioning-group.xml>) as requisitions created by the Provisioning Groups UI. However, these same requistions for adding, updating, and deleting nodes (based on the original model importer) can also come from URLs specifying the HTTP protocol: http://myinventory.server.org/nodes.cgi)
Now, using Java’s extensible protocol handling specification, a new protocol handler was created so that a URL can be specified for requesting a Zone Transfer (AXFR) request from a DNS server. The A records are recorded and used to build an import requisition. This is handy for organizations that use DNS (possibly coupled with an IP management tool) as the data base of record for nodes in the network. So, rather than ping sweeping the network or entering the nodes manually into OpenNMS Horizon Provisioning UI, nodes can be managed via 1 or more DNS servers. The format of the URL for this new protocol handler is:
dns://<host>[:port]/<zone>[/<foreign-source>/][?expression=<regex>]
dns://my-dns-server/myzone.com
This will import all A records from the host my-dns-server on port 53 (default port) from zone myzone.com and since the foreign source (a.k.a. the provisioning group) is not specified it will default to the specified zone.
You can also specify a subset of the A records from the zone transfer using a regular expression:
dns://my-dns-server/myzone.com/portland/?expression=^por-.*
This will import all nodes from the same server and zone but will only manage the nodes in the zone matching the regular expression ^port-.* and will and they will be assigned a unique foreign source (provisioning group) for managing these nodes as a subset of nodes from within the specified zone.
If your expression requires URL encoding (for example you need to use a ? in the expression) it must be properly encoded.
dns://my-dns-server/myzone.com/portland/?expression=^por[0-9]%3F
Currently, the DNS server requires to be setup to allow a zone transfer from the OpenNMS Horizon server. It is recommended that a secondary DNS server is running on OpenNMS Horizon and that the OpenNMS Horizon server be allowed to request a zone transfer. A quick way to test if zone transfers are working is:
dig -t AXFR @<dn5Server> <zone>
11.6. Adapters
The OpenNMS Horizon Provisiond API also supports Provisioning Adapters (plugins) for integration with external systems during the provisioning Import phase. When node entities are added, updated, deleted, or receive a configuration management change event, OpenNMS Horizon will call the adapter for the provisioning activities with integrated systems.
Currently, OpenNMS Horizon supports the following adapters:
11.6.1. DDNS Adapter
The Opposite end of Provisiond integration from the DNS Requisition Import, is the DDNS adapter.
This adapter uses the dynamic DNS protocol to update a DNS system as nodes are provisioned into OpenNMS Horizon.
To configure this adapter, edit the opennms.properties file and set the importer.adapter.dns.server property:
importer.adapter.dns.server=192.168.1.1
11.6.2. RANCID Adapter
Integration has been integrated with RANCID though this new API.
| <More documentation needed> |
| Maps (soon to be moved to Mapd) <documentation required> |
| WiMax-Link (soon to be moved to Linkd) <documentation required> |
11.7. Meta-Data assigned to Nodes
A requisition can contain arbitrary meta-data for each node, interface and service it contains. During provisioning, the meta-data is copied to the model and persisted in the database.
The Requisition UI allows to edit the meta-data defined in a requisition.
The edit function in the Requisition UI is limited to only edit the context called requisition by intention.
All other contexts are reserved for future use by other provisioning-adapters and similar applications like asset-data.
While provisioning a requisition, the meta-data from the requisition is transferred to the database and assigned to the nodes, interfaces and services accordingly.
11.7.1. User defined contexts
If there is a requirement to add more contexts not managed by OpenNMS Horizon, the context name must be prefixed by X-.
Any third-party software must take care to choose a context name which is unique enough to not conflict with other software.
11.8. Integrating with Provisiond
The ReST API should be used for integration from other provisioning systems with OpenNMS Horizon. The ReST API provides an interface for defining foreign sources and requisitions.
11.8.1. Provisioning Groups of Nodes
Just as with the WebUI, groups of nodes can be managed via the ReST API from an external system. The steps are:
-
Create a Foreign Source (if not using the default) for the group
-
Update the SNMP configuration for each node in the group
-
Create/Update the group of nodes
11.8.2. Example
Step 1 - Create a Foreign Source
If policies for this group of nodes are going to be specified differently than the default policy, then a foreign source should be created for the group. Using the ReST API, a foreign source can be provided. Here is an example:
The XML can be imbedded in the curl command option -d or be referenced from a file if the @ prefix is used with the file name as in this case.
|
The XML file: customer-a.foreign-source.xml:
<?xml version="1.0" encoding="UTF-8" standalone="yes"?>
<foreign-source date-stamp="2009-10-12T17:26:11.616-04:00" name="customer-a" xmlns="http://xmlns.opennms.org/xsd/config/foreign-source">
    <scan-interval>1d</scan-interval>
    <detectors>
        <detector class="org.opennms.netmgt.provision.detector.icmp.IcmpDetector" name="ICMP"/>
        <detector class="org.opennms.netmgt.provision.detector.snmp.SnmpDetector" name="SNMP"/>
    </detectors>
    <policies>
        <policy class="org.opennms.netmgt.provision.persist.policies.MatchingIpInterfacePolicy" name="no-192-168">
            <parameter value="UNMANAGE" key="action"/>
            <parameter value="ALL_PARAMETERS" key="matchBehavior"/>
            <parameter value="~^192\.168\..*" key="ipAddress"/>
        </policy>
    </policies>
</foreign-source>
Here is an example curl command used to create the foreign source with the above foreign source specification above:
curl -v -u admin:admin -X POST -H 'Content-type: application/xml' -d '@customer-a.foreign-source.xml' http://localhost:8980/opennms/rest/foreignSourcesNow that you’ve created the foreign source, it needs to be deployed by Provisiond.
Here an the example using the curl command to deploy the foreign source:
curl -v -u admin:admin http://localhost:8980/opennms/rest/foreignSources/pending/customer-a/deploy -X PUT| The current API doesn’t strictly follow the ReST design guidelines and will be updated in a later release. |
Step 2 - Update the SNMP configuration
The implementation only supports a PUT request because it is an implied "Update" of the configuration since it requires an IP address and all IPs have a default configuration.
This request is is passed to the SNMP configuration factory in OpenNMS Horizon for optimization of the configuration store snmp-config.xml.
This example changes the community string for the IP address 10.1.1.1 to yRuSonoZ.
| Community string is the only required element |
curl -v -X PUT -H "Content-Type: application/xml" -H "Accept: application/xml" -d <snmp-info><community>yRuSonoZ</community><port>161</port><retries>1</retries><timeout>2000</timeout><version>v2c</version></snmp-info>" -u admin:admin http://localhost:8980/opennms/rest/snmpConfig/10.1.1.1Step 3 - Create/Update the Requisition
This example adds 2 nodes to the Provisioning Group, customer-a. Note that the foreign-source attribute typically has a 1 to 1 relationship to the name of the Provisioning Group requisition. There is a direct relationship between the foreign- source attribute in the requisition and the foreign source policy specification. Also, typically, the name of the provisioning group will also be the same. In the following example, the ReST API will automatically create a provisioning group based on the value foreign-source attribute specified in the XML requisition.
curl -X POST -H "Content-Type: application/xml" -d "<?xml version="1.0" encoding="UTF-8"?><model-import xmlns="http://xmlns.opennms.org/xsd/config/model-import" date-stamp="2009-03-07T17:56:53.123-05:00" last-import="2009-03-07T17:56:53.117-05:00" foreign-source="customer-a"><node node-label="p-brane" foreign-id="1" ><interface ip-addr="10.0.1.3" descr="en1" status="1" snmp-primary="P"><monitored-service service-name="ICMP"/><monitored-service service-name="SNMP"/></interface><category name="Production"/><category name="Routers"/></node><node node-label="m-brane" foreign-id="1" ><interface ip-addr="10.0.1.4" descr="en1" status="1" snmp-primary="P"><monitored-service service-name="ICMP"/><monitored-service service-name="SNMP"/></interface><category name="Production"/><category name="Routers"/></node></model-import>" -u admin:admin http://localhost:8980/opennms/rest/requisitionsA provisioning group file called etc/imports/customer-a.xml will be found on the OpenNMS Horizon system following the successful completion of this curl command and will also be visible via the WebUI.
| Add, Update, Delete operations are handled via the ReST API in the same manner as described in detailed specification. |
11.9. Provisioning Single Nodes (Quick Add Node)
Often, it is requested that a single node add/update be completed for an already defined provisioning group. There is a ReST API for the Add Node implementation found in the OpenNMS Horizon Web-UI. For this to work, the provisioning group must already exist in the system even if there are no nodes defined in the group.
-
Create a foreign source (if required)
-
Specify SNMP configuration
-
Provide a single node with the following specification
11.10. Fine Grained Provisioning Using provision.pl
provision.pl provides an example command-line interface to the provisioning-related OpenNMS Horizon REST API endpoints.
The script has many options but the first 3 optional parameters are described here:
You can use --help to the script to see all the available options.
|
--username (default: admin) --password (default: admin) --url (default: http://localhost:8980/opennms/rest)
11.10.1. Create a new requisition
provision.pl provides easy access to the requisition REST service using the requisition option:
${OPENNMS_HOME}/bin/provision.pl requisition customer1This command will create a new, empty (containing no nodes) requisition in OpenNMS Horizon.
The new requisition starts life in the pending state.
This allows you to iteratively build the requisition and then later actually import the nodes in the requisition into OpenNMS Horizon.
This handles all adds/changes/deletes at once.
So, you could be making changes all day and then at night either have a schedule in OpenNMS Horizon that imports the group automatically or you can send a command through the REST service from an outside system to have the pending requisition imported/reimported.
You can get a list of all existing requisitions with the list option of the provision.pl script:
${OPENNMS_HOME}/bin/provision.pl listCreate a new Node
${OPENNMS_HOME}/bin/provision.pl node add customer1 1 node-aThis command creates a node element in the requisition customer1 called node-a using the script’s node option. The node’s foreign-ID is 1 but it can be any alphanumeric value as long as it is unique within the requisition. Note the node has no interfaces or services yet.
Add an Interface Element to that Node
${OPENNMS_HOME}/bin/provision.pl interface add customer1 1 127.0.0.1This command adds an interface element to the node element using the interface option to the provision.pl command and it can now be seen in the pending requisition by running provision.pl requisition list customer1.
Add a Couple of Services to that Interface
${OPENNMS_HOME}/bin/provision.pl service add customer1 1 127.0.0.1 ICMP
${OPENNMS_HOME}/bin/provision.pl service add customer1 1 127.0.0.1 SNMPThis adds the 2 services to the specified 127.0.0.1 interface and is now in the pending requisition.
Set the Primary SNMP Interface
${OPENNMS_HOME}/bin/provision.pl interface set customer1 1 127.0.0.1 snmp-primary PThis sets the 127.0.0.1 interface to be the node’s Primary SNMP interface.
Add a couple of Node Categories
${OPENNMS_HOME}/bin/provision.pl category add customer1 1 Routers
${OPENNMS_HOME}/bin/provision.pl category add customer1 1 ProductionThis adds the two categories to the node and is now in the pending requisition.
These categories are case-sensitive but do not have to be already defined in OpenNMS Horizon. They will be created on the fly during the import if they do not already exist.
Setting Asset Fields on a Node
${OPENNMS_HOME}/bin/provision.pl asset add customer1 1 serialnumber 9999This will add value of 9999 to the asset field: serialnumber.
${OPENNMS_HOME}/bin/provision.pl requisition import customer1This will cause OpenNMS Horizon Provisiond to import the pending customer1 requisition.
The formerly pending requisition will move into the deployed state inside OpenNMS Horizon.
Very much the same as the add, except that a single delete command and a re-import is required. What happens is that the audit phase is run by Provisiond and it will be determined that a node has been removed from the requisition and the node will be deleted from the DB and all services will stop activities related to it.
${OPENNMS_HOME}/bin/provision.pl node delete customer1 1 node-a
${OPENNMS_HOME}/bin/provision.pl requisition import customer1This completes the life cycle of managing a node element, iteratively, in a import requisition.
11.11. Yet Other API Examples
The provision.pl script doesn’t supply this feature but you can get it via the REST API. Here is an example using curl:
#!/bin/bash
REQ=$1
curl -X GET -H "Content-Type: application/xml" -u admin:admin http://localhost:8980/opennms/rest/requisitions/$REQ 2>/dev/null | xmllint --format -11.12. SNMP Profiles
SNMP Profiles are prefabricated sets of SNMP configuration which are automatically "fitted" against eligible IP addresses at provisioning time. Each profile may have a unique label and an optional filter expression. If the filter expression is present, it will be evaluated to check whether a given IP address or reverse-lookup hostname passes the filter. A profile with a filter expression will be fitted to a given IP address only if the filter expression evaluates true against that IP address.
SNMP profiles can be added to snmp-config.xml to enable automatic fitting of SNMP interfaces.
<snmp-config xmlns="http://xmlns.opennms.org/xsd/config/snmp" write-community="private" read-community="public" timeout="800" retry="3">
<definition version="v1" ttl="6000">
<specific>127.0.0.1</specific>
</definition>
<profiles>
<profile version="v1" read-community="horizon" timeout="10000">
<label>profile1</label>
</profile>
<profile version="v1" ttl="6000">
<label>profile2</label>
<filter>iphostname LIKE '%opennms%'</filter>
</profile>
<profile version="v1" read-community="meridian">
<label>profile3</label>
<filter>IPADDR IPLIKE 172.1.*.*</filter>
</profile>
</profiles>
</snmp-config>In the above config,
-
profile1doesn’t have a filter expression. This profile will be tried for every interface. -
profile2has a filter expression that comparesiphostname(the hostname resulting from a reverse DNS lookup of the IP address being fitted) against a preconfigured value. This profile’s SNMP parameters will be fitted only against IP addresses whose hostname contains the stringopennms. -
profile3has an IPLIKE expression that matches all interfaces in the range specified in the filter. This profile’s SNMP parameters will be fitted only against IP addresses in the range specified by theIPLIKEexpression.
Profiles will be tried in the order they are configured.
The first match that produces a successful SNMP GET-REQUEST on the scalar instance of sysObjectID will be saved by Provisiond as the SNMP configuratoin definition to use for all future SNMP operations against the fitted IP address.
|
default as profile label is reserved for default SNMP config.
|
The opennms:snmp-fit Karaf shell command finds a matching profile for a given IP address and prints out the resulting config.
Matching or "fitting" an SNMP profile should be understood as passing the profile’s filter expression and success in getting the scalar sysObjectID instance.
$ ssh -p 8101 admin@localhost
...
admin@opennms()> opennms:snmp-fit -l MINION -s 172.1.1.105 (1)
admin@opennms()> opennms:snmp-fit 172.1.1.106 profile1 (2)| 1 | searches the profiles that fit the IP address 172.1.1.105 at location Minion and saves the resulting configuration as a definition for future use. |
| 2 | checks whether the profile with label profile1 is a fit for IP address 172.1.1.106.
If it succeeds, it prints out the resulting agent config, but does not save any definition. |
The opennms:snmp-remove-from-definition Karaf shell command removes an IP address from the system-wide SNMP configuration definitions.
$ ssh -p 8101 admin@localhost ... admin@opennms()> opennms:snmp-remove-from-definition -l MINION 172.1.0.255
This removes IP address 172.1.0.255 at location MINION from the system-wide SNMP configuration so that this IP address can be fitted to a new profile.
This command might be useful when an IP address formerly assigned to an SNMPv2c-capable switch is reassigned to an SNMPv3-capable load balancer.
By default SnmpDetector doesn’t use SNMP profiles. Add property useSnmpProfiles and set it to true in order to use SNMP Profiles.
11.13. Auto Discovery with Detectors
Currently OpenNMS Horizon uses ICMP ping sweep to find IP address on the network.
The IP Ranges and specifics can be defined in discovery-configuration.xml as shown below.
<discovery-configuration xmlns="http://xmlns.opennms.org/xsd/config/discovery" packets-per-second="1"
initial-sleep-time="30000" restart-sleep-time="86400000" retries="1" timeout="2000">
<!-- see examples/discovery-configuration.xml for options -->
<specific>10.0.0.5</specific>
<include-range>
<begin>192.168.0.1</begin>
<end>192.168.0.254</end>
</include-range>
<include-url>file:/opt/opennms/etc/include.txt</include-url>
</discovery-configuration>Auto Discovery with Detectors allows users to specify the services that needs to be detected apart from ICMP ping for the IP Addresses to be discovered. Only when specified detectors succeeds, auto discovery will send new suspect event.
Sample Configuration with detectors is shown below.
<discovery-configuration xmlns="http://xmlns.opennms.org/xsd/config/discovery" packets-per-second="1"
initial-sleep-time="30000" restart-sleep-time="86400000" retries="1" timeout="2000">
<definition location="MINION" foreign-source="ApexOffice">
<detectors>
<detector name="reverse-dns-lookup" class-name="org.opennms.netmgt.provision.detector.rdns.ReverseDNSLookupDetector"/>
<detector name="SNMP" class-name="org.opennms.netmgt.provision.detector.snmp.SnmpDetector">
<parameter key="timeout" value="5000"/>
<parameter key="ttl" value="120000"/>
</detector>
</detectors>
<specific>10.0.0.5</specific>
<include-range>
<begin>192.168.0.1</begin>
<end>192.168.0.254</end>
</include-range>
<exclude-range>
<begin>192.168.0.120</begin>
<end>192.168.0.125</end>
</exclude-range>
<include-url>file:/opt/opennms/etc/include.txt</include-url>
</definition>
</discovery-configuration>In above configuration, specifics and ranges are moved into definition with SNMP and reverse-dns-lookup detectors. When all of the detectors succeeeds at a given location, then only the specific IP Address considered to be discovered.
A definition without any detectors will fall back to ICMP ping for discovery.
11.14. Service Detectors
Service detectors allow to bind a service to an interface automatically if it is detected during provisioning of a requisition.
11.14.1. Meta-Data-DSL
Service detectors can leverage dynamic configuration by using the Meta-Data-DSL in each possible parameter.
During evaluation of an expression the following scopes are available:
-
Node meta-data
-
Interface meta-data
11.14.2. HTTP Detector
This detector is used to find and assigns services based on HTTP.
Detector facts
Implementation |
|
Configuration and Usage
| Parameter | Description | Required | Default value |
|---|---|---|---|
|
If set to true only HTTP status codes that are the same or lower than the value of maxRetCode pass. |
optional |
false |
|
Highest HTTP response code that passes. maxRetCode is only evaluated if checkRetCode is set to true. |
optional |
399 |
|
Port to query . |
optional |
80 |
|
Url to query |
optional |
/ |
|
Timeout in milliseconds to wait for a response. |
optional |
2000 |
Please note: The Http Detector makes only one http request and doesn’t follow redirects.
Example Configuration
<?xml version="1.0" encoding="UTF-8" standalone="yes"?>
<foreign-source date-stamp="2010-06-29T13:15:30.494+02:00" name="test" xmlns="http://xmlns.opennms.org/xsd/config/foreign-source">
<scan-interval>1d</scan-interval>
<detectors>
<detector class="org.opennms.netmgt.provision.detector.simple.HttpDetector" name="http8080">
<parameter key="port" value="8080"/>
<parameter key="url" value="index2.html" />
<parameter key="maxRetCode" value="200"/>
<parameter key="checkRetCode" value="true"/>
</detector>
</detectors>
<policies/>
</foreign-source>11.14.3. HTTPS Detector
This detector is used to find and assigns services based on HTTPS.
Detector facts
Implementation |
|
Configuration and Usage
The parameters are the same as for the HTTP detector
11.14.4. SNMP Detector
This detector is used to find and assigns services based on SNMP. The detector binds a service with a given Service Name when a particular SNMP OID as scalar or table matches a given criteria.
Detector facts
Implementation |
|
Configuration and Usage
| Parameter | Description | Required | Default value |
|---|---|---|---|
|
SNMP OID for scalar or table to detect the service. |
required |
|
|
Number of retries to detect the service. |
optional |
agent config |
|
Timeout in milliseconds to wait for a response from the SNMP agent. |
optional |
agent config |
|
expected return value to detect the service; if not specified the service is detected if the SNMP OID
returned any kind of valid value.
The |
optional |
|
|
Set |
optional |
|
|
Set |
optional |
|
|
Set match type to evaluate the expected value in the SNMP table. |
optional |
|
|
Set |
optional |
|
|
Time to live in milliseconds to wait for a response from the Minion. |
optional |
|
Example for SNMP scalar value
We have Dell server farm and want to monitor the global server status provided by the OpenManage Server Administrator.
Global status is provided by a scalar OID .1.3.6.1.4.1.674.10892.1.200.10.1.2.1.
The service should be automatically detected if the server supports this OID.
For provisioning we have a requisition named Server which contains all server of our data center. A Detector with the name Dell-OMSA-Global-State for this requisition is created with the following parameter:
| Parameter | Value |
|---|---|
|
|
|
|
When the requisition Server is synchronized the service Dell-OMSA-Global-State will be detected in case they support the given SNMP OID.
Example using SNMP tables
We have a HP server farm and want to monitor the status of logical drives over SNMP provided from HP Insight Manager.
The status for logical drives is provided in a SNMP Table under .1.3.6.1.4.1.232.3.2.3.1.1.4.
The service should be automatically assigned to all servers exposing the given SNMP OID.
For provisioning we have a requisition named Server which contains all server of our data center. A Detector with the name HP-Insight-Drive-Logical for this requisition is created with the following parameter:
| Parameter | Value |
|---|---|
|
|
|
|
|
|
When the requisition Server is synchronized the service HP-Insight-Drive-Logical will be detected in case they support the given SNMP OID table.
11.14.5. WS-Man Detector
The WS-Management detector attempts to connect to the agent defined in wsman-config.xml and issues an Identify command.
If the Identify command is successful, the service is marked as detected and the product details returned by the command are optionally stored in the asset fields (see details bellow.)
Detector facts
Implementation |
|
Configuration and Usage
| Parameter | Description | Required | Default value |
|---|---|---|---|
|
Stores the product vendor and product version in the |
false |
|
Examples
If a valid response to the Identify command is received, the product vendor and product version are stored in the vendor and modelNumber fields of the associated node`s assets table.
For example, a Windows Server 2008 machine returns:
Product Vendor |
Microsoft Corporation |
Product Version |
OS: 6.1.7601 SP: 1.0 Stack: 2.0 |
If these assets field are being used for another purpose, this behavior can be disabled by settings the updateAssets parameters to false in the detector configuration of the appropriate foreign source.
Some agents may respond to the Identify command with generic identities such as Openwsman 2.0.0.
These values can be overridden by specifying the product-vendor and product-version attributes in wsman-config.xml.
|
Example detector configuration:
<detector name="WS-Man" class="org.opennms.netmgt.provision.detector.wsman.WsManDetector">
<parameter key="updateAssets" value="true"/>
</detector>The response is logged as DEBUG information in provisiond.log and looks like the following:
ID: 3
Response-Code: 200
309Encoding: UTF-8
Content-Type: application/soap+xml;charset=UTF-8
Headers: {Content-Length=[787], content-type=[application/soap+xml;charset=UTF-8], Date=[Mon, 08 Feb 2016 14:21:20 GMT], Server=[Microsoft-HTTPAPI/2.0]}
Payload:
<s:Envelope xmlns:s="http://www.w3.org/2003/05/soap-envelope" xml:lang="en-US">
<s:Header/>
<s:Body>
<wsmid:IdentifyResponse xmlns:wsmid="http://schemas.dmtf.org/wbem/wsman/identity/1/wsmanidentity.xsd">
<wsmid:ProtocolVersion>http://schemas.dmtf.org/wbem/wsman/1/wsman.xsd</wsmid:ProtocolVersion>
<wsmid:ProductVendor>Microsoft Corporation</wsmid:ProductVendor>(1)
<wsmid:ProductVersion>OS: 6.2.9200 SP: 0.0 Stack: 3.0</wsmid:ProductVersion>(2)
<wsmid:SecurityProfiles>
<wsmid:SecurityProfileName>http://schemas.dmtf.org/wbem/wsman/1/wsman/secprofile/http/basic</wsmid:SecurityProfileName>
<wsmid:SecurityProfileName>http://schemas.dmtf.org/wbem/wsman/1/wsman/secprofile/http/spnego-kerberos</wsmid:SecurityProfileName>
</wsmid:SecurityProfiles>
</wsmid:IdentifyResponse>
</s:Body>
</s:Envelope>| 1 | ProductVendor: Stored to the asset field vendor |
| 2 | ProductVersion: Stored in the asset field modelNumber |
| The information of the asset fields are used in the System Definition Rule to decide which performance metrics will be gathered from Collectd. |
11.14.6. WS-Man WQL Detector
The WS-Management WQL detector attempts to connect to the agent defined in wsman-config.xml and issues a WQL query.
If the query successfully returns one or more items, the service is marked as detected. The WS-Man WQL detector can be used to define arbitrary services based on WQL filter results.
Detector facts
Implementation |
|
Configuration and Usage
| Parameter | Description | Required | Default value |
|---|---|---|---|
|
A resourceUri consists of a prefix and a path to a resource. |
yes |
|
|
A query using the WQL filter dialect |
yes |
|
|
A custom service name to identify this service |
no |
|
Examples
Example detector configuration:
<detector name="WinRM" class="org.opennms.netmgt.provision.detector.wsman.WsManWQLDetector">
<parameter key="resourceUri" value="http://schemas.microsoft.com/wbem/wsman/1/wmi/root/cimv2/*"/>
<parameter key="serviceName" value="WinRM"/>
<parameter key="wql" value="select Name,Status from Win32_Service where Name = 'WinRM' and StartMode='Auto' and Status = 'OK'"/>
</detector>The response is logged as DEBUG information in provisiond.log and looks like the following:
ID: 167
Response-Code: 200
Encoding: UTF-8
Content-Type: application/soap+xml;charset=UTF-8
Headers: {Content-Length=[975], content-type=[application/soap+xml;charset=UTF-8], Date=[Thu, 02 Aug 2018 20:34:33 GMT], Server=[Microsoft-HTTPAPI/2.0]
Payload: <s:Envelope xmlns:s="http://www.w3.org/2003/05/soap-envelope" xmlns:a="http://schemas.xmlsoap.org/ws/2004/08/addressing" xmlns:n="http://schemas.xmlsoap.org/ws/2004/09/enumeration" xmlns:w="http://schemas.dmtf.org/wbem/wsman/1/wsman.xsd" xml:lang="en-US">
<s:Header>
<a:Action>http://schemas.xmlsoap.org/ws/2004/09/enumeration/EnumerateResponse</a:Action>
<a:MessageID>uuid:2298892C-575F-4722-82F6-C77F9E8B1A4F</a:MessageID>
<a:To>http://schemas.xmlsoap.org/ws/2004/08/addressing/role/anonymous</a:To>
<a:RelatesTo>urn:uuid:3c63e4d5-890c-4706-854b-876bf3b35b99</a:RelatesTo>
</s:Header>
<s:Body>
<n:EnumerateResponse>
<n:EnumerationContext/>
<w:Items>
<w:XmlFragment xmlns:xsi="http://www.w3.org/2001/XMLSchema-instance" xmlns:w="http://schemas.dmtf.org/wbem/wsman/1/wsman.xsd" xmlns:m="http://schemas.microsoft.com/wbem/wsman/1/wsman.xsd">
<Name>WinRM</Name>
<Status>OK</Status>
</w:XmlFragment>
</w:Items>
<w:EndOfSequence/>
</n:EnumerateResponse>
</s:Body>
</s:Envelope>11.14.7. Reverse-DNS-Lookup Detector
This detector tries to detect if a given IP Address can be found in PTR records.
Detector facts
Implementation |
|
Configuration and Usage
Reverse DNS Lookup Detector doesn’t take any parameters.
Examples
Reverse-DNS-Lookup Detector can be used in auto discovery with detectors to discover IP Addresses that only resolve FQDN.
12. Business Service Monitoring
While OpenNMS Horizon detects issues in your network by device, interface or service, the Business Service Monitoring (BSM) takes it one step further. The BSM components allows you to monitor and model high level Business Services (BS) and helps quickly identify the most critical problems affecting these. With the BSM feature it is possible to model a high level BS context around the technical Service Monitors provided in OpenNMS Horizon. To indicate which BS is affected by events at the technical Service Monitors level, a BS Operational Status is calculated.
As an example, let’s assume a company runs an online store. Customers enter through a login system, select items, place them in the shopping cart and checkout using a payment system. The whole service is provided by a few web servers and access data from databases. To monitor the status of the databases, a SQL service monitor on each database server is configured. For testing the web servers a HTTP service monitor is used for each of them. Covering the overall functionality a Page Sequence Monitor (PSM) is used to test the login, shop and payment workflow through the provided web portal. A possible representation of the whole system hierarchy is shown in figure Example scenario for a web shop.
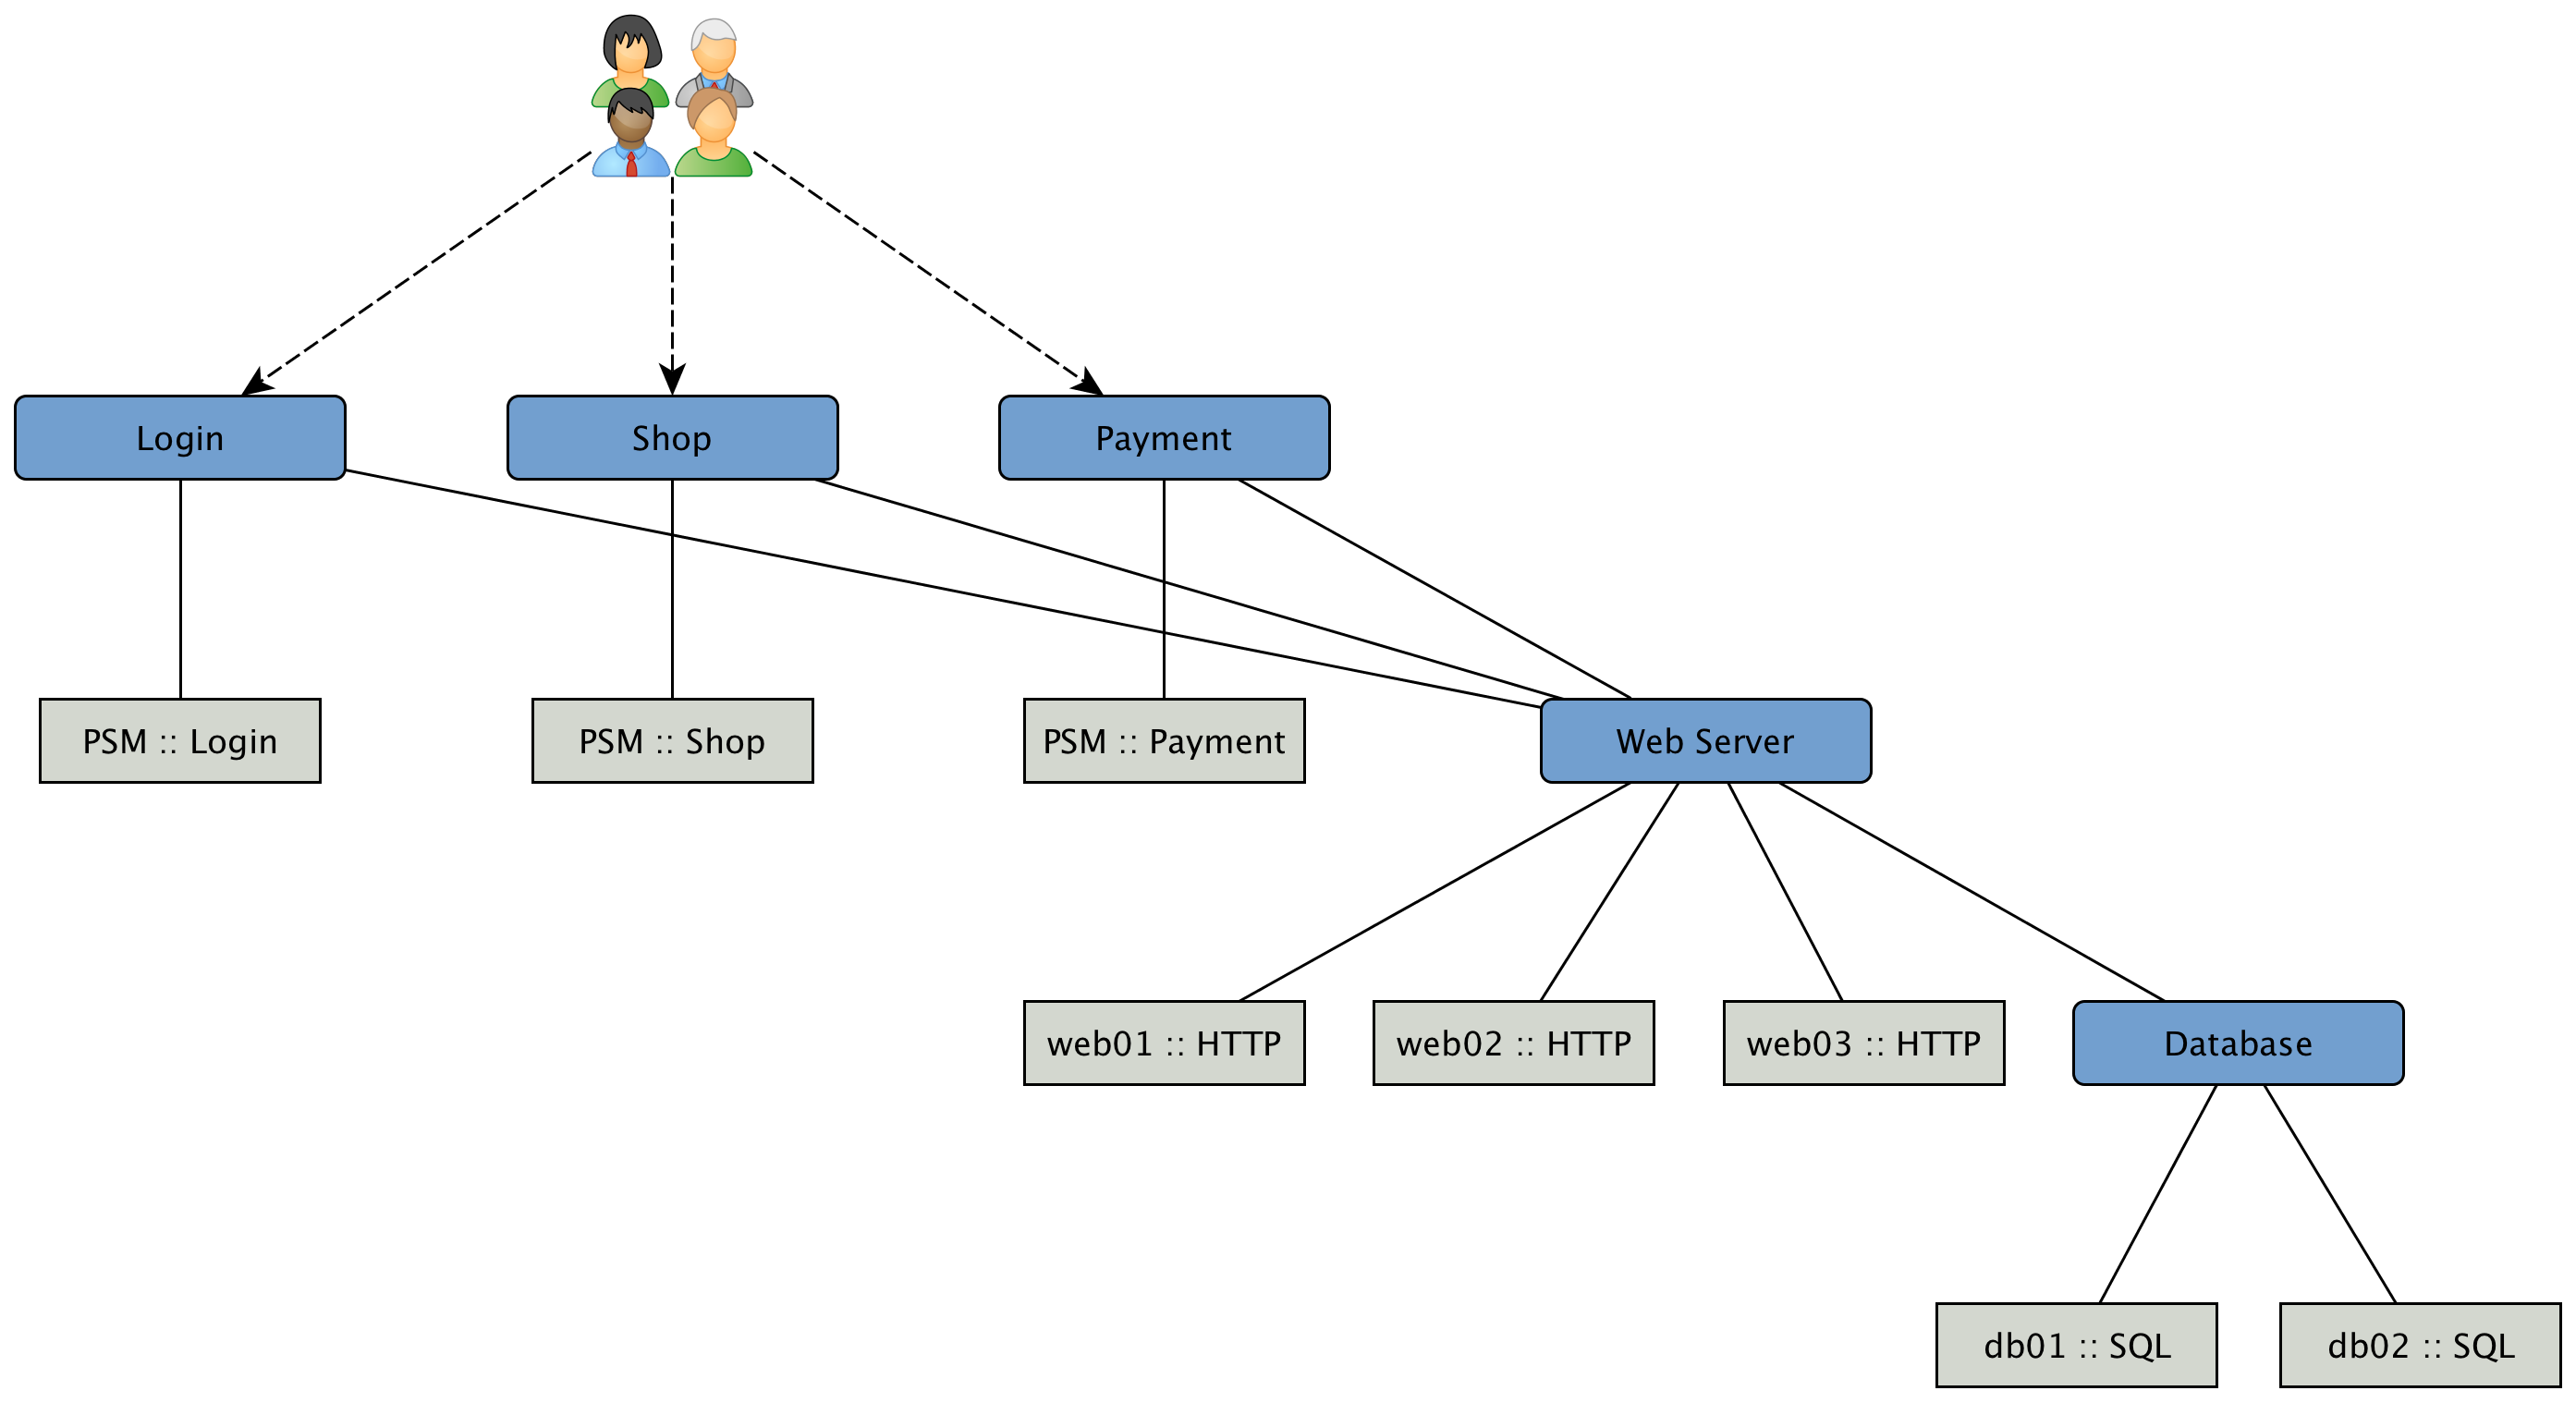
To be able to model this scenarios the BSM functions can be used. The Business Service Monitoring (BSM) feature includes the following components:
-
Business Service Monitoring Daemon (BSMD): Maintains and drives the state of all BS
-
Business Service Editor: Web application which allows you to create, update or delete BS
-
Topology View for Business Services: Visual representation of the Business Service Hierarchy as a component of the Topology User Interface.
-
BSM ReST API: ReST based API to create, read, update or delete BS
12.1. Business Service Hierarchy
BS can depend on each other and build together a Business Service Hierarchy. It can be visualized using the Topology User Interface with the Business Services View. The Operational Status of a BS is ultimately calculated from Alarms and their Severity. To define the class of Alarms a Reduction Key is used and is represented as an Edge of a BS. Giving more granularity than just Up or Down, the Operational Status uses the Severities, i.e. Normal, Warning, Minor, Major, Critical.
Based on the hierarchy, the Operational Status is calculated with Map and Reduce Functions. A Map Function influences which Severity from the Edge is used as an input to the BS. A Reduce Function is used to consolidate the Severities from all Edges of a BS and uses them as inputs and reduces them into a single Severity, which is the Operational Status.
The Topology User Interface allows users to traverse Business Service Hierarchies using the Semantic Zoom Level (SZL). The Semantic Zoom Level (SZL, pronounced as 'sizzle') defines how many Neighbors are shown related to the elements which are in Focus. The number can be interpreted as how many Hops from the Focus should be shown on the Topology User Interface.
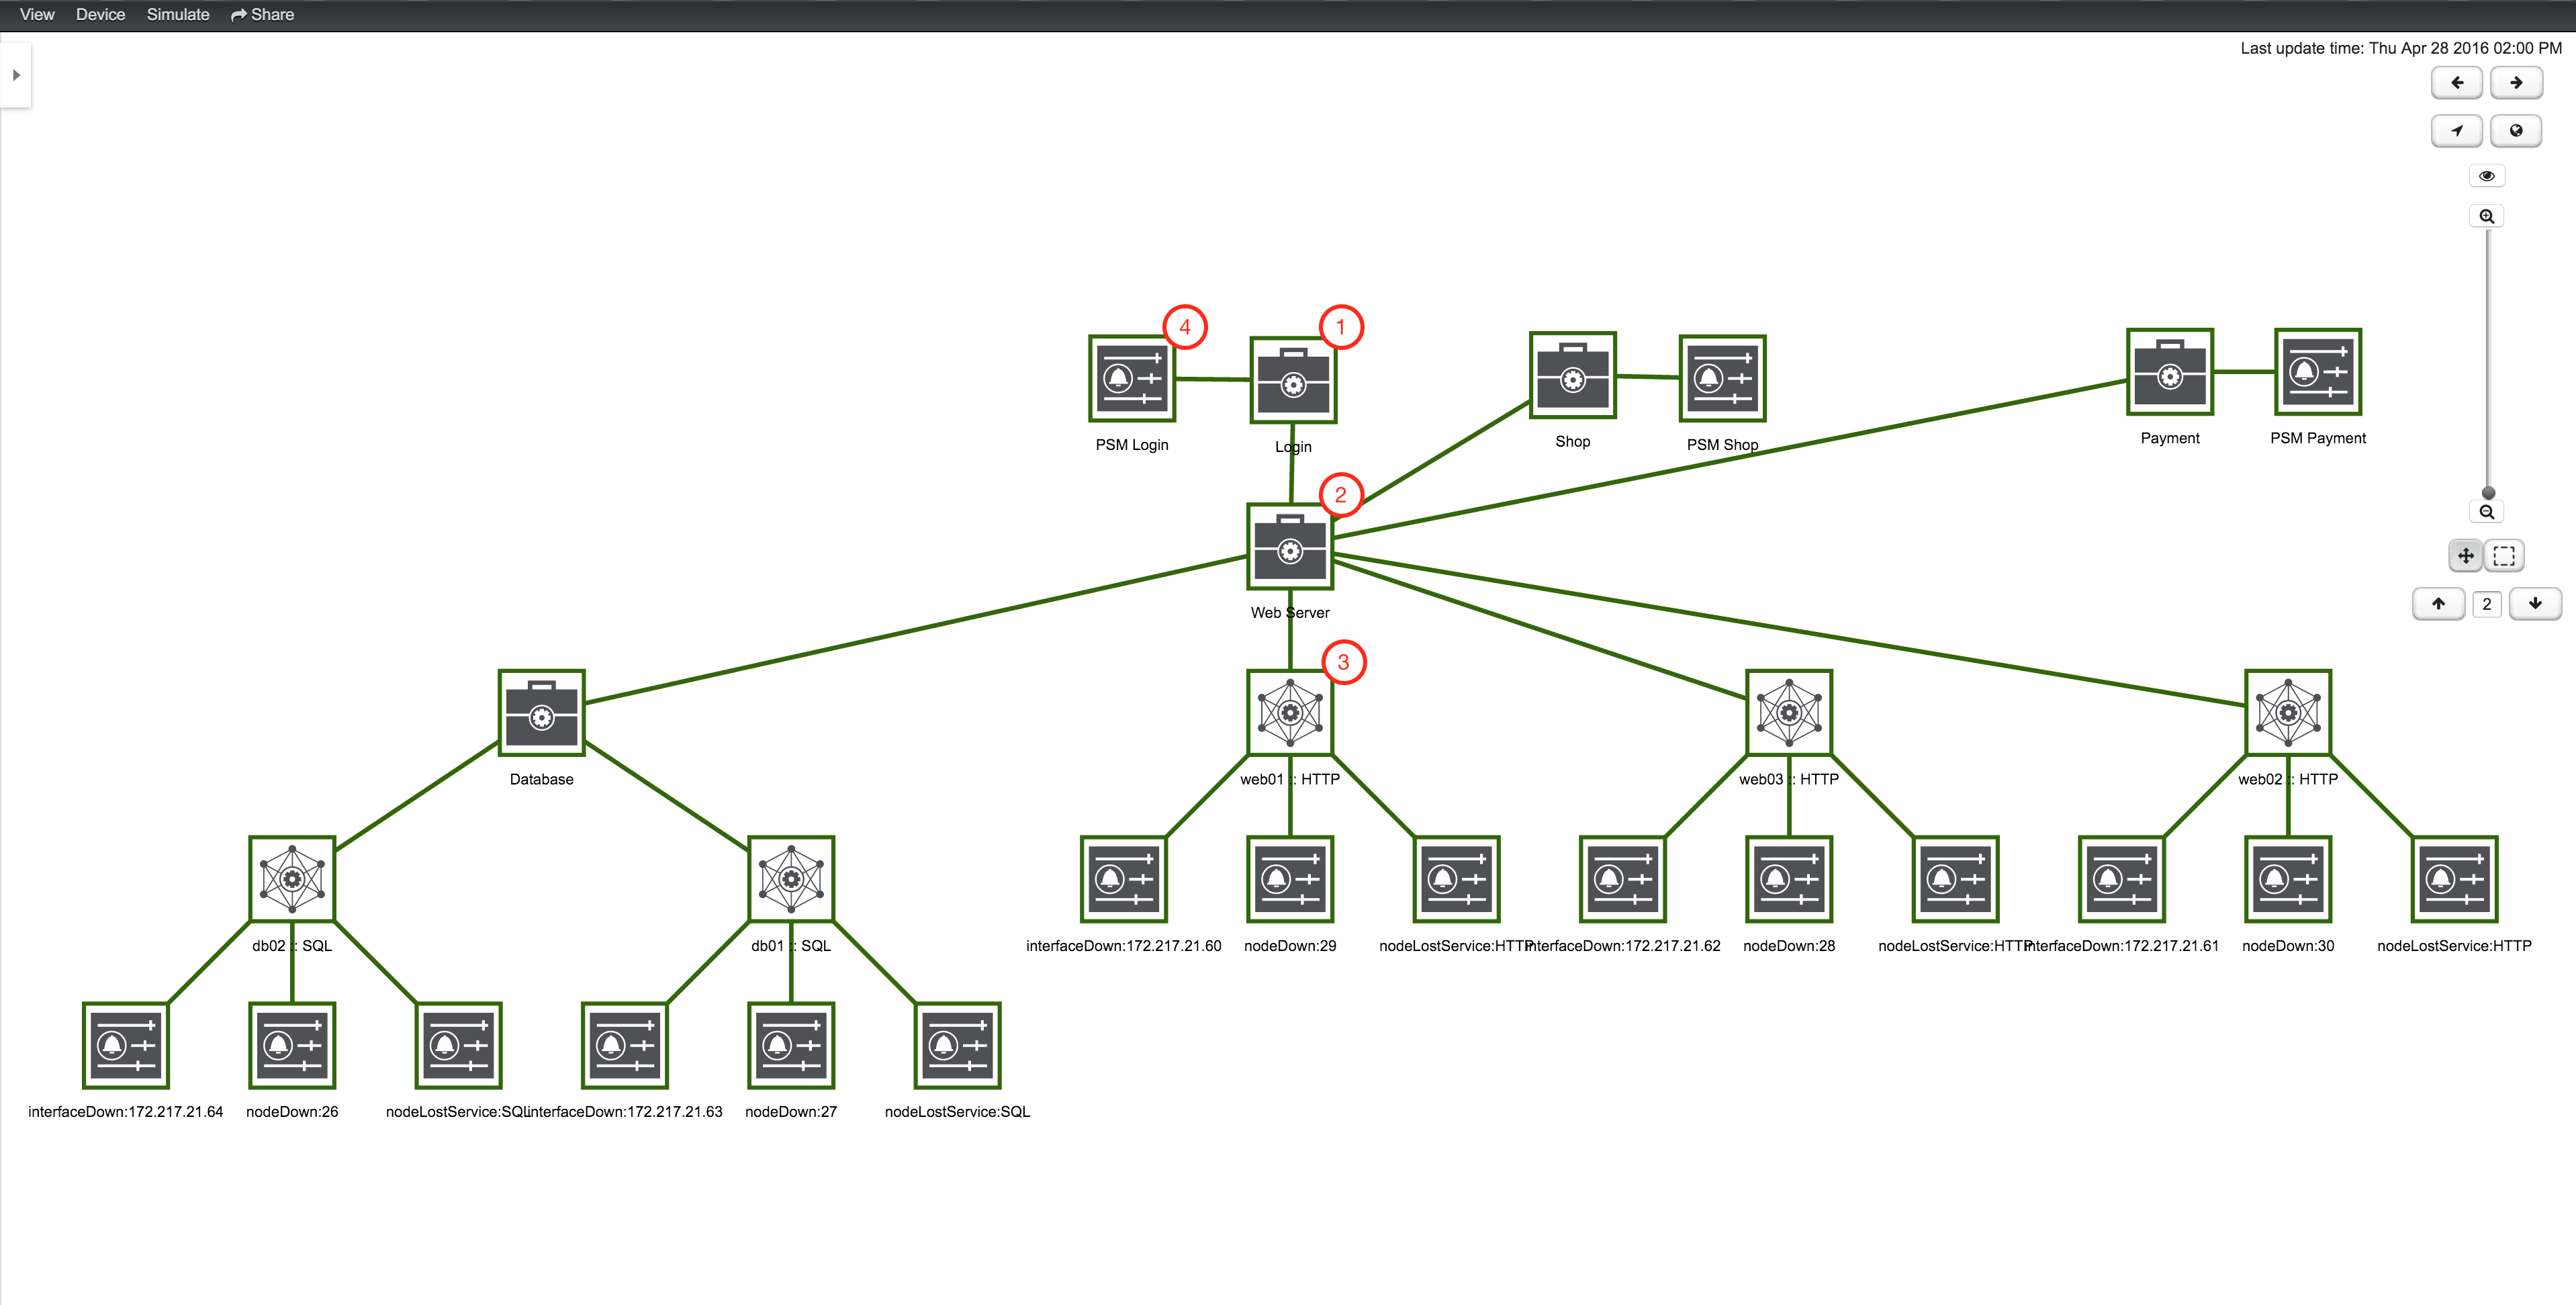
| 1 | A top-level Business Service which depends on other Business Services, Monitored Services and Alarms (referenced by Reduction Key) |
| 2 | Business Service as child an the Operational Status is used as input for the top-level Business Service |
| 3 | IP Service Edge used as an input with auto generated Reduction Keys for node down, interface down and node lost service |
| 4 | Reduction Key Edge used as an input to the top-level BS, which references just a node lost service of a Page Sequence Monitor for the user login |
To add or remove an additional selected BS or Edge to Focus use in the context menu Add To Focus or Remove From Focus. If you want to have a specific _BS or Edge as a single focus use Set as Focal Point. The Eye icon highlights all elements in the Topology UI which are set to Focus.
12.2. Operational status
Every Business Service maintains an Operational Status that represents the overall status calculated by the Map and Reduce Functions from the Edges. The Operational Status uses the Severities known from Events and Alarms.
| Name | Numerical code | Color / Code | Description |
|---|---|---|---|
|
7 |
Purple / |
This event means that a severe service affecting event has occurred. |
|
6 |
Red / |
Indicates serious disruption or malfunction of a service or system. |
|
5 |
Orange / |
Used for troubles that have not immediate effect on service or system performance. |
|
4 |
Yellow / |
An event has occurred that may require action. This severity can also be used to indicate a condition that should be noted (logged) but does not require immediate action. |
|
3 |
Dark green / |
Informational message. No action required. |
|
2 |
Grey / |
This severity is reserved for use in alarms to indicate that an alarm describes a self-clearing error condition has been corrected and service is restored. This severity should never be used in event definitions. Please use "Normal" severity for events that clear an alarm. |
|
1 |
Light green / |
No Severity could be associated with this event. |
If a Business Service changes its Operational Status an OpenNMS event of the type uei.opennms.org/bsm/serviceOperationalStatusChanged is generated and sent to the OpenNMS Event Bus.
In case the Operational Status changed from Normal to a higher Severity an Event of the type uei.opennms.org/bsm/serviceProblem is generated and has the Severity of the BS.
When the BS goes back to normal a Event of the type uei.opennms.org/bsm/serviceProblemResolved is generated.
| The Service Problem and Service Problem Resolved events can be used for notifications or ticketing integration. |
The log message of the events have the following information:
-
Business Service Name:
businessServiceName -
Business Service Identifier:
id -
Previous Severity Identifier:
prevSeverityId -
Previous Severity Label:
prevSeverityLabel -
New Severity Identifier:
newSeverityId -
New Severity Label:
newSeverityLabel
| The BSM events are not associated to a Node, Interface or Service. |
12.3. Root Cause and Impact Analysis
The Root Cause operation can be used to quickly identify the underlying Reduction Keys as Edges that contribute to the current Operational Status of an element. The Impact Analysis operation, converse to the Root Cause operation, can be used to identify all of the BS affected by a given element. Both of these options are available in the context menu of the Topology User Interface when visualizing BS.
The following example shows how to identify the Root Cause of the critical status of the Shop service. Use the Context Menu on the BS to investigate the Root Cause shown in figure View before performing Root Cause Analysis.
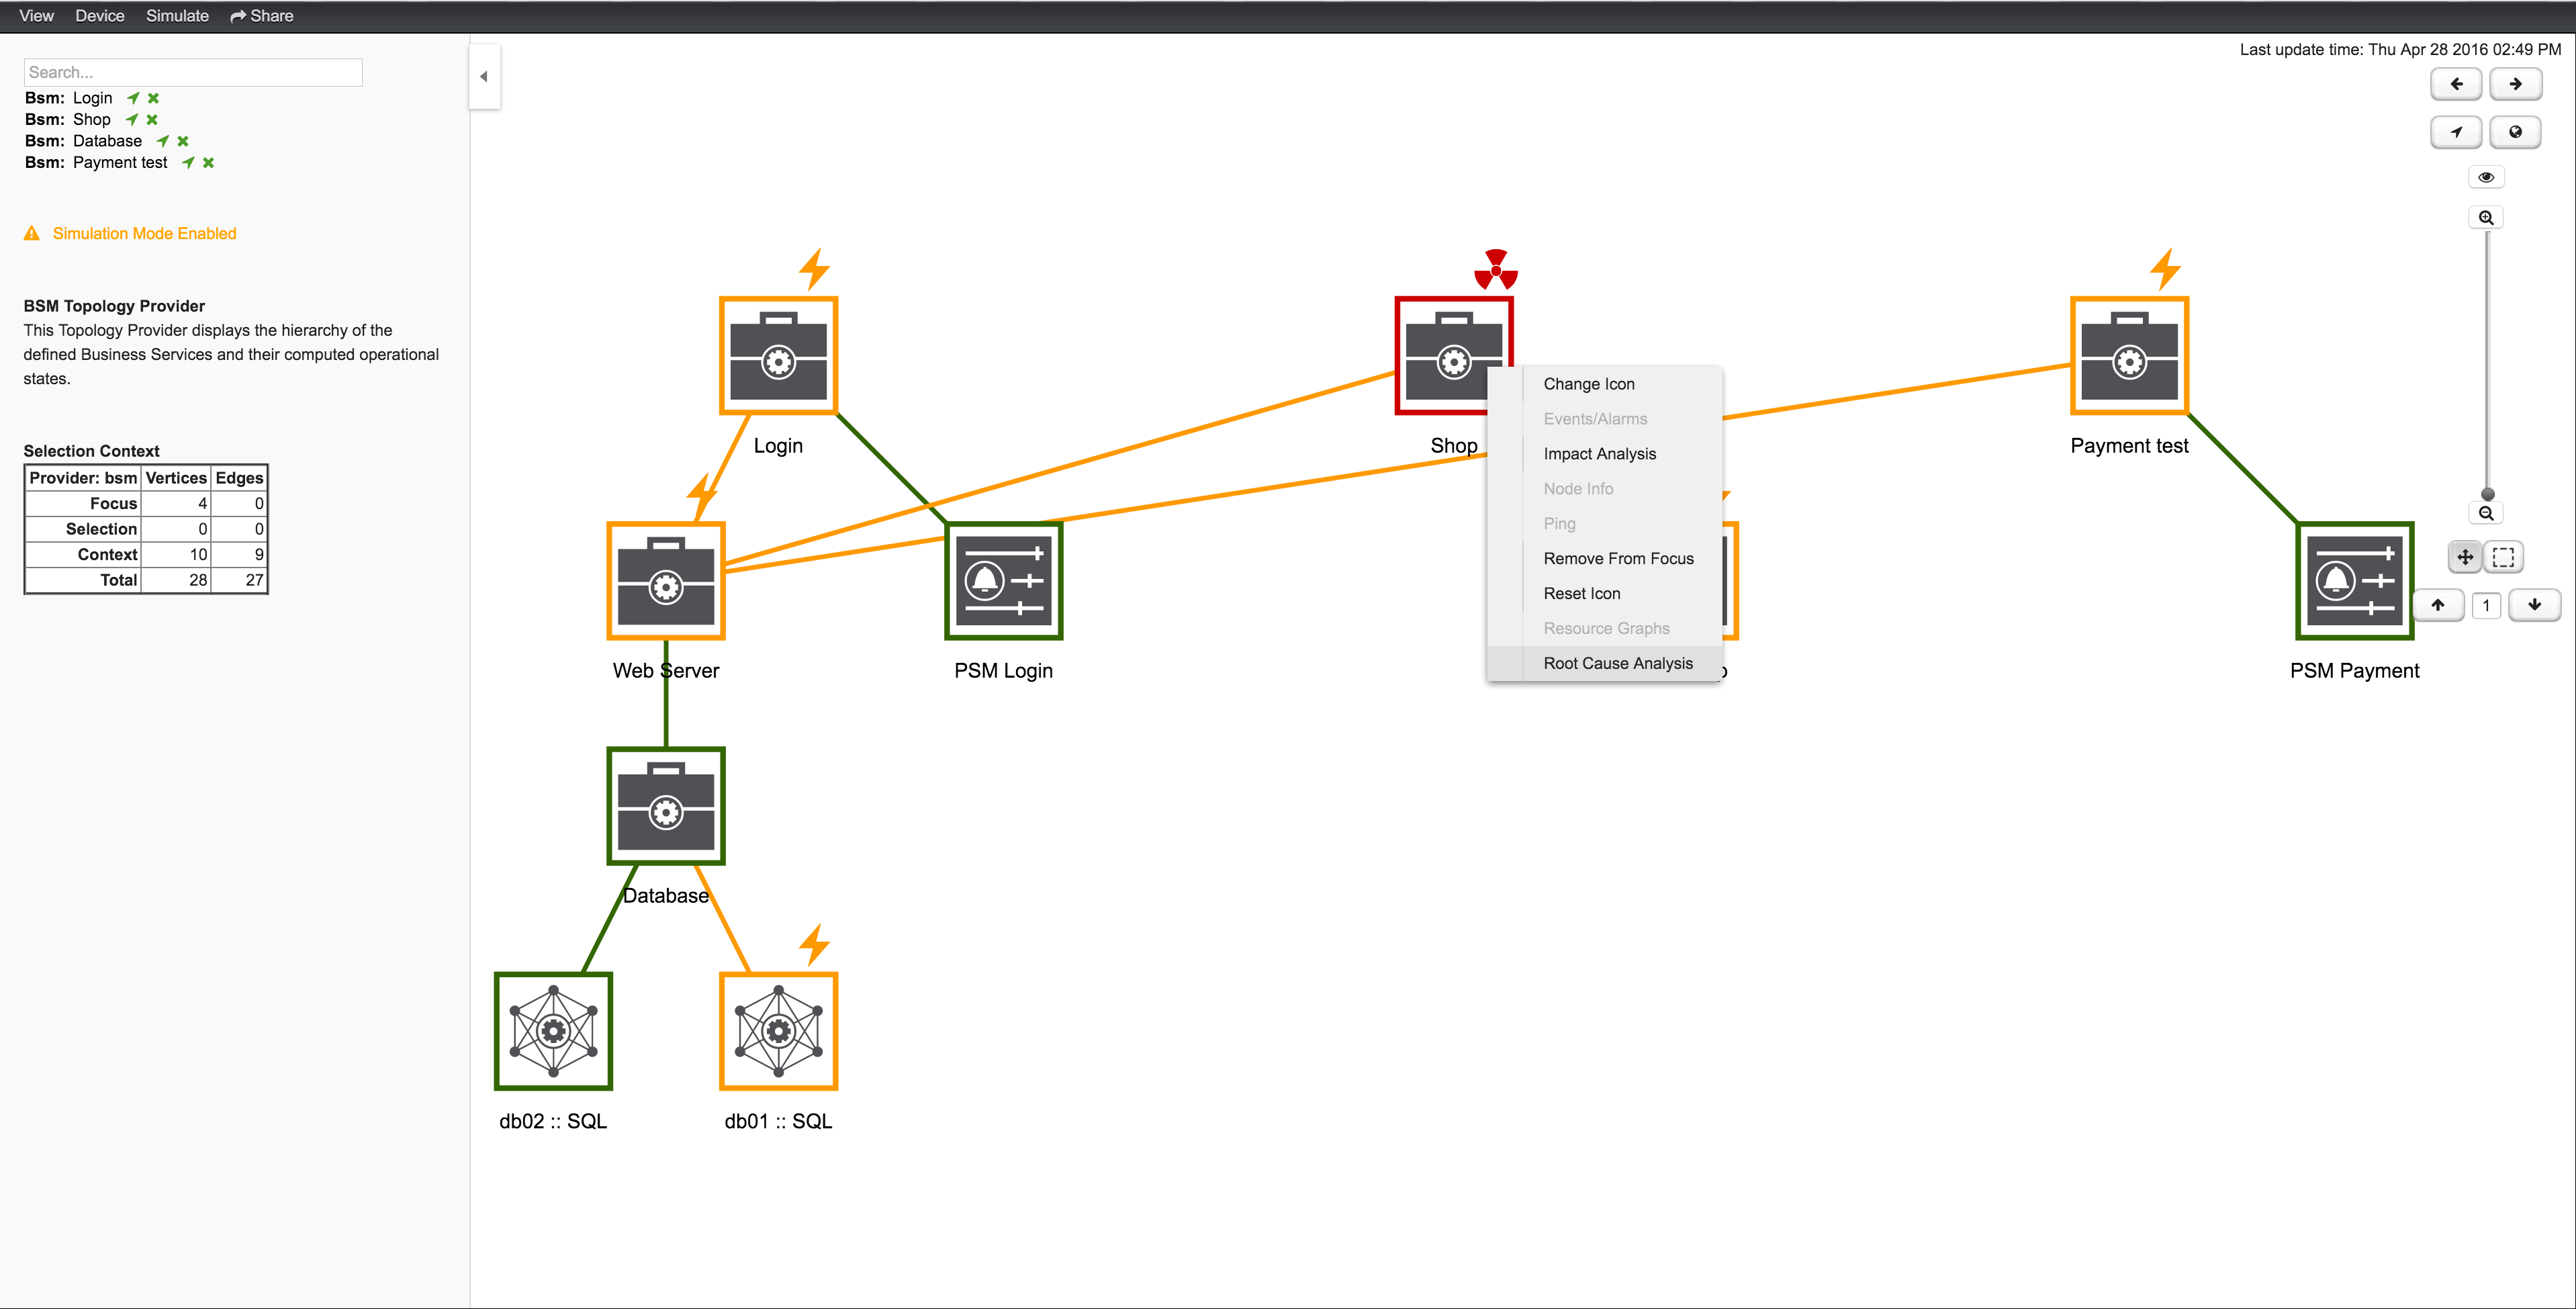
The Topology UI sets only elements to Focus which are the reason for the Operational Status of the selected BS. In figure View after performing Root Cause Analysis the Page Sequence Monitor which tests the user login is down and has set the BS to a critical status.
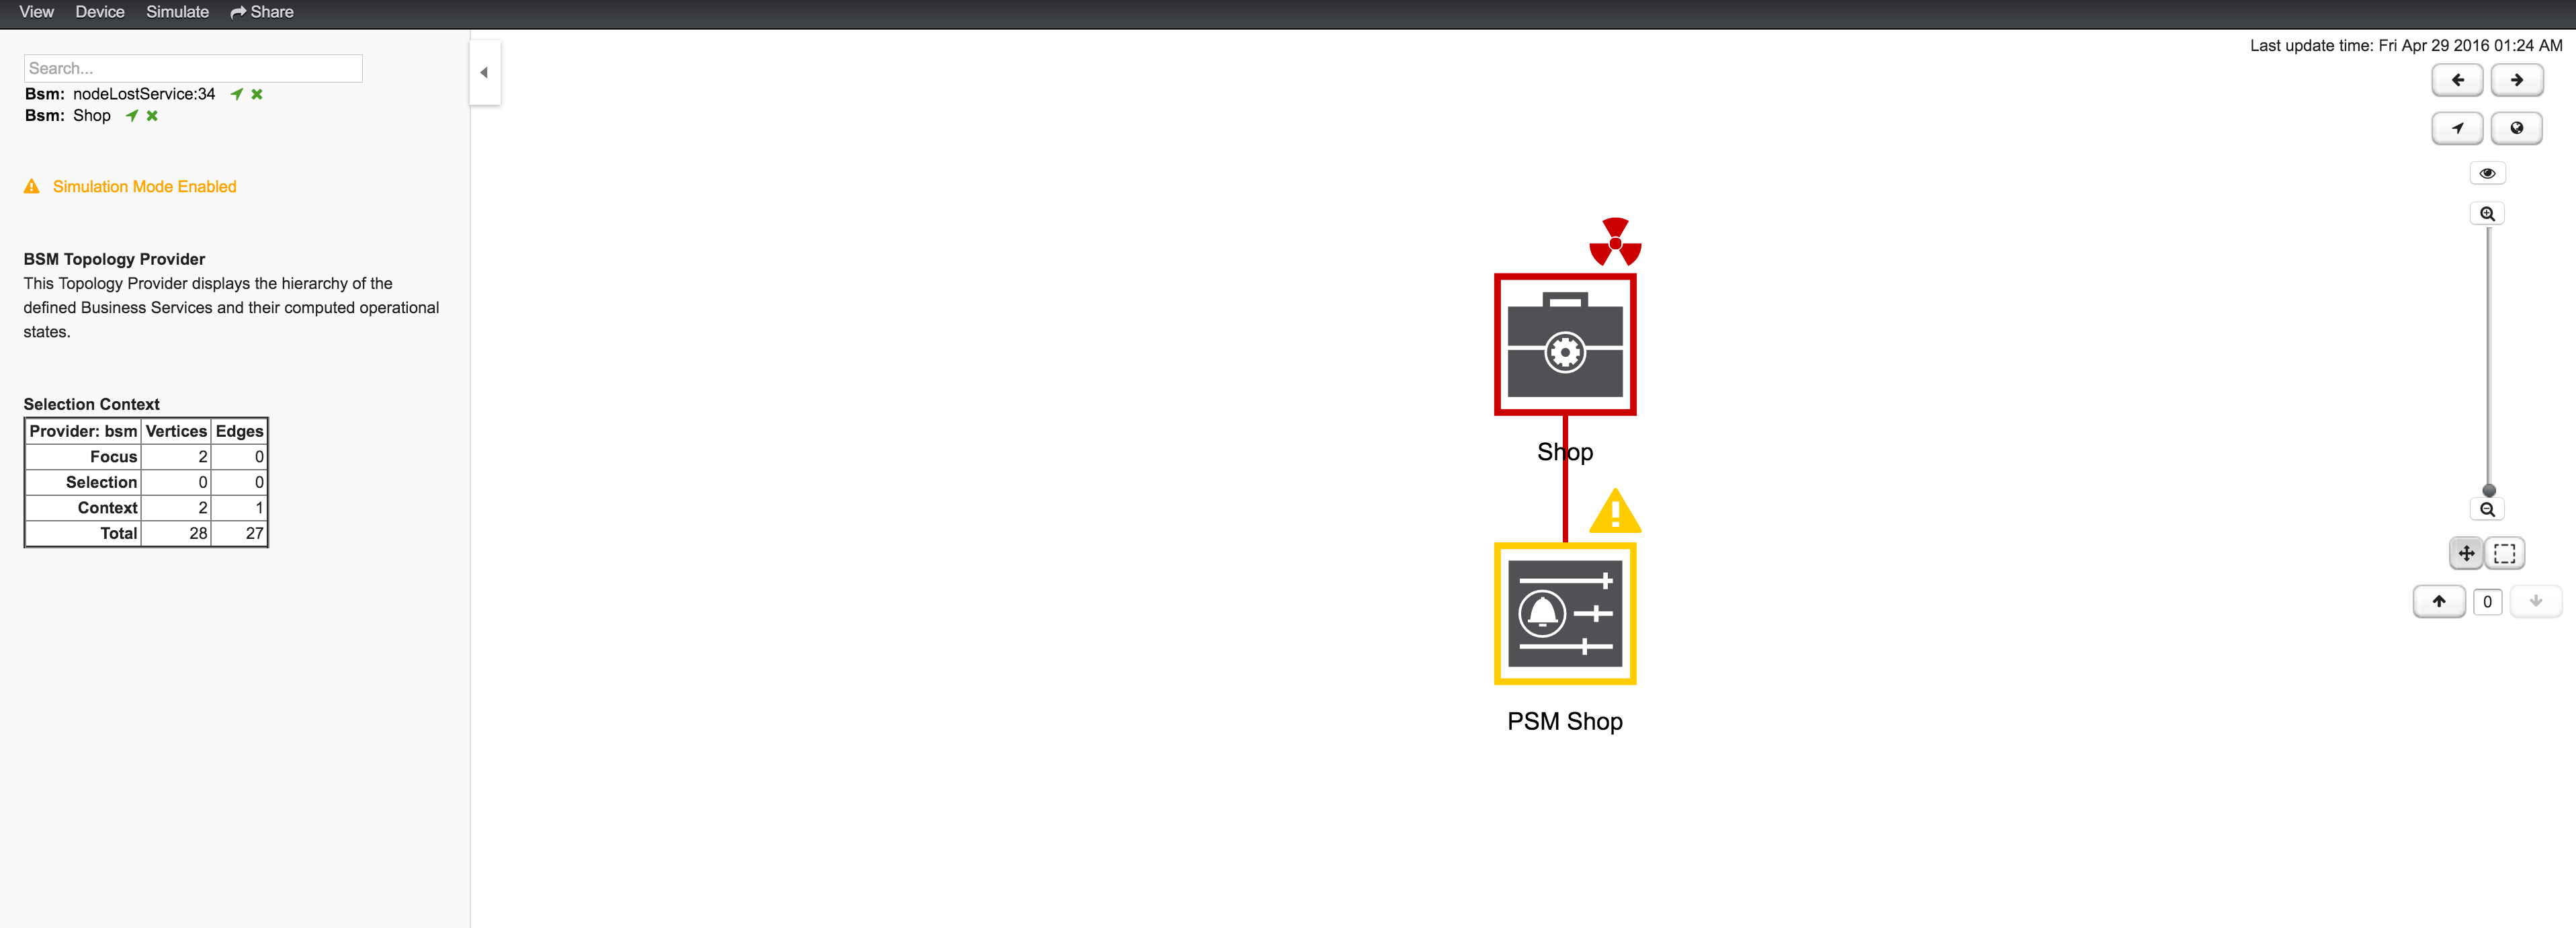
Similar to identifying a root cause for a BS it is also possible to identfy which Business Services from a specific Edge are affected. Use the Context Menu on a specific Edge element and select Impact Analysis shown in figure View before performing Impact Analysis.
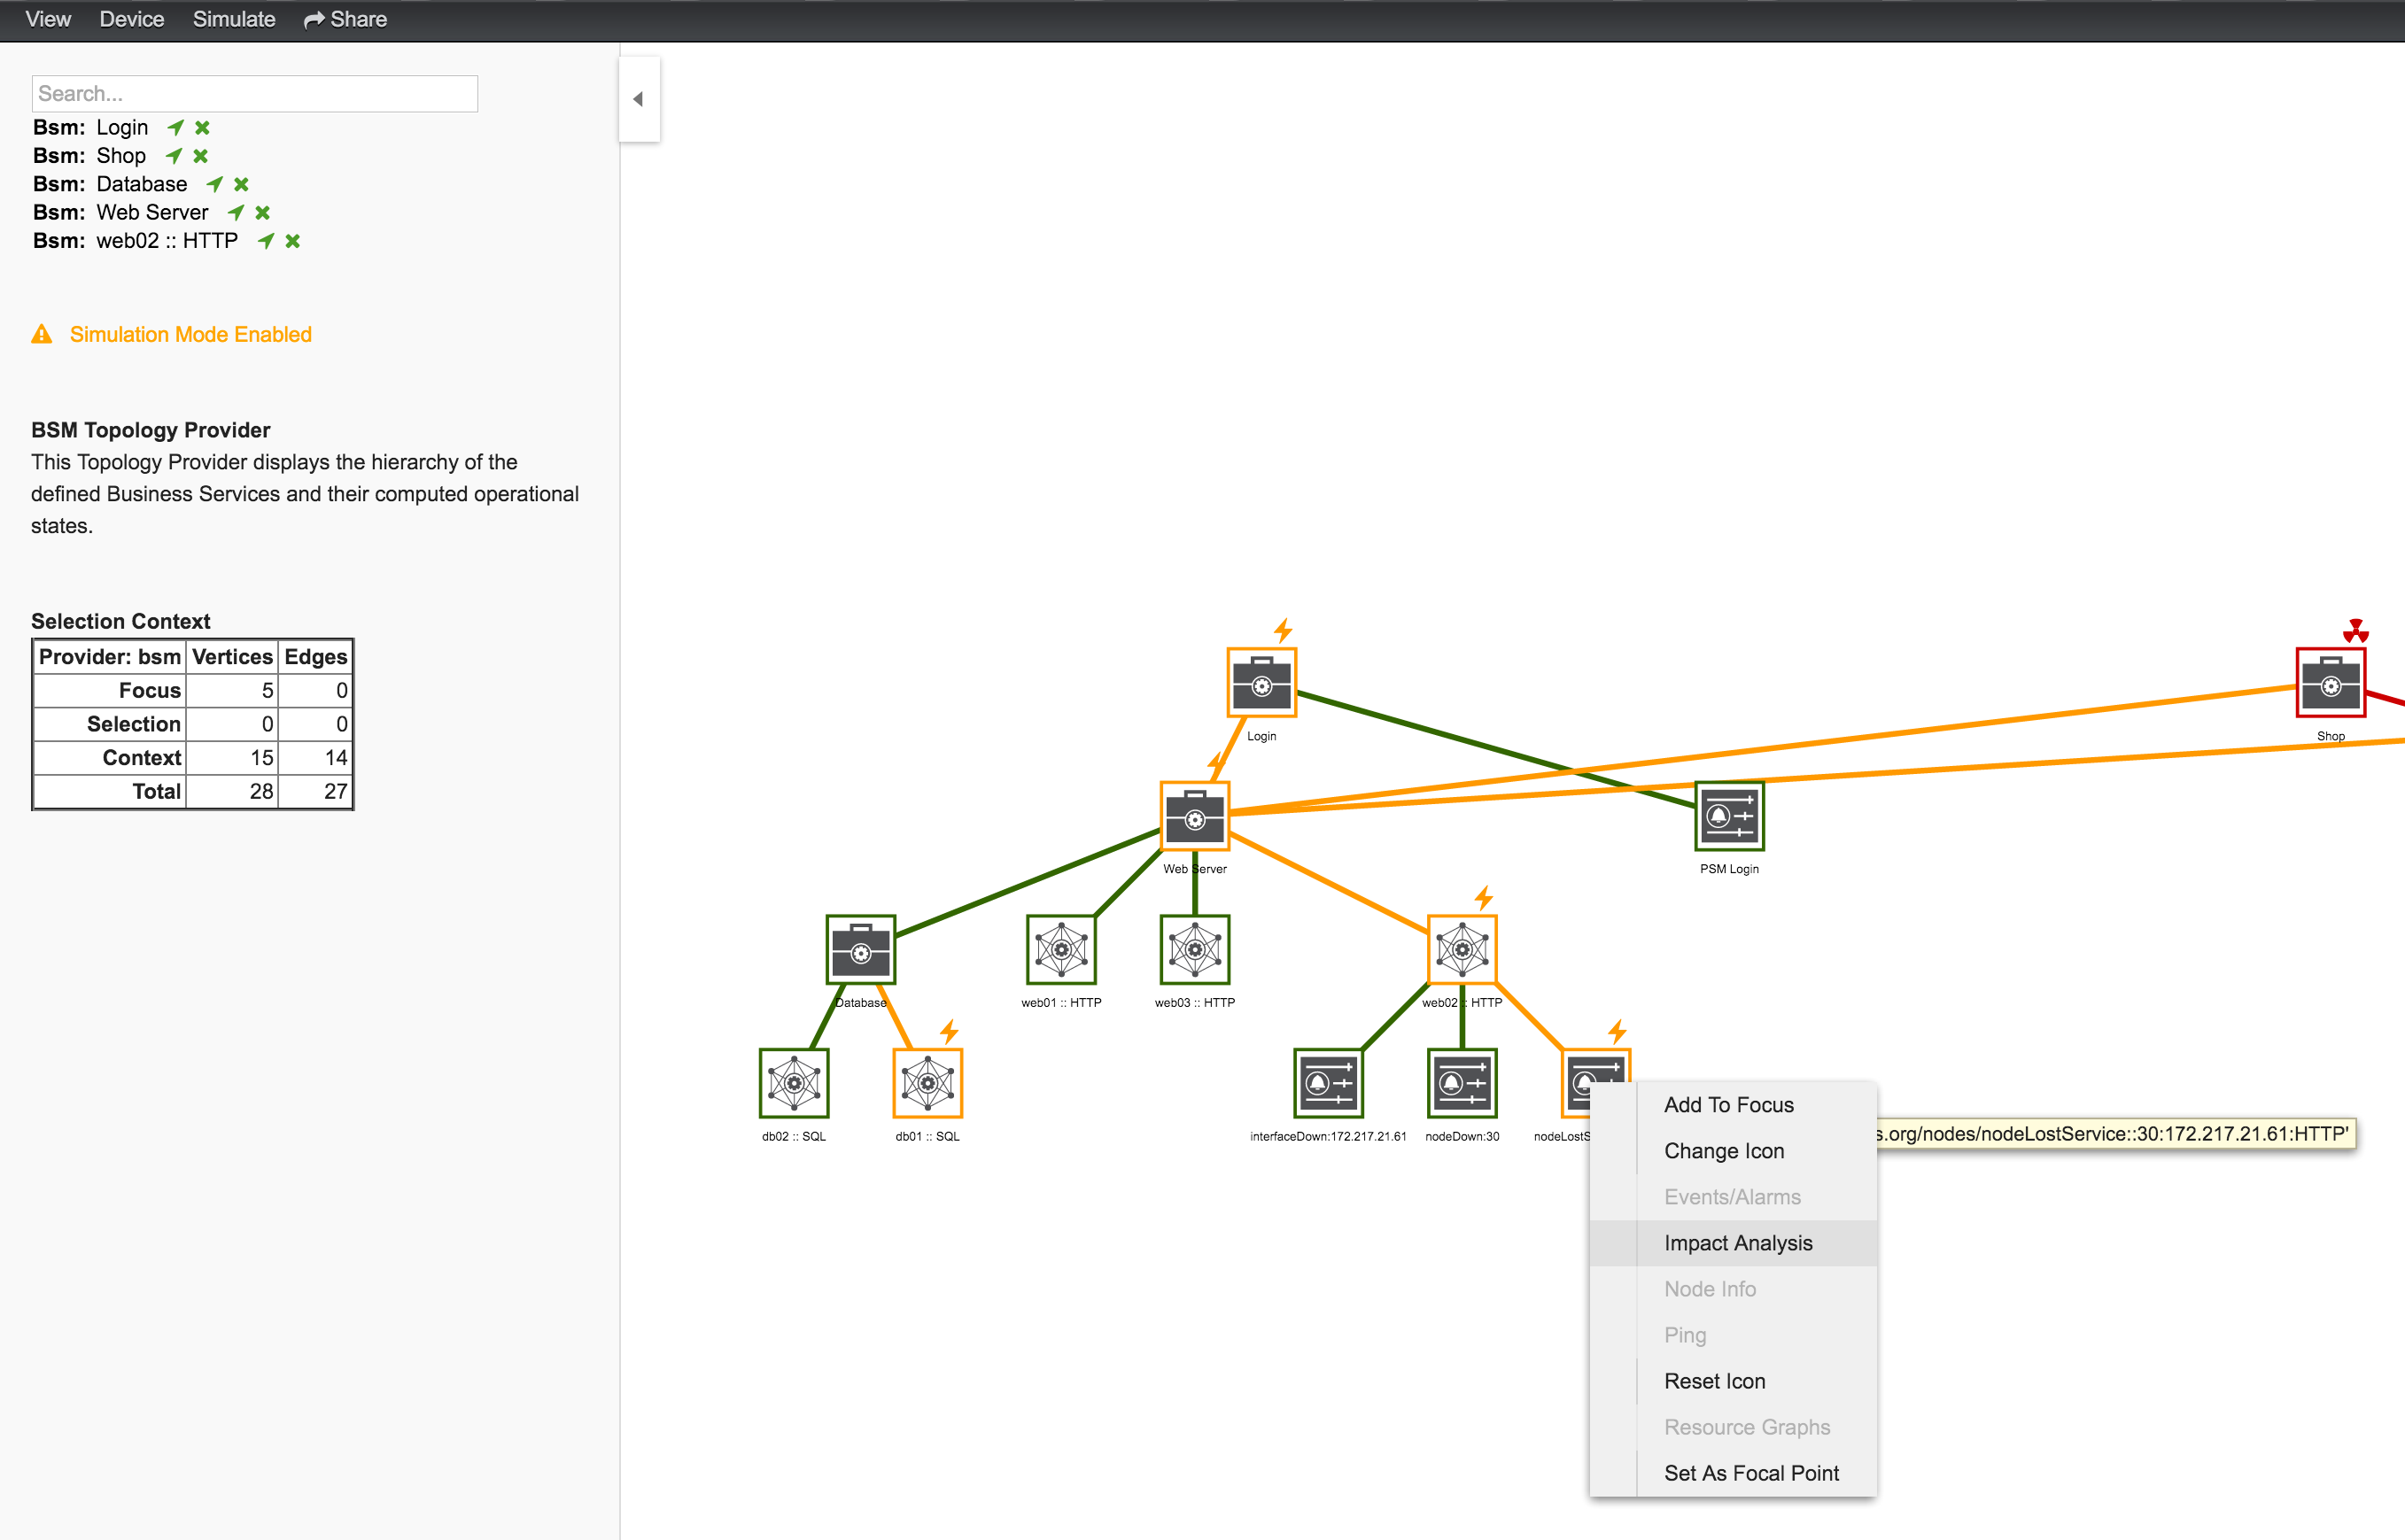
In figure View after performing Impact Analysis the Business Services for Login, Shop and Payment are affected if this HTTP service is unavailable.
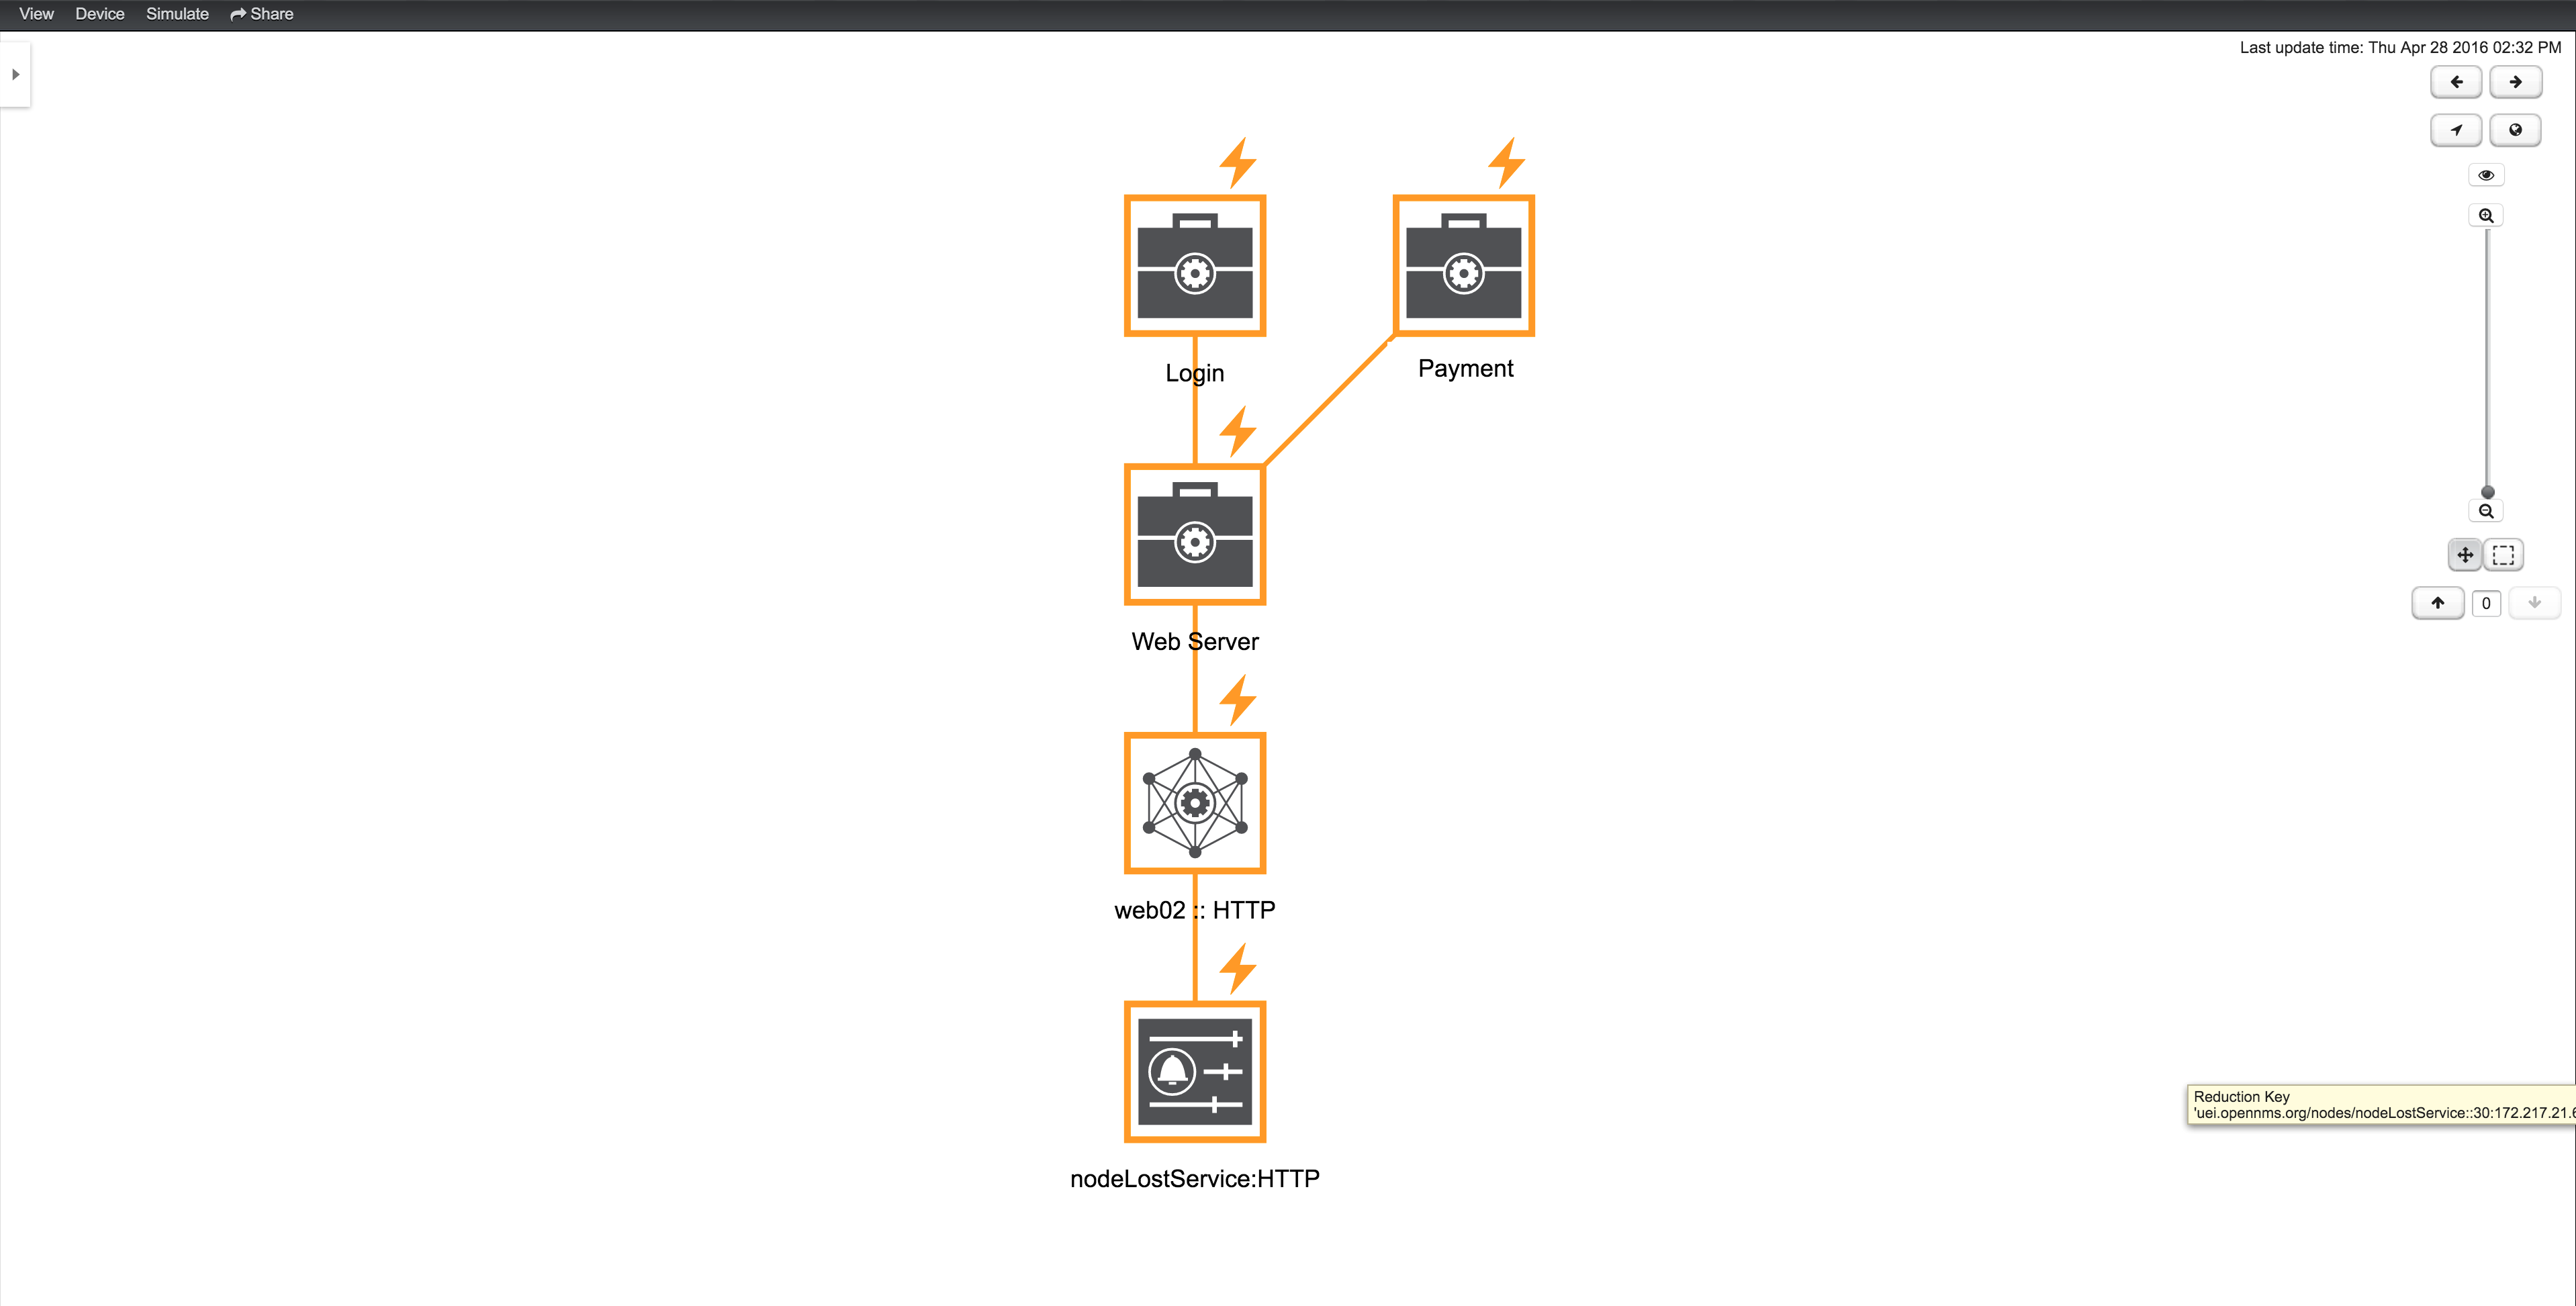
| For the reason the service PSM Shop is introducing the critical status for the Business Service Shop, the HTTP service has no impact on the Operational Status of the PSM Shop and is not shown. |
12.4. Simulation Mode
To visualize if the configured behavior works as expected, the Simulation Mode can be used to manually set an Alarm status of an Edge element. The Operational Status is calculated with the given Map and Reduce Functions. This allows users to validate and tune their Business Service Hierarchies until the desired status propagation is achieved.
In order to enter Simulation Mode, open the Business Service View in the Topology User Interface and toggle the Simulation Mode option in the Simulate menu at the top of the screen. The Info Panel on the left hand side allows to set the Severity of the selected Edge element. In figure BSM Simulation Mode the Menu and Severity setting is shown.
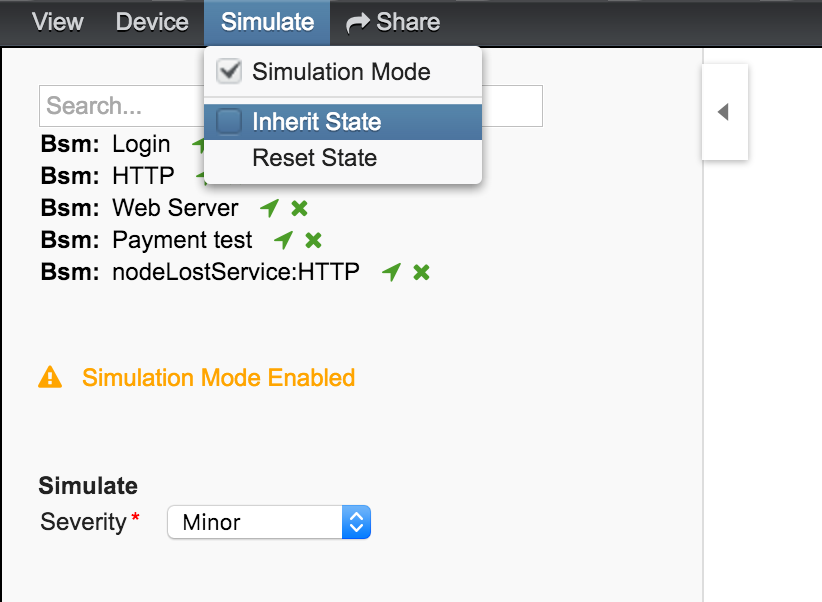
| The Info Panel can be hidden with the Arrow button in the top left corner. |
In the Simulate menu there are Inherite State and Reset State as options available. With Inherite State the current Severities and Operational Status from monitoring is used for the Simulation Mode. By selecting Reset State all states will be set to Normal for simulation.
12.5. Share View
In some cases it is useful to share a specific view on a Business Service Hierarchy. For this reason the menu function Share can be used and generates a link for the current view and can be copied and sent to another user. In figure Share Business Service View the Share menu item was used and a link is generated. The link can be used with Copy & Paste and sent to another user to have access to exactly the same configured _Business Service View.
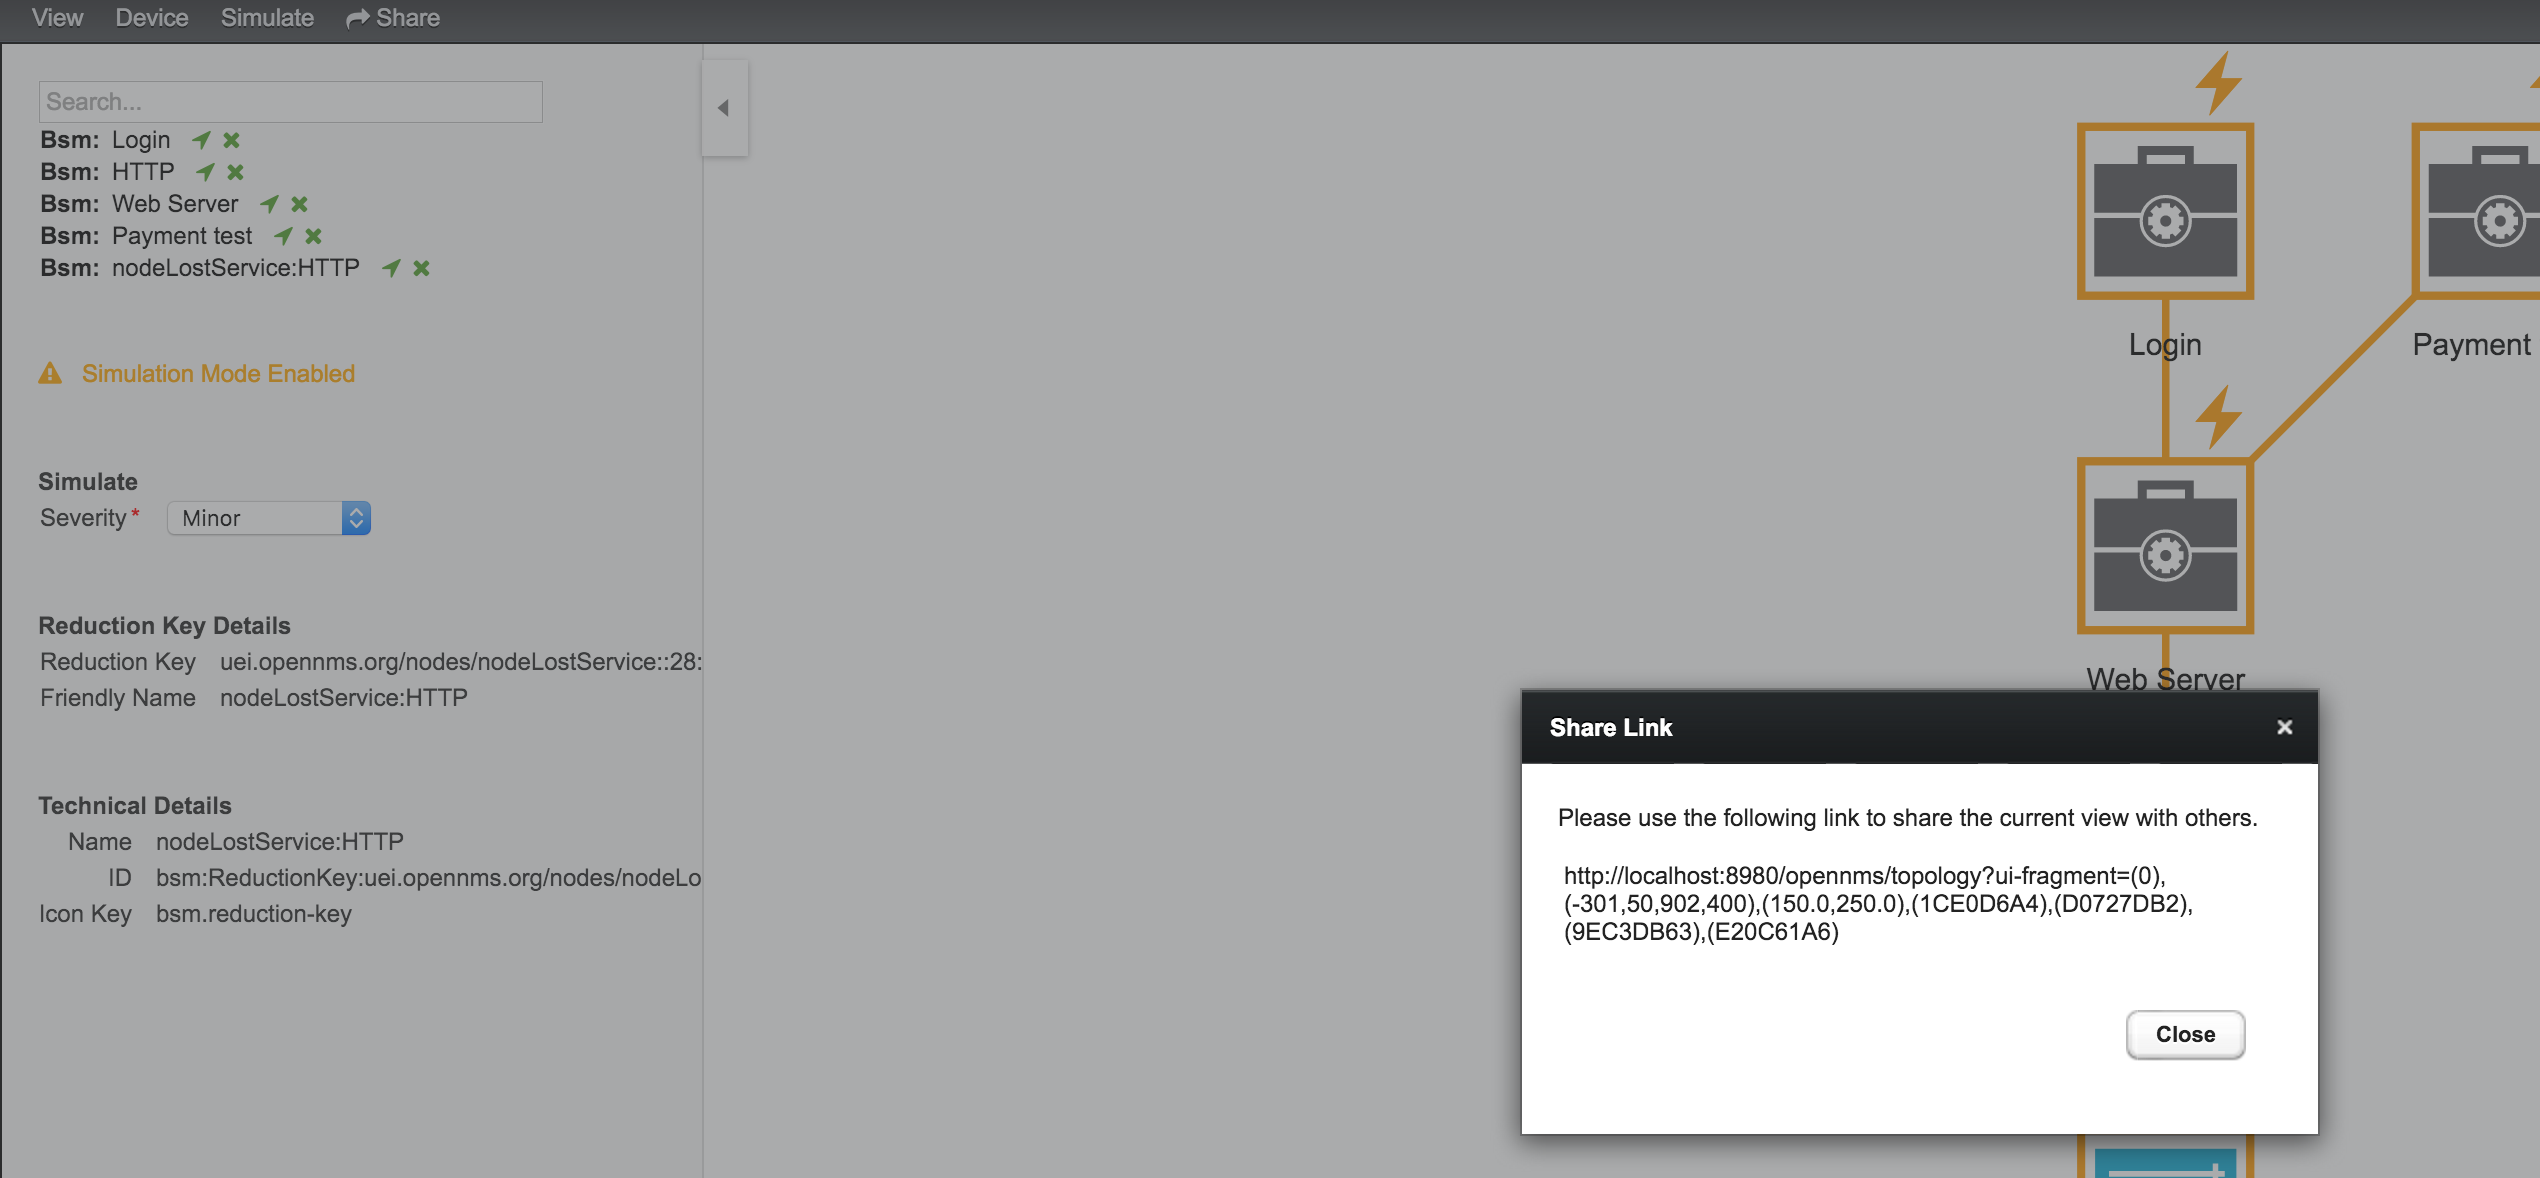
| The user receiving the link needs an account in OpenNMS to be able to see the Business Service View. |
12.6. Change Icons
Each element in the Business Service View has an icon which is assigned to a BS or an Edge. To be able to customize the Business Service View the icons for each element can be changed. Select the element in the Business Service View and choose Change Icon from the Context Menu. As shown in figure Change Icon for Business Service or Edges select the the new icon for the selected element and click Ok to permanently assign the new icon to the element.
![]()
It is also possible create custom Icon Sets which is described in the Business Service Monitoring section of the Developer Guide.
12.7. Business Service Definition
The status of Service Monitors and any kind of Alarm can be used to drive the Operational Status of a BS. A BS is defined with the following components:
-
Business Service Name: A unique name used to identify the BS
-
Edges: A set of elements on which this BS relies which can include other BS, or Reduction Keys.
-
Reduce Function: Function used to aggregate the Operational Status from all the Edges. Specific functions may take additional parameters.
-
Attributes: Optional key/value pairs that can be used to tag or enrich the Busines Service with additional information.
Each Business Service can contain a list of optional key/value attributes. These can be used to identify or tag the BS, and may be reference in other workflows. These attributes do not affect the dependencies or the status calculation of the BS.
| Attributes can be used to filter BS in Ops Board dashlets. |
The Business Service Editor is used to manage and model the Business Services and their hierarchy. It is required to have administrative permissions and is available in "Login Name → Configure OpenNMS → Manage Business Services" in the Service Monitoring section.
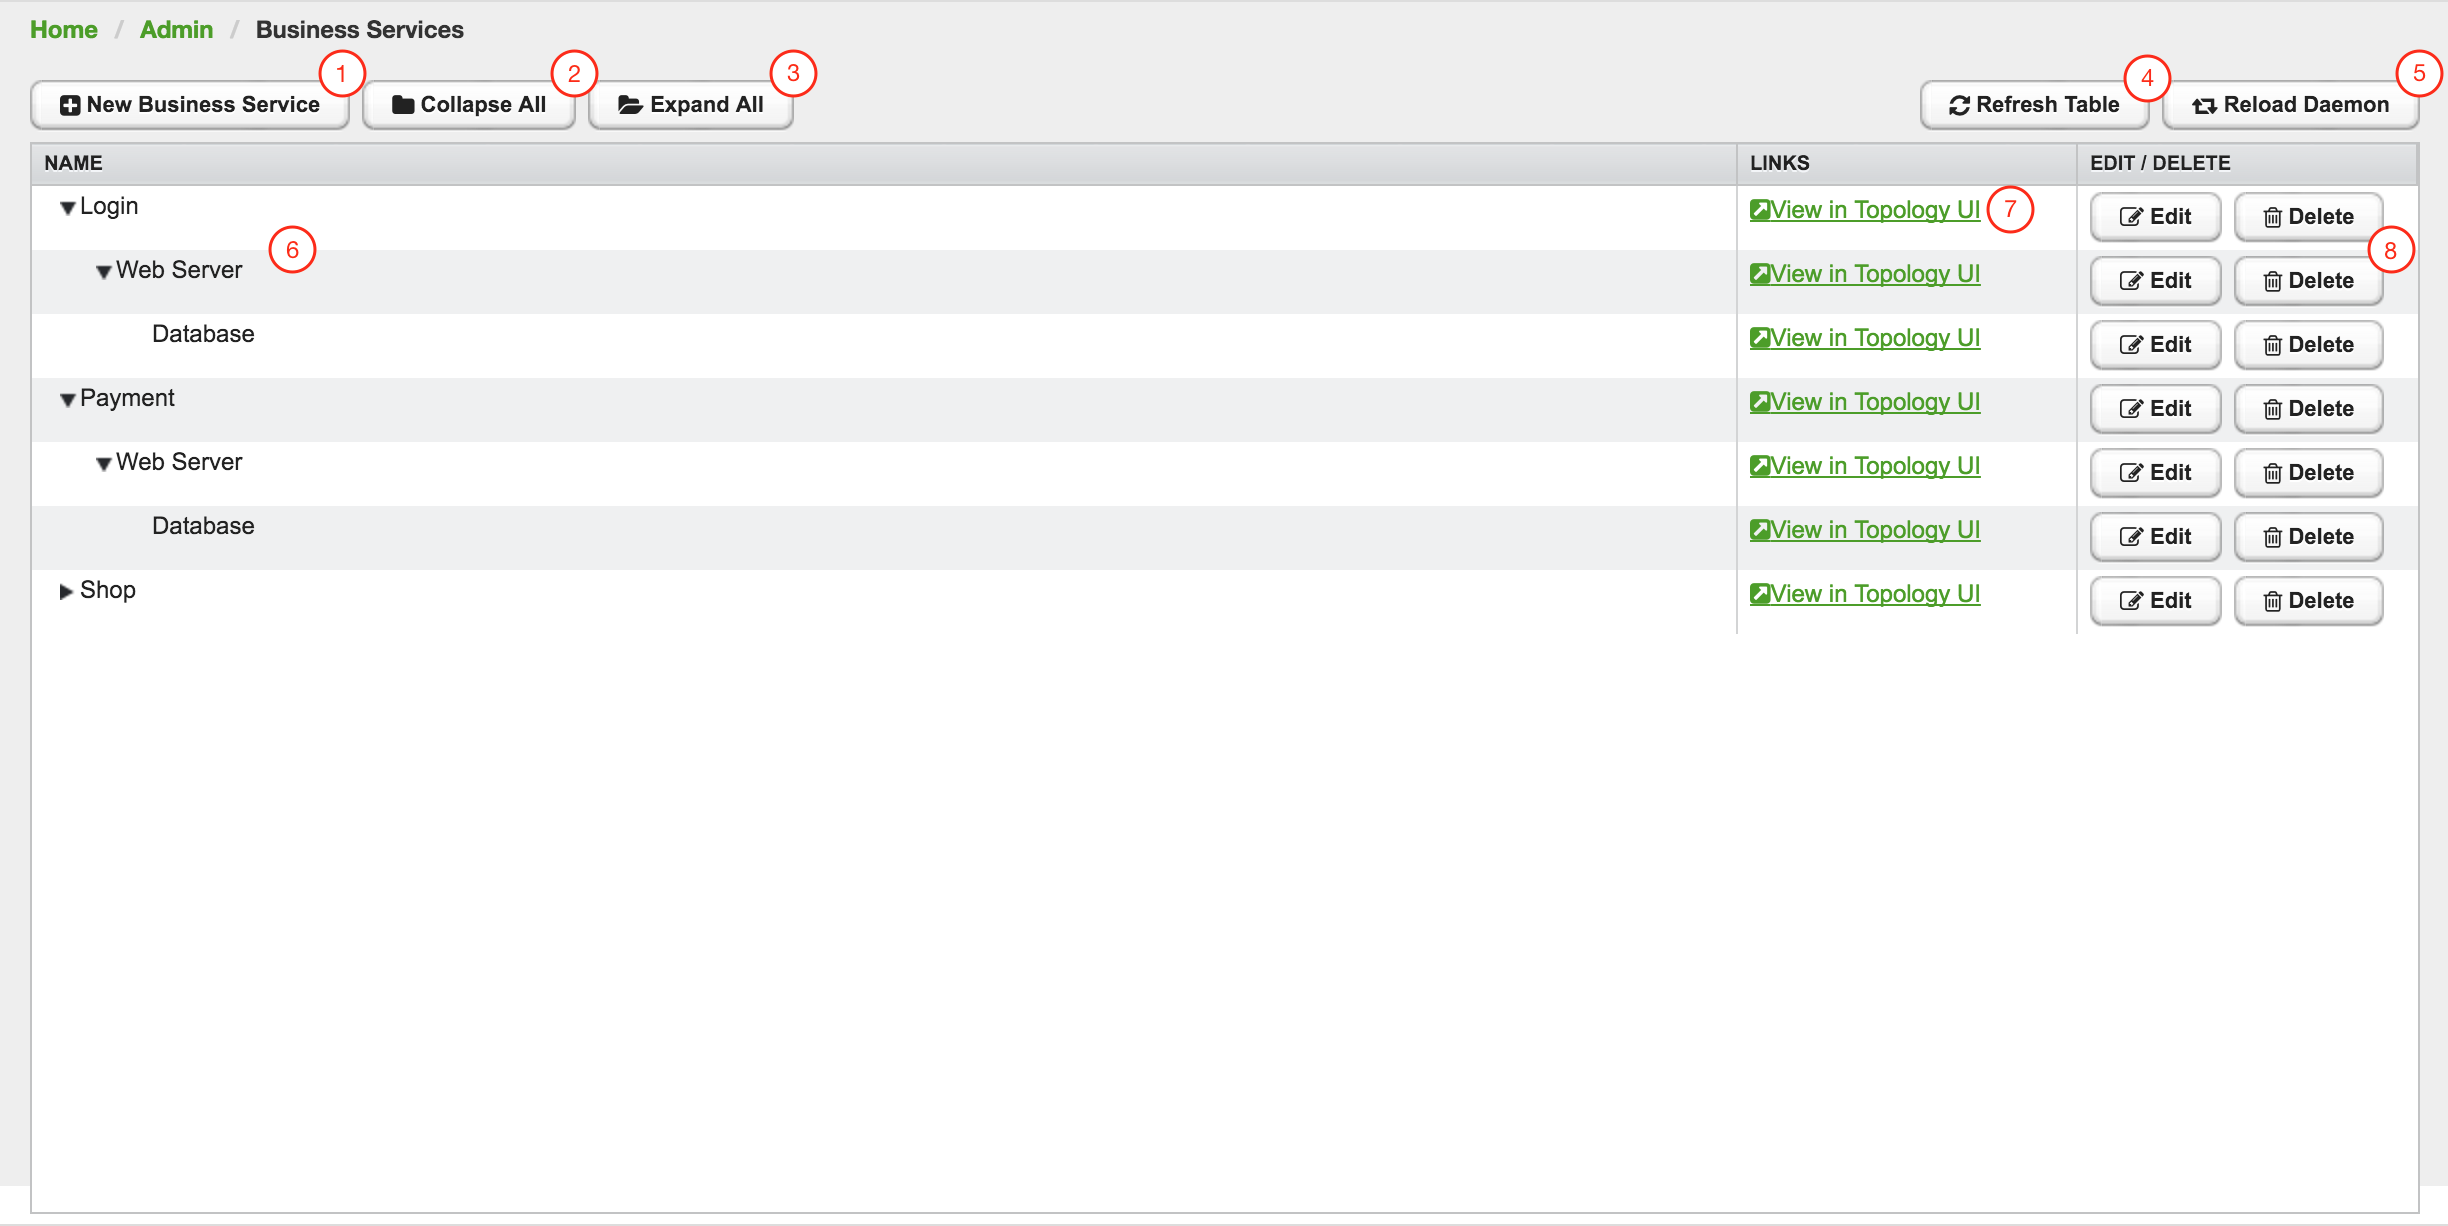
| 1 | Create a new Business Service definition |
| 2 | Collapse tree view for all Business Services in the view |
| 3 | Expand tree view for all Business Services in the view |
| 4 | Reload all Business Services in the view with current Business Services from the system |
| 5 | Reload the Business Service Monitoring Daemon to use the Business Service definition as configured |
| 6 | Business Service dependency hierarchy as tree view |
| 7 | Show the current Business Service with dependencies in the Topology UI |
| 8 | Edit and delete existing Business Service defintions |
As shown in figure Managing Business Services with the Business Service Editor the Business Services can be created or changed. The hierarchy is created by assigning an existing Business Service as Child Service.
12.8. Edges
Edges map the Alarm status monitoring with OpenNMS
The following types can be used:
-
Child Service: A reference to an existing Business Service on which to depend
-
IP Service: A convenient way to refer to the alarms that can be generated by a monitored IP Service. This will automatically provided edges for the nodeLostService, interfaceDown and nodeDown reductions keys of the specified service.
-
Reduction Key: A resolved Reduction Key used to refer to a specific Alarm, e.g. generated by a SNMP Trap or Threshold violation
-
Application: A reference to an existing application. This will automatically provide edges for the nodeLostService, interfaceDown and nodeDown reductions keys of the defined services of this application.
| If you need help determining the reduction key used by alarm, trigger the alarm in question and pull the reduction key from the Alarm details page. |
All edge types have the following parameters:
-
Map Function: The associated Map Function for this Edge
-
Weight: The relative Weight of this edge. Used by certain Reduce Functions.
Both IP Service and Reduction Key type edges also support a Friendly Name parameter which gives the user control on how the edge is labeled in the Topology User Interface. The editor changing the Edge attributes is shown in figure Editor to add Business Service Edges.
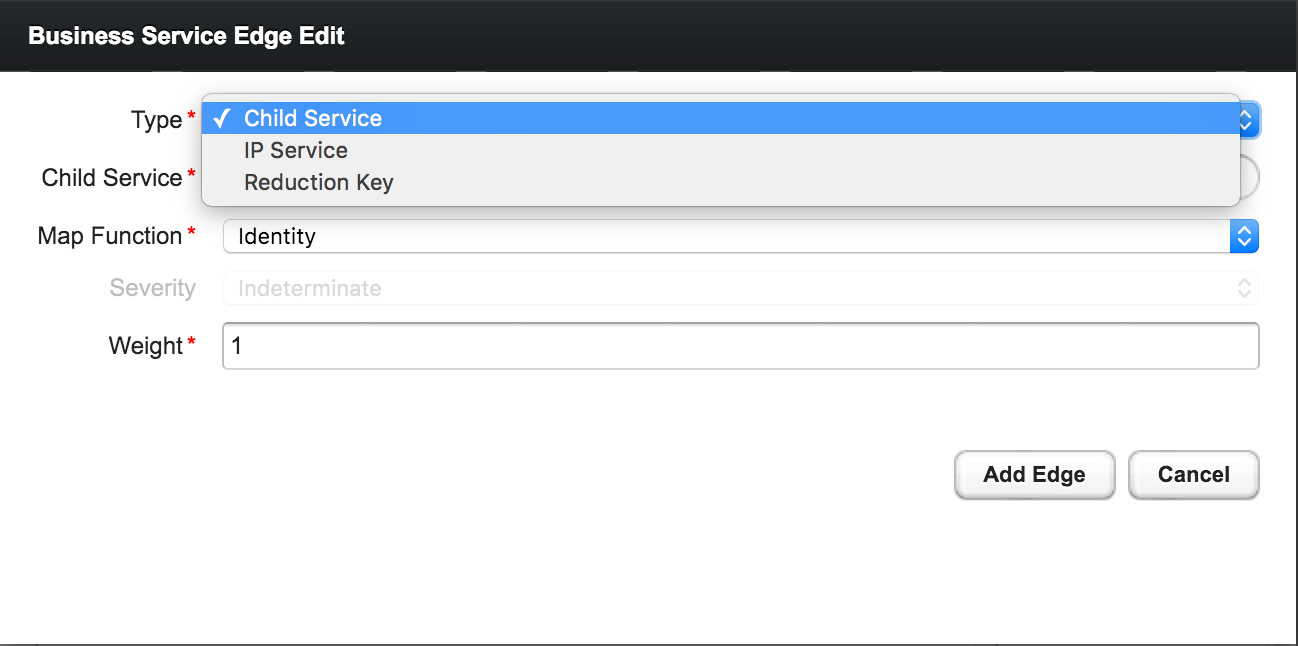
12.8.1. Child Services
To create a hierarchy of Business Services they need to be created first. The hierarchy is build by selecting the Business Service as_Child Service_ as dependency.
12.8.2. IP Services
The IP Service is a predefined set of Reduction Keys which allows easily to assign a specific Monitored Service to the given BS. As an example you have multiple Servers with a Monitored Service SMTP and you want to model a BS named Mail Communication. If just the Reduction Key for a nodeLostService is assgined, the BS would not be affected in case the IP Interface or the whole Node goes down. OpenNMS generates Alarms with different UEI which needs to be assigned to the BS as well. To make it easier to model this use case the IP Service generates the following Reduction Keys automatically:
-
uei.opennms.org/nodes/nodeLostService:%nodeId%:%ipAddress%:%serviceName%: Matches Alarms when the given Monitored Service goes down -
uei.opennms.org/nodes/interfaceDown:%nodeId%:%ipAddress%: Matches Alarms when the given IP Interface of the Monitored Service goes down -
uei.opennms.org/nodes/nodeDown:%nodeId%: Matches Alarms when the given Node of the Monitored Service goes down
12.8.3. Custom Reduction Key
The Reduction Key edge is used to refer to specific instance of alarms.
When an alarm with the given Reduction Key is present, the alarms' severity will be used to calculate the Operational Status of the BS.
To give a better explanation a Friendly Name can be set and is used in the Business Service View.
The format of the Reduction Key is build by a set of attributes as a key separated by : and enclosed in %, i.e (%attribute%:%attribute%).
%uei.opennms.org/nodes/nodeLostService%:%nodeId%:%ipAddress%:%serviceName%12.8.4. Application
Already defined Applications can be used in Business Service topologies. An Application itself defines a set of Monitored Services - each of these generate nodeLostService, interfaceDown and nodeDown reduction keys automatically.
12.9. Map Functions
The Map Functions define how the Severity of the edge will be used in the Reduce Function of the parent when calculating the Operational Status.
The available Map Functions are:
| Name | Description |
|---|---|
|
Use the same Severity as Operational Status of the BS |
|
Increase the Severity by one level and use it as Operational Status of the BS |
|
Decrease the Severity by one level and use it as Operational Status of the BS |
|
Set the Operational Status to a constant Severity value |
|
The input of the Edge is ignored for Operational Status calculation |
12.10. Reduce Functions
A Reduce Function is used to aggregate the Operational Status for the BS. The Alarm Severity from the Edges are used as input for the Reduce Function. For this operation the following Reduce Functions are available:
| Name | Description |
|---|---|
|
Uses the value of the highest severity, Weight is ignored. |
|
Uses the highest severity found more often than the given threshold, e.g. 0.26 can also be seen as 26%, which means at least 2 of 4 Alarms need to be raised to change the BS. |
|
Uses the highest severity greater than the given threshold severity. |
|
This reduce function computes the sum of the given child severities based on a base number. For this computation the severities are mapped to numbers: \$WARNING=0, MINOR=1, MAJOR=2, CRITICAL=3\$ All other severities are ignored. For the aggregation the following formula will be used to compute the resulting Business Service severity from its n child entities based on the base number b: \$severity = |__log_{b}( sum_(i=1)^n b^(ch\ildSeverity_{i}) )__|\$ In summary the base value defines how many items of a severity x will result in a severity x+1. Results lower as 0 are treated as NORMAL and results higher than 3 are treated as CRITICAL. If all input values are of severity INDETERMINATE, the result is INDETERMINATE. For example if the Business Service depends on four child entities with the severities WARNING, WARNING, NORMAL and NORMAL and the base defined by the number 2 the following computation will be made: \$severity = |__log_{2}( 2^{0} + 2^{0} + 0 + 0 )__| = |__log_{2}( 1 + 1 + 0 + 0)__| = |__log_{2}( 2 )__| = |__1__| = 1\$ which corresponds to the severity MINOR. The same computation with the base value of 3 results in: \$severity = |__log_{3}( 3^{0} + 3^{0} + 0 + 0 )__| = |__log_{3}( 1 + 1 + 0 + 0)__| = |__log_{3}( 2 )__| = |__0.63__| = 0\$ which means WARNING. |
The following table shows the status calculation with Edges assigned to an IP Service. The IP-Service is driven by the monitoring of the ICMP service for three Web Server. In the table below you find a configuration where Web Server 3 is weighted 3 times higher than the other and a threshold of 0.33 (33%) is configured.
| Name | Weight | Weight Factor | Input Severity | Operational Status | Critical | Major | Minor | Warning | Normal |
|---|---|---|---|---|---|---|---|---|---|
Web-ICMP-1 |
1 |
0.2 |
Critical |
Critical |
0.2 |
0.2 |
0.2 |
0.2 |
0.2 |
Web-ICMP-2 |
1 |
0.2 |
Normal |
Normal |
0 |
0 |
0 |
0 |
0.2 |
Web-ICMP-3 |
3 |
0.6 |
Warning |
Warning |
0 |
0 |
0 |
0.6 |
0.6 |
Total |
1.0 |
0.2 |
0.2 |
0.2 |
0.8 |
1 |
|||
Percentage |
100% |
20% |
20% |
20% |
80% |
100% |
The Operational Status Severity is evaluated from left to right, the first value higher then the configured Threshold is used. In this case the Operational Status is set to Warning because the first threshold which exceeds 33% is Warning with 80%.
12.11. Business Service Daemon
The calculation of the Operational Status of the BS is driven by the Business Service Monitoring Daemon (bsmd). The daemon is responsible for tracking the operational status of all BS and for sending events in case of operational status changes.
In order to calculate the Operational Status the reduction key associated with a Business Service is used. The reduction key is obtained from an alarm generated by OpenNMS Horizon. This means that the alarm’s reduction key of a defined Business Service must not change afterwards. Otherwise bsmd is not able to calculate the Operational Status correctly. This also applies for removing the alarm data from events associated to Business Services In addition the child type "IP Service" from the Business Service Configuration Page requires the following events with the default reduction keys being defined: * uei.opennms.org/nodes/nodeLostService * uei.opennms.org/nodes/nodeDown * uei.opennms.org/nodes/interfaceDown
Every time the configuration of a Business Service is changed a reload of the daemon’s configuration is required. This includes changes like the name of the Business Service or its attributes as well as changes regarding the Reduction Keys, contained Business Services or IP Services. The bsmd configuration can be reloaded with the following mechanisms:
-
Click the Reload Daemon button in the Business Service Editor
-
Send the reloadDaemonConfig event using
send-event.plor use the WebUI in Manually Send an Event with parameterdaemonName bsmd -
Use the ReST API to perform a
POSTrequest to/opennms/api/v2/business-services/daemon/reload
If the reload of the configuration is done an event of type uei.opennms.org/internal/reloadDaemonConfigSuccessful is fired.
$OPENNMS_HOME/bin/send-event.pl -p 'daemonName bsmd' uei.opennms.org/internal/reloadDaemonConfigcurl -X POST -u admin:admin -v http://localhost:8980/opennms/api/v2/business-services/daemon/reload13. Topology Map
This section describes how to configure the Topology Map.
13.1. Properties
The Topology Map supports the following properties, which can be influenced by changing the file etc/org.opennms.features.topology.app.cfg:
| Property | Type | Default | Description |
|---|---|---|---|
|
|
|
Defines if the OpenNMS Horizon header is shown. |
|
|
|
If enabled, auto refresh is enabled by default. |
|
|
|
Defines the auto refresh interval in seconds. |
|
|
empty String |
A String which allows hiding categories. For example a value of |
13.2. Icons
Each Vertex on the Topology Map is represented by an icon.
The default icon is configured in the icon mapping file: ${OPENNMS_HOME}/etc/org.opennms.features.topology.app.icons.<topology-namespace>.cfg.
If an icon mapping file does not exist for a Topology Provider, the provider does not support customization.
org.opennms.features.topology.app.icons.default.cfg (1)
org.opennms.features.topology.app.icons.application.cfg (2)
org.opennms.features.topology.app.icons.bsm.cfg (3)
org.opennms.features.topology.app.icons.linkd.cfg (4)
org.opennms.features.topology.app.icons.vmware.cfg (5)| 1 | Default icon mapping |
| 2 | Icon mapping for the Application Topology Provider |
| 3 | Icon mapping for the Business Services Topology Provider |
| 4 | Icon mapping for the Linkd Topology Provider |
| 5 | Icon mapping for the Vmware Topology Provider |
Each File contains a mapping in form of <icon key> = <icon id>.
- Icon key
-
A Topology Provider dependent string which maps to an
icon id. Anicon keyconsists of one to multiplesegments. Each segment must contain only numbers or characters. If multiplesegmentsexist they must be separated by., e.g.my.custom.key. Any existing defaulticon keysare not configurable and should not be changed. - Icon id
-
The
icon idis a unique icon identifier to reference an icon within one of the available SVG icons located in${OPENNMS_HOME}/jetty-webapps/opennms/svg. For more details see Add new icons.
icon key ::= segment["."segment]*
segment ::= text+ [( "-" | "_" | ":" ) text]*
text ::== (char | number)+
char ::== A | B | ... | Z | a | b | ... | z
number ::= 0 | 1 | 2 | 3 | 4 | 5 | 6 | 7 | 8 | 9
icon id ::= segment# Business Service Topology
bsm.business-service = business_service (1)
bsm.ip-service = IP_service (2)
bsm.reduction-key = reduction_key (3)| 1 | Icon definition for Business Services |
| 2 | Icon definition for IP Services |
| 3 | Icon definition for Reduction Keys |
13.2.1. Icon resolution
The icon of a vertex is resolved as follows:
-
If a
vertex idtoicon idmapping is defined, the icon referenced by theicon idis used -
If a mapping for the
icon keydetermined by the Topology Provider for the vertex is defined, the icon referenced by theicon idis used-
If no mapping exists and the
icon keyhas more than onesegments, reduce theicon keyby the lastsegmentand try resolving thaticon key
-
-
If no mapping is defined, the fallback
icon keydefaultis used.
The following example icon mapping is defined for the Linkd Topology Provider to illustrate this behaviour.
linkd.system.snmp.1.3.6.1.4.1.9.1.485 = server1
linkd.system.snmp.1.3.6 = server2If the Enterprise OID of a node is 1.3.6.1.4.1.9.1.485 the icon with id server1 is used.
If the Enterprise OID of a node is 1.3.6 the icon with id server2 is used.
However, if the Enterprise OID of a node is 1.3.6.1.4.1.9.1.13 the icon with id server2 is used.
Linkd Topology Provider
The Linkd Topology Provider uses the Enterprise OID from each node to determine the icon of a vertex.
13.2.2. Change existing icon mappings
The easiest way to change an icon representation of an existing Vertex is to use the Icon Selection Dialog from the Vertex' context menu in the Topology Map.
This will create a custom icon key to icon id mapping in the Topology Provider specific icon mapping file.
As icon key the Vertex id is used.
This allows each Vertex to have it’s own icon.
If a more generic approach is preferred the icon mapping file can be modified manually.
| Do NOT remove the default mappings and do NOT change the icon keys in the default mappings. |
13.2.3. Add new icons
All available icons are stored in SVG files located in ${OPENNMS_HOME}/jetty-webapps/opennms/svg.
To add new icons, either add definitions to an existing SVG file or create a new SVG file in that directory.
Whatever way new icons are added to OpenNMS it is important that each new icon id describes a set of icons, rather than a single icon.
The following example illustrates this.
my-custom<?xml version="1.0" encoding="utf-8"?>
<!DOCTYPE svg PUBLIC "-//W3C//DTD SVG 1.1//EN" "http://www.w3.org/Graphics/SVG/1.1/DTD/svg11.dtd">
<svg id="icons" xmlns="http://www.w3.org/2000/svg">
<g id="my-custom_icon"> (1)
<g id="my-custom_active"> (2)
<!-- rect, path, circle, etc elements, supported by SVG -->
</g>
<g id="my-custom_rollover"> (3)
<!-- rect, path, circle, etc elements, supported by SVG -->
</g>
<g id="my-custom"> (4)
<!-- rect, path, circle, etc elements, supported by SVG -->
</g>
</g>
<!-- Additional groups ... -->
</svg>| 1 | Each icon must be in a SVG group with the id <icon id>_icon.
Each SVG <icon id>_icon group must contain three sub groups with the ids: <icon id>_active, <icon id>_rollover and <icon id>. |
| 2 | The icon to use when the Vertex is selected. |
| 3 | The icon to use when the Vertex is moused over. |
| 4 | The icon to use when the Vertex is not selected or not moused over (just visible). |
It is important that each icon id is unique overall SVG files. This means there cannot be another my-custom icon id in any other SVG file.
|
If the new icons should be selectable from the Topology Map’s Icon Selection Dialog an entry with the new icon id must be added to the file ${OPENNMS_HOME}/etc/org.opennms.features.topology.app.icons.properties.
org.opennms.features.topology.app.icons.listaccess_gateway (1)
accesspoint
cloud
fileserver
linux_file_server
opennms_server
printer
router
workgroup_switch
my-custom (2)| 1 | Already existing icon ids |
| 2 | New icon id |
The order of the entries in org.opennms.features.topology.app.icons.list determine the order in the Icon Selection Dialog in the Topology Map.
|
14. Asset Topology Provider
14.1. Overview
OpenNMS Horizon has introduced the ability for users to define arbitrarily complex layered topologies using GraphML (see http://graphml.graphdrawing.org/). The details of how OpenNMS Horizon interprets GraphML are given in the GraphML section of the OpenNMS Horizon developers guide. The ability to display complex layered topologies is a great feature but creating a usable GraphML topology for a large network can be a complex task for a user.
The Asset Topology Provider avoids the need for users to work directly with GraphML by directly generating a layered GraphML topology based upon node parameters and the contents of the Node Asset table. The Asset Topology Provider greatly simplifies the task for many use cases by allowing users to define fields in the Node Asset table which will enable nodes to be positioned correctly in a complex topology. This allows a physical and logical ordering of nodes which makes it easier for users to represent and navigate their infrastructure.
The structure of the generated topology is determined by the assetLayers configuration
constant which can be set by a user. To illustrate how this works, we will consider the following configuration:
assetLayers=asset-region,asset-building
The OpenNMS Horizon Asset table is parsed to generate nested layers in the order of the comma separated keys in the assetLayers property. Each layer is a graph which is named after the key. Graph nodes in each layer reference related Graph nodes in the underlying layer. The lowest layer contains Graph nodes which are directly linked to monitored OpenNMS Horizon nodes which have entries in the Asset table.
The following diagram shows the structure of a topology generated by the above assetLayers property
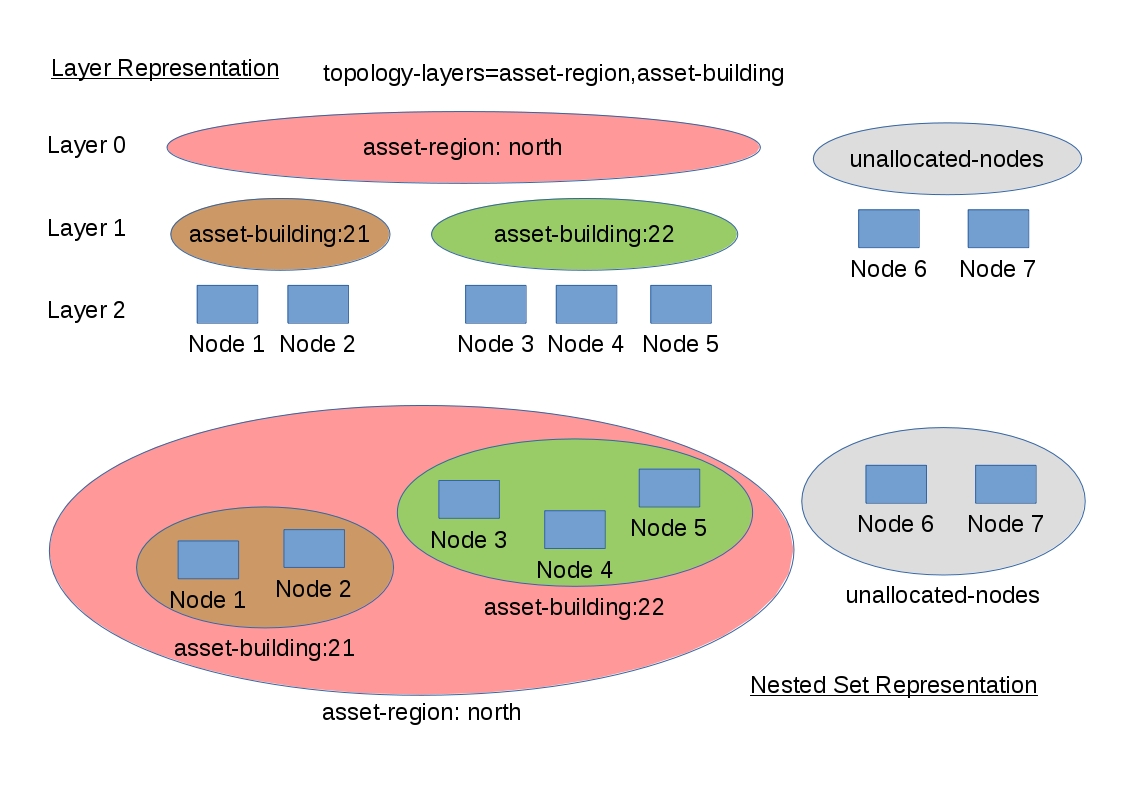
In this example the region asset fields for node 1,2,3,4 are set to north.
All of these nodes are in the same north region. The building asset fields
for Node 1 and Node 2 are set to 21 (both nodes are in building 21) while the
building asset fields for Node 3 and Node 4 are set to 22 (both nodes are in building 22).
The Asset Topology Provider generates four linked graphs for this configuration.
The layer 0 graph is called asset-region, the layer 1 graph is called asset-building
and the layer 2 graph is called nodes.
Conceptually we can see that the topology is rendered as concentric sets. The Asset Topology Provider first searches all of the nodes with regions defined and creates a new level 0 graph node representing each region found. The Asset Topology Provider then searches within each region to find the building entries and creates a corresponding level 1 graph node for each building name found. Finally the Asset Topology Provider creates layer 2 nodes corresponding to each OpenNMS Horizon monitored node and places each in the correct building.
If however OpenNMS Horizon monitored nodes are found which have either the region
or building asset fields empty they cannot be placed correctly in this topology.
These nodes as shown in the diagram as unallocated nodes.
Finally, only building and region nodes are generated which can be linked to OpenNMS Horizon nodes in the topology.
The Asset Topology Provider does not generate spurious graph nodes in upper
layers which are not directly and completely referenced by OpenNMS Horizon nodes in the lowest layer.
Example screenshots of a topology containing regions, buildings, racks and nodes are shown below
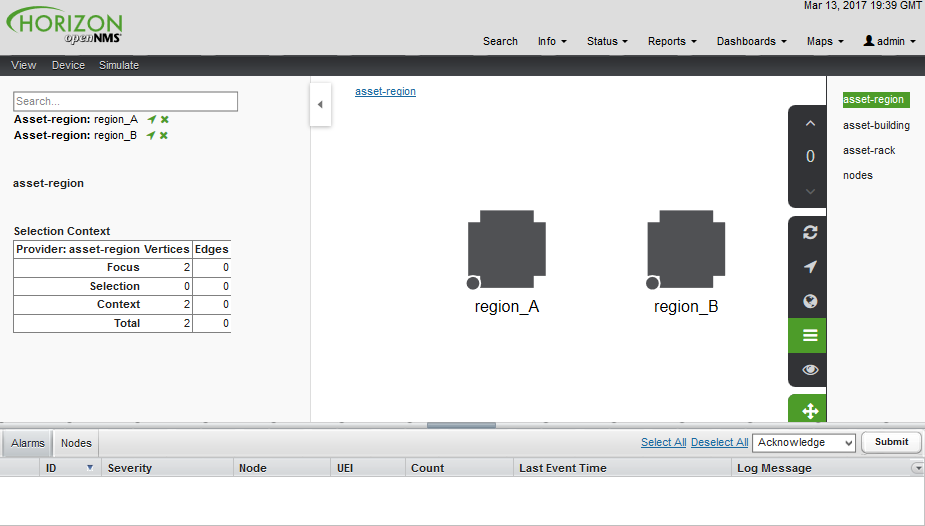
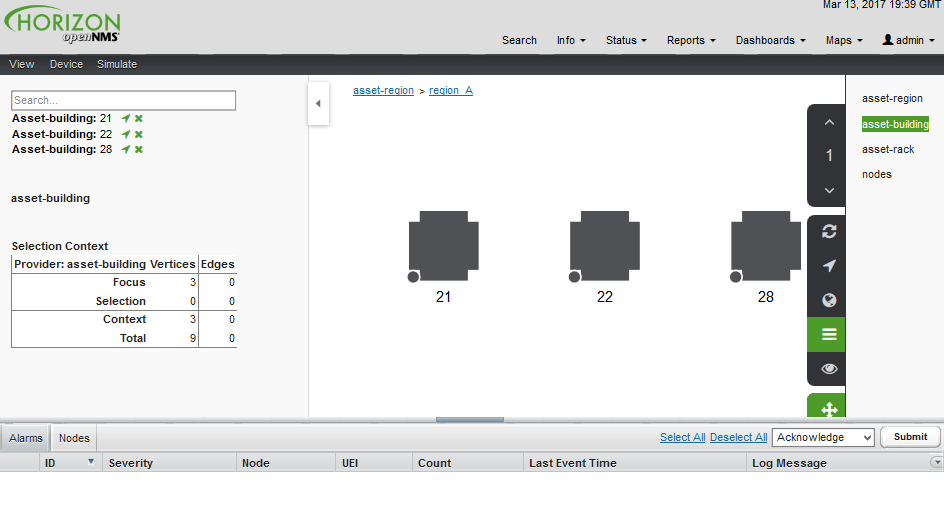
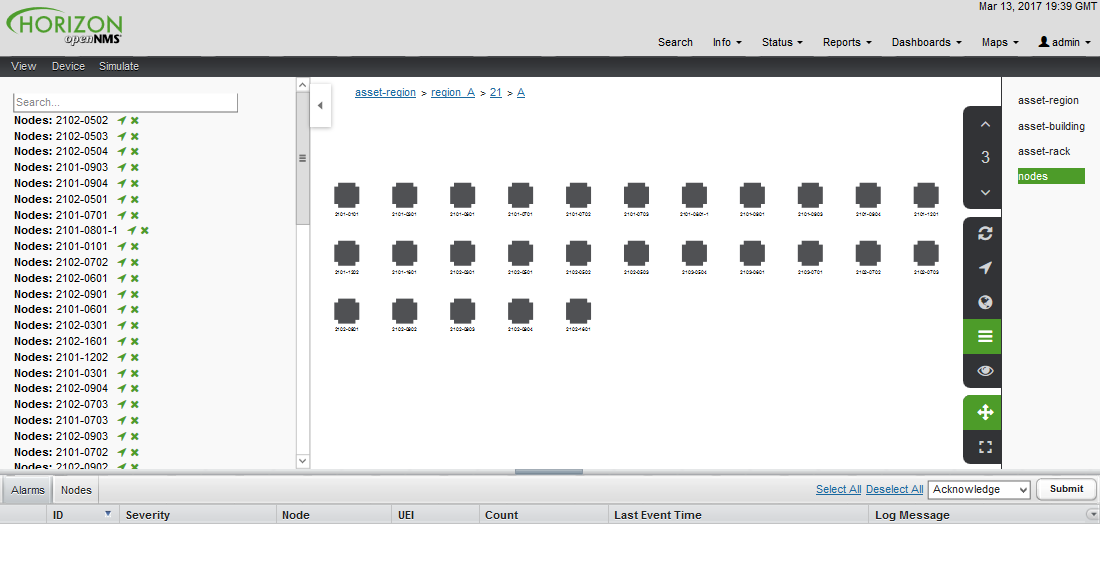
14.2. Asset layers
The entries for assetLayers can be any node or asset entry from the following list (defined in class NodeParamLabels).
Keys beginning with node- come from the node table.
Keys beginning with parent- come from the node table entry of the designated parent node (If defined).
Keys beginning with asset- come from the corresponding asset table entry for the given node (If defined).
node-nodelabel |
node-nodeid |
node-foreignsource |
node-foreignid |
node-nodesysname |
node-nodesyslocation |
node-operatingsystem |
node-categories |
||
parent-nodelabel |
parent-nodeid |
parent-foreignsource |
parent-foreignid |
|
asset-address1 |
asset-address2 |
asset-city |
asset-zip |
asset-state |
asset-latitude |
asset-longitude |
asset-region |
asset-division |
asset-department |
asset-building |
asset-floor |
asset-room |
asset-rack |
asset-slot |
asset-port |
asset-circuitid |
asset-category |
asset-displaycategory |
asset-notifycategory |
asset-pollercategory |
asset-thresholdcategory |
asset-managedobjecttype |
asset-managedobjectinstance |
asset-manufacturer |
asset-vendor |
asset-modelnumber |
asset-description |
asset-operatingsystem |
asset-country |
This allows arbitrary topologies to be generated including physical fields (room, rack etc.) and
logical fields such as asset node categories. Please note you should not put any spaces in the comma separated assetLayers list.
If the assetLayers property is defined as empty then a single graph layer will be generated containing all opennms nodes.
14.3. Node filtering
In many cases it is desirable to control which nodes are included or excluded from a topology. For instance it is useful to be able to generate customised topologies for specific customers which include only regions/buildings etc relevant to their filtered node set. To this end it is possible to define a node filter which chooses which nodes are included in a generated topology.
Filters are defined using the same asset table keys which are available for the assetLayers field.
| Operation | Definition | Example |
|---|---|---|
OR |
key1=value1,value2 alternatively key1=value1;key1=value2 |
asset-region=north,south |
AND |
key1=val1;key2=val2 |
asset-region=north;asset-building=23 |
NOT |
key1=!val1 |
asset-building=!23 |
Thus the following configuration means include only nodes with region north or south but exclude all nodes with building 23.
filter=asset-region=north,south;asset-building=!23
The filters are designed to treat all selected text key entries as comma separated values (csv). This allows OpenNMS node-categories which are many to many entries to be dealt with as a comma separated list of values; routers,servers,web etc. Thus we can select based on multiple separate node categories. The following configuration means show routers and servers on all buildings except building 23.
filter=node-categories=routers,servers;asset-building=!23
The filters treat all asset table entries as comma separated variables (csv). This also means that, for instance asset-displaycategory could also contain several values separated by commas. e.g. customer1,customer2,customer3 etc.
| You should make sure asset addresses and other free format asset text fields do not contain commas if you want an exact match on the whole field |
Regular expressions are also allowed. Regular expressions start with the ~ character. You can also negate a regular expression by preceding it with !~.
The following example will match against regions 'Stuttgart' and 'Isengard' and any building name which ends in 4
filter=asset-region=~.*gar(t|d);asset-building=~.*4
14.4. Configuration
The Asset Topology Provider persists both the asset topology graph definitions and the generated GraphML graphs. The persisted definitions mean that is is possible to regenerate graphs if the asset table is changed without reentering the configuration.
The Asset Topology Provider persists GraphML graphs along side any other GraphML graphs in the directory;
<opennms home>/etc/graphml
Please note that if you are using ReST or any other means to generate other GraphML graphs, you should ensure that the providerIds and labels are distinct from those used by the Asset Topology Provider
The asset graph definitions for the Asset Topology Provider are persisted to the following xml configuration file:
<opennms home>/etc/org.opennms.features.topology.plugins.topo.asset.xml
Normally you should not edit this file directly but use the karaf consol or events to define new graphs.
The config file will contain each of the graph definitions as properties in the form
<?xml version="1.0" encoding="UTF-8" standalone="yes"?>
<configs>
<config>
<label>Asset Topology Provider</label>
<breadcrumb-strategy>SHORTEST_PATH_TO_ROOT</breadcrumb-strategy>
<provider-id>asset</provider-id>
<preferred-layout>Grid Layout</preferred-layout>
<filters>
<filter>asset-region=South</filter>
</filters>
<layers>
<layer>asset-region</layer>
<layer>asset-building</layer>
<layer>asset-rack</layer>
</layers>
</config>
</configs>
The individual definition parameters are described in the following table
| Parameter | Description |
|---|---|
|
The unique name of the provider - used as handle to install and remove the topology |
|
The name which shows up on the topology menu (must be unique) |
|
List of asset layers (in order). See separate description. |
|
List of filters to be applied. Filters determine which nodes are included in graph. See separate description. |
|
Preferred layout of the nodes in generated graphs. |
|
Breadcrumb strategy used to display breadcrumbs above each graph |
14.5. Creating Asset Based Topologies From Karaf Consol
The OpenNMS Horizon Karaf Consol can be used to control topology generation. To login use admin password.
ssh admin@localhost -p 8101
The following commands are available
| Command | Description | Options |
|---|---|---|
opennms:asset-topo-create |
Creates Asset Topology. |
(The default settings are used if a particular setting is not included in the command) -l, --label : Asset Topology label (shows in topology menu) (Default: asset) -i, --providerId : Unique providerId of asset topology (Default: 'Asset Topology Provider') -f, --filter : Optional node filter (Default: empty filter i.e. allow all nodes) -a, --assetLayers : Comma separated list of asset layers (Default: asset-region,asset-building,asset-rack) -p, --preferredLayout : Preferred Layout (Default: 'Grid Layout') -b, --breadcrumbStrategy : Bread Crumb Strategy (Default: SHORTEST_PATH_TO_ROOT) If you simply type asset-topology:create a default topology with providerId asset will be created. |
opennms:asset-topo-remove |
Removes Asset Topology. |
-i, --providerId : Unique providerId of asset topology (Default: asset) |
opennms:asset-topo-list |
Lists all Asset Topologies installed. |
all : display detailed view including --uriParams string |
opennms:asset-topo-regenerate |
Regenerates the graphs for the given Asset Topology definition. |
-i, --providerId : Unique providerId of asset topology to regenerate (Default: asset) |
opennms:asset-topo-regenerateall |
Best Effort regeneration of all asset topologies. (If one graph fails, the command will try to complete the rest of the definitions definition) |
14.6. Creating Asset Based Topologies Using OpenNMS Horizon events
The Asset Topology Provider listens for events which trigger the generation and installation or removal of topologies. The Asset Topology Provider events are defined in the file
<opennms home>/etc/events/GraphMLAssetPluginEvents.xml
These events will use the default parameters if parameters are not supplied
To create a new topology from the current OpenNMS inventory use
(for default topology) sudo ./send-event.pl uei.opennms.plugins/assettopology/create localhost (or with parameters) sudo ./send-event.pl uei.opennms.plugins/assettopology/create localhost -p 'providerId test' -p 'label test' -p 'assetLayers asset-country,asset-city,asset-building'--> other example possible parameters are -p 'filters asset-displaycategory=!testDisplayCategory' -p 'preferredLayout Grid Layout' -p 'breadcrumbStrategy SHORTEST_PATH_TO_ROOT'
To uninstall an asset topology use
(for default topology providerId) sudo ./send-event.pl uei.opennms.plugins/assettopology/remove localhost (or with specific providerId) sudo ./send-event.pl uei.opennms.plugins/assettopology/remove localhost -p 'providerId test'
To regenerate an existing asset topology use
(for default topology providerId) sudo ./send-event.pl uei.opennms.plugins/assettopology/regenerate localhost (or with specific providerId) sudo ./send-event.pl uei.opennms.plugins/assettopology/regenerate localhost-p 'providerId test'
To regenerate all existing asset topologies use
sudo ./send-event.pl uei.opennms.plugins/assettopology/regenerateall localhost
14.7. Viewing the topology
If all goes well, having installed the topology, upon refreshing your screen, you should see a new topology display option in the OpenNMS Horizon topology page. The displayed name of this topology is given by the label field
The label field need not be the same as the providerId which is used by the ReST api for the installation or removal of a topology. However the label field must be unique across all installed topologies.
It is possible to have several topologies installed which have been generated using different configurations. You simply need to ensure that the providerId and label field used for each installation command is different.
14.8. Additional notes
Please note you MUST first uninstall an OpenNMS Horizon graphml topology before installing a new one. You will also have to log out and log back into the UI in order to see the new topology file. If you uninstall a topology while viewing it, the UI will throw an error and you will also have to log out and back in to see the remaining topologies.
15. Database Reports
Reporting on information from the OpenNMS Horizon monitoring system is important for strategical or operational decisions. Database reports give access to the embedded JasperReports engine and allow users to create and customize report templates. Run these reports on demand or on a predefined schedule within OpenNMS Horizon.
| Originally database reports created reports working on data stored in the OpenNMS Horizon database only. This is no longer mandatory, performance data can also be used. Theoretically the reports do not need to be OpenNMS Horizon related. |
| The OpenNMS Horizon Report Engine allows the creation of various kinds of reports and also supports distributed report repositories. These features are not covered by this documentation. Only reports using JasperReports and Grafana dashboards are described here. |
15.1. Overview
The OpenNMS Horizon Report Engine uses the JasperReport library to create reports in various output formats.
Each report template must be a *.jrxml file.
The OpenNMS Horizon Report Engine passes a JDBC Connection to the OpenNMS Horizon Database to each report on execution.
Supported Output Formats |
|
|
6.3.0 |
For more details on how JasperReports works, please refer to the official documentation of Jaspersoft Studio.
15.2. Modify existing reports
All default OpenNMS Horizon reports are located in $OPENNMS_HOME/etc/report-templates.
Each .jrxml file located there can be modified; the changes are applied the next time OpenNMS Horizon creates a report.
When a subreport has been modified, OpenNMS Horizon will detect a change based on the report’s lastModified time and will recompile the report.
A compiled version of the report is represented by a .jasper file with the same name as the .jrxml file.
Subreports are located in $OPENNMS_HOME/etc/report-templates/subreports.
If unsure, simply delete all .jasper files and OpenNMS Horizon will automatically compile the subreports if needed.
|
15.3. Add a custom report
To add a new JasperReport report to the Local OpenNMS Horizon Report Repository, do the following:
Create a new entry in the $OPENNMS_HOME/etc/database-reports.xml file.
<report
id="MyReport" (1)
display-name="My Report" (2)
online="true" (3)
report-service="jasperReportService" (4)
description="This is an example description. It shows up in the web ui when creating an online report" (5)
/>| 1 | A unique identifier. |
| 2 | The name of the report. Appears in the web UI. |
| 3 | Defines if this report can be executed on demand, otherwise only scheduling is possible. |
| 4 | The report service implementation to use. In most cases this is jasperReportService. |
| 5 | A description of the report. Appears in the web UI. |
In addition, create a new entry in the $OPENNMS_HOME/etc/jasper-reports.xml file.
<report
id="MyReport" (1)
template="My-Report.jrxml" (2)
engine="jdbc" (3)
/>| 1 | The identifier defined in the previous step. This identifier must exist in $OPENNMS_HOME/etc/database-reports.xml. |
| 2 | The name of the template. The template must be located in $OPENNMS_HOME/etc/report-templates. |
| 3 | The engine to use. It is either jdbc or null. |
15.4. Usage of Jaspersoft Studio
When developing new reports, we recommended using the Jaspersoft Studio application. Download it here.
| We recommend always using the same Jaspersoft Studio version that the OpenNMS Horizon JasperReport library uses. Currently OpenNMS Horizon uses version 6.3.0. |
15.4.1. Connect to the OpenNMS Horizon Database
To actually create SQL statements against the OpenNMS Horizon database you must create a database Data Adapter.
The official Jaspersoft Studio documentation and wiki cover how to do this.
15.4.2. Use Measurements Datasource and Helpers
To use the Measurements API you must add the Measurements Datasource library to the build path of JasperStudio.
To do so, right click in the Project Explorer and select Configure Buildpath.
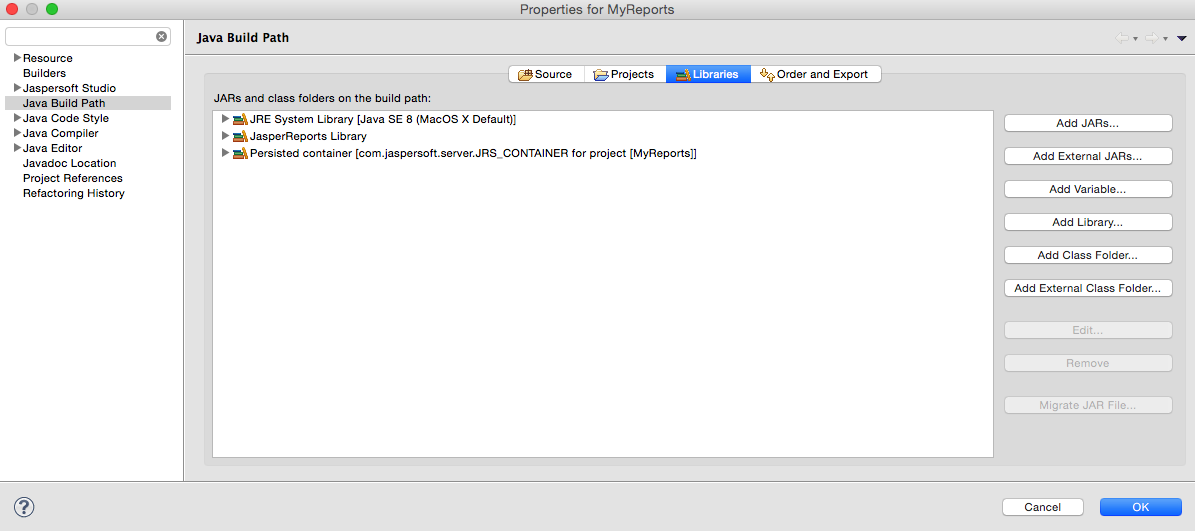
-
Switch to the
Librariestab. -
Click
Add External JARsand select theopennms-jasperstudio-extension-26.1.3-SNAPSHOT-jar-with-dependencies.jarfile located in$OPENNMS_HOME/contrib/jasperstudio-extension. -
Close the file selection dialog.
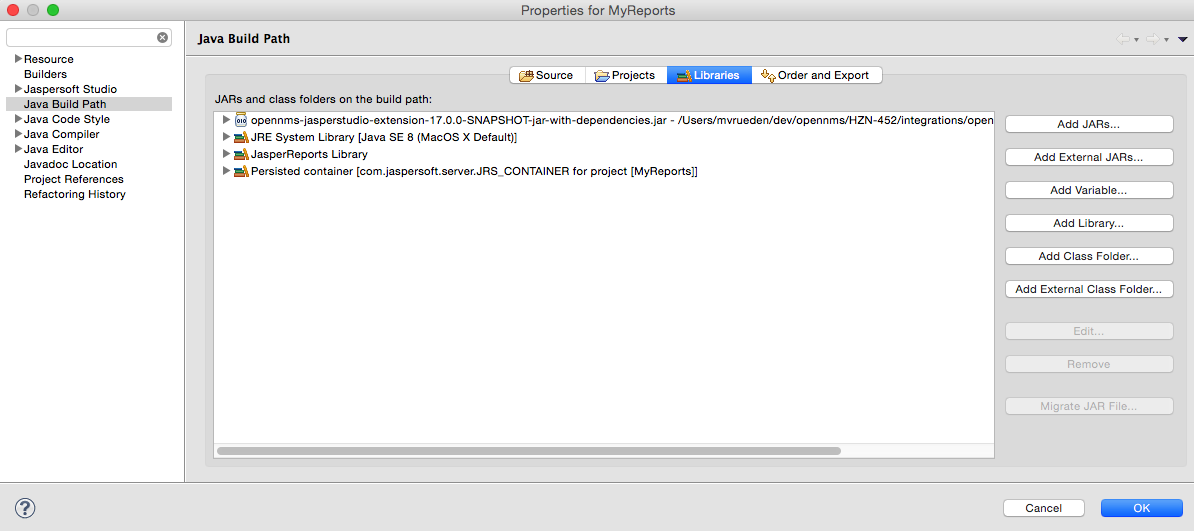
-
The Measurements Datasource and Helpers should now be available.
-
Go to the
Dataset and Query Dialogin Jaspersoft Studio and select a language calledmeasurement.
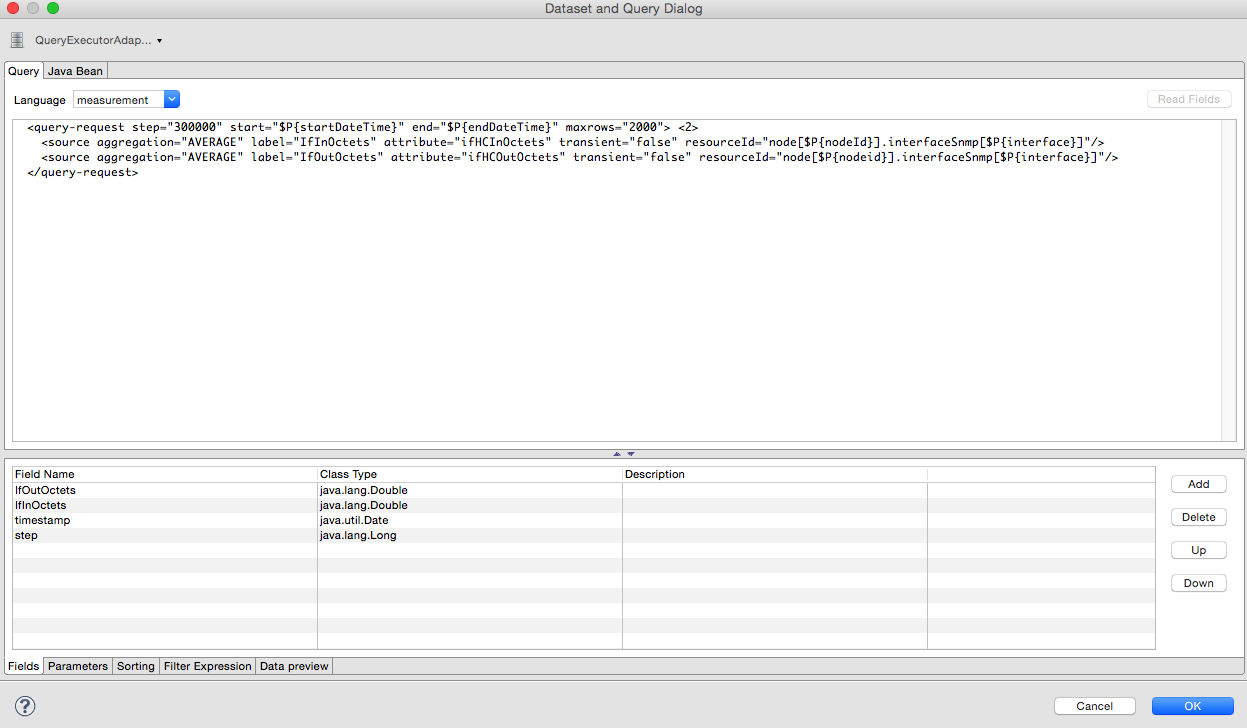
If the Read Fields functionality is not available, use the Data preview.
Access to the Measurements API is possible using the connection parameters MEASUREMENT_URL, MEASUREMENT_USERNAME and MEASUREMENT_PASSWORD.
The Supported Fields section gives more details.
|
15.5. Accessing Performance Data
Before OpenNMS Horizon 17 and OpenNMS Meridian 2016, it was possible to access the performance data stored in .rrd or .jrobin files directly by using the jrobin language extension provided by the RrdDataSource.
This is no longer possible; you must use the Measurements Datasource.
|
To access performance data within reports, we created a custom Measurement Datasource that allows you to query the Measurements API and process the returned data in your reports. Please refer to the official Measurements API documentation on how to use the _Measurements API.
When using the Measurements Datasource within a report a HTTP connection to the Measurements API is only established if the report is NOT running within OpenNMS Horizon, e.g. when used with Jaspersoft Studio.
|
To receive data from the Measurements API simply create a query as follows:
Measurements API<query-request step="300000" start="$P{startDateTime}" end="$P{endDateTime}" maxrows="2000"> (1)
<source aggregation="AVERAGE" label="IfInOctets" attribute="ifHCInOctets" transient="false" resourceId="node[$P{nodeId}].interfaceSnmp[$P{interface}]"/>
<source aggregation="AVERAGE" label="IfOutOctets" attribute="ifHCOutOctets" transient="false" resourceId="node[$P{nodeid}].interfaceSnmp[$P{interface}]"/>
</query-request>| 1 | The query language. In our case, measurement, but JasperReports supports a lot out of the box, such as sql, xpath, etc. |
15.5.1. Fields
Each datasource should return a number of fields, which can be used in the report. The Measurement Datasource supports the following fields:
| Field name | Field type | Field description |
|---|---|---|
|
|
Each |
|
|
The timestamp of the sample. |
|
|
The |
|
|
The |
|
|
The |
For more details about the Response, please refer to the official Measurement API documentation.
15.5.2. Parameters
In addition to the queryString, the following JasperReports parameters are supported.
| Parameter name | Required | Description |
|---|---|---|
MEASUREMENT_URL |
|
The URL of the Measurements API, e.g. |
MEASUREMENT_USERNAME |
|
If authentication is required, specify the username, e.g. |
MEASUREMENT_PASSWORD |
|
If authentication is required, specify the password, e.g. |
15.6. Disable Scheduler
In cases where the scheduler executing the reports must be disabled, set the system property opennms.report.scheduler.enabled to false.
You can set this in ${OPENNMS_HOME}/etc/opennms.properties or ${OPENNMS_HOME}/etc/opennms.properties.d/<my-properties-file>.properties.
15.7. Helper methods
There are a few helper methods to help create reports in OpenNMS Horizon.
These helpers come with the Measurement Datasource.
| Helper class | Helper Method | Description |
|---|---|---|
|
|
Generates a |
|
|
Returns the |
15.7.1. Usage of the node source descriptor
A node is addressed by a node source descriptor.
The node source descriptor references the node either via the foreign source and foreign id or by the node id.
If store by foreign source is enabled addressing the node only via foreign source and foreign id is possible.
To make report creation easier, there is a helper method to create the node source descriptor.
For more information about store by foreign source, please see our Wiki.
|
The following example shows the usage of that helper.
node source descriptor.<parameter name="nodeResourceDescriptor" class="java.lang.String" isForPrompting="false">
<defaultValueExpression><![CDATA[org.opennms.netmgt.jasper.helper.MeasurementsHelper.getNodeOrNodeSourceDescriptor(String.valueOf($P{nodeid}), $P{foreignsource}, $P{foreignid})]]></defaultValueExpression>
</parameter>
<queryString language="Measurement">
<![CDATA[<query-request step="300000" start="$P{startDateTime}" end="$P{endDateTime}" maxrows="2000">
<source aggregation="AVERAGE" label="IfInOctets" attribute="ifHCInOctets" transient="false" resourceId="$P{nodeResourceDescriptor}.interfaceSnmp[en0-005e607e9e00]"/>
<source aggregation="AVERAGE" label="IfOutOctets" attribute="ifHCOutOctets" transient="false" resourceId="$P{nodeResourceDescriptor}.interfaceSnmp[en0-005e607e9e00]"/>
</query-request>]]>Depending on the input parameters, you either get a node resource descriptor or a foreign source/foreign id resource descriptor.
15.7.2. Usage of the interface descriptor
An interfaceSnmp is addressed with the exact interface descriptor.
To allow easy access to the interface descriptor we provide a helper tool.
The following example shows the usage of that helper.
interface descriptor<parameter name="interface" class="java.lang.String" isForPrompting="false">
<parameterDescription><![CDATA[]]></parameterDescription>
<defaultValueExpression><![CDATA[org.opennms.netmgt.jasper.helper.MeasurementsHelper.getInterfaceDescriptor($P{snmpifname}, $P{snmpifdescr}, $P{snmpphysaddr})]]></defaultValueExpression>
</parameter>
<queryString language="Measurement">
<![CDATA[<query-request step="300000" start="$P{startDateTime}" end="$P{endDateTime}" maxrows="2000">
<source aggregation="AVERAGE" label="IfInOctets" attribute="ifHCInOctets" transient="false" resourceId="node[$P{nodeId}].interfaceSnmp[$P{interface}]"/>
<source aggregation="AVERAGE" label="IfOutOctets" attribute="ifHCOutOctets" transient="false" resourceId="node[$P{nodeId}].interfaceSnmp[$P{interface}]"/>
</query-request>]]>To get the appropriate interface descriptor depends on the input parameter.
15.7.3. Use HTTPS
To establish a secure connection to the Measurements API, you must import the public certificate of the running OpenNMS Horizon to the Java Trust Store. In addition, OpenNMS Horizon must be configured to use that Java Trust Store. Please follow the instructions in this chapter to setup the Java Trust Store correctly.
In addition please also set the property org.opennms.netmgt.jasper.measurement.ssl.enable in $OPENNMS_HOME\etc\opennms.properties to true to ensure that only secure connections are established.
If org.opennms.netmgt.jasper.measurement.ssl.enable is set to false an accidentally insecure connection can be established to the Measurements API location.
An SSL secured connection can be established even if org.opennms.netmgt.jasper.measurement.ssl.enable is set to false.
|
15.8. Limitations
-
Only a JDBC Datasource to the OpenNMS Horizon Database connection can be passed to a report, or no datasource at all. One does not have to use the datasource, though.
15.9. Creating PDF Reports from Grafana Dashboards Using OpenNMS Horizon
OpenNMS Horizon provides three templates to create a PDF report from an existing Grafana dashboard. You can also schedule and email these PDF reports to anyone:
-
Keep staff without access to OpenNMS Horizon informed about network performance for improved capacity planning
-
Create a permanent record of strategic information and progress over a long period of time
The PDF report displays each of the panels from the specified dashboard, with one, two, or four panels per page, depending on the selected template.
Dashboard to PDF:
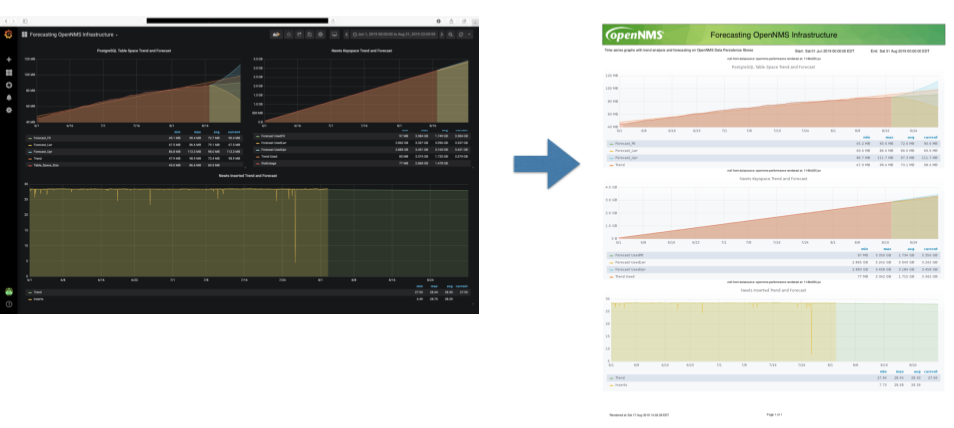
15.9.1. Before You Begin
This feature requires OpenNMS Horizon and an instance of Grafana with at least one dashboard and panel. OpenNMS allows you to create a report for any Grafana dashboard, not just those created using OpenNMS Helm.
You must set up Grafana as a datasource by configuring the Grafana endpoint in OpenNMS Horizon.
15.9.2. Configure the Grafana Endpoint
Configuring the Grafana endpoint sets up Grafana as the datasource for the dashboards from which you create PDFs.
-
Login to your Grafana instance.
-
Choose Configuration > API Keys and click New API Key.
-
Specify a key name and "Viewer" role and click Add.
-
Leave the time to live blank so that the key never expires.
-
-
Copy the key so that you can paste it into the OpenNMS Horizon UI.
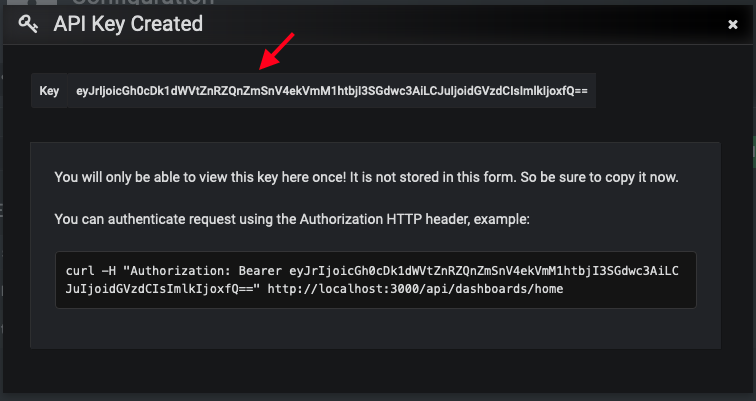
-
If desired, test the key using the Curl command provided oi the API key dialog.
-
-
In OpenNMS, click Please add a Grafana endpoint:
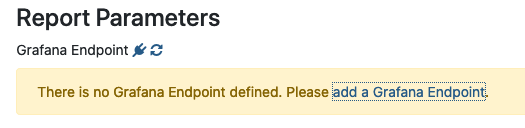
-
In the Endpoint Configuration screen click the plus sign on the right to add a new endpoint.
-
Fill in the information and click Test Connection.
-
Click Create.
You can now use OpenNMS Horizon to create PDF reports of Grafana dashboards.
15.9.3. Creating a PDF of a Grafana Dashboard
-
In the OpenNMS Horizon UI, choose
Reports>Database Reports. -
In the
Report Templatesarea, clickGrafana Dashboard Report <Xppp>, where<Xppp>represents the number of panels per page you want to display. -
In the
Report Parametersarea, specify the appropriate information.-
Note that
Grafana Endpointis the datasource. Select a Grafana dashboard from the drop-down list. -
You can also specify CSV for report type.
-
-
Click
Create Report.-
You are prompted to save the report locally or open it. The file is saved to a folder on the OpenNMS Horizon Server. It also appears in the UI in the
Persisted Reportstab.
-
-
To send the report to someone, click
Deliver this report. -
Fill out the
Report Delivery Options.-
If you select
Email report, specify the recipient’s email address in theRecipientfield. Separate multiple recipient emails with a comma. -
Webhook allows you to post the generated report to the specified URL.
-
-
Click
Deliver Report. -
To schedule the report for regular delivery, click
Schedule this report. -
Specify the report frequency (daily, days per week, etc.) and interval of the report.
-
Click
Schedule Report.
Scheduled reports appear in the Report Schedules tab, where you can edit or delete them:
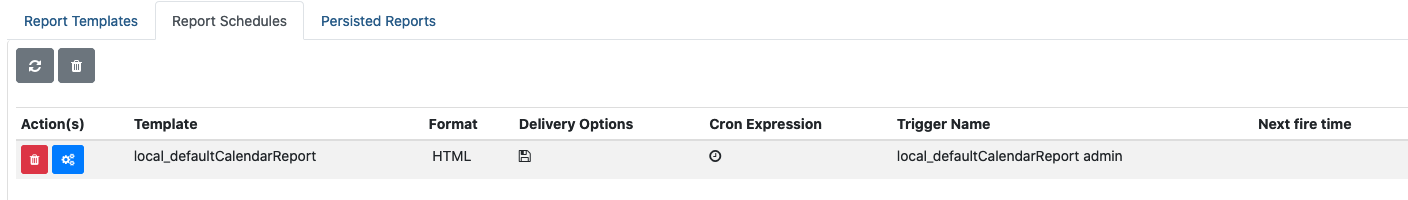
16. Enhanced Linkd
Enhanced Linkd (Enlinkd) has been designed to discover connections between nodes using data generated by various link discovery protocols and accessible via SNMP. Enlinkd gathers this data on a regular interval and creates a snapshot of a device’s neighbors from its perspective by SNMP Data Collectors. Enlinkd consolidate the collected Data by Bridge Domain Discovery and Topologies Updater.
Enlinkd-Bridge Domain Discovery use the data gathered by Bridge and IpNetToMedia collectors to provide Bridge Broadcast Domain layout. The Bridge Forwarding Table provided by the single nodes display information about mac address learned on which bridge port, this is what the Bridge consider a Connection: this is not very useful so Bridge Discovery will perform domain calculation to assign to every mac address the port where the device that holds it is effective connected (Or the known nearest bridge port).
Enlinkd-Updaters, for every supported discovery protocol, use the provided Topologies Update API to provide connections information to other OpenNMS service and daemon via OnmsTopologyDao. The provided topologies are used in topology-map and for sending TopologyMessage via Kafka Producer.
The connections discovered by Enlinkd collectors and by Bridge Domain Discovery are called Links. The term Link, within the context of Enlinkd, is not synonymous with the term "link" when used with respect to the network OSI Layer 2 domain, whereby a link only indicates a Layer 2 connection. A Link in context of Enlinkd is a more abstract concept and is used to describe any connection between two OpenNMS Horizon Nodes. These Links are discovered based on information provided by an agent’s understanding of connections at the OSI Layer 2, Layer 3, or other OSI layers.
The Topologies discovered by Enlinkd-Updaters are made of Vertices and Edges.
The following sections describe the Enlinkd daemon and its configuration. Additionally, the supported Link discovery implementations will be described as well as a list of the SNMP MIBs that the SNMP agents must expose in order for EnLinkd to gather Links between Nodes. FYI: Detailed information about a node’s connections (discovered Links) and supporting link data can be seen on the Node detail page within the OpenNMS Horizon Web-UI.
16.1. Enlinkd Daemon
Essentially each Enlinkd-Collector asks each device the following question: "What is the network topology from your point of view", this will provide local topology discovery features.
The Enlinkd-Discovery does attempt to discover bridge domain Links with the data coming from all collected Bridge Forwarding Tables.
The Enlinkd-Updaters does attempt to discover global OnmsTopology doing correlation with the data coming from all node discovered Links.
For large environments the behavior of Enlinkd can be configured. During the EnLink discovery process informational and error output is logged to a global log file.
| File | Location | Description |
|---|---|---|
|
|
Global configuration for the daemon process |
|
|
Global Enlinkd log file |
|
|
Configuration file to set the log level for Enlinkd |
<?xml version="1.0" encoding="ISO-8859-1"?>
<enlinkd-configuration threads="5"
initial_sleep_time="60000"
rescan_interval="86400000"
use-cdp-discovery="true"
use-bridge-discovery="true"
use-lldp-discovery="true"
use-ospf-discovery="true"
use-isis-discovery="true"
topology_interval="30000"
bridge_topology_interval="300000"
max_bft="100"
discovery-bridge-threads="1"
/>| Attribute | Type | Default | Description |
|---|---|---|---|
|
Integer |
|
Number of parallel threads used by Collectors, Updaters and Discovery. |
|
Integer |
|
Time in milliseconds to wait for start Collectors after OpenNMS Horizon is started. |
|
Integer |
|
Interval in milliseconds for Collectors. |
|
Integer |
|
Interval in milliseconds for Updaters. |
|
Integer |
|
Interval in milliseconds for Discovery. |
|
Integer |
|
the max number of bft stored in memory for Discovery. |
|
Integer |
|
the number of threads used for Discovery. |
|
Boolean |
|
Enable or disable discovery based on CDP information. |
|
Boolean |
|
Enable or disable discovery based on the Bridge information. |
|
Boolean |
|
Enable or disable discovery based on LLDP information. |
|
Boolean |
|
Enable or disable discovery based on OSPF information. |
|
Boolean |
|
Enable or disable discovery based on IS-IS information. |
The Discovery for bridge first start is scheduled at initial_sleep_time + bridge_topology_interval. The Updaters first start are scheduled at 0L. Configuration changes are applied by restarting OpenNMS and Enlinkd. It is also possible to send an Event to Enlinkd reloading the configuration. An Event can be sent on the CLI or the Web User Interface.
cd $OPENNMS_HOME/bin
./send-event.pl uei.opennms.org/internal/reloadDaemonConfig --parm 'daemonName Enlinkd'| If multiple protocols are enabled, the links will be discovered for each enabled discovery protocol. The topology WebUI will visualize Links for each discovery protocol. For example if you start CDP and LLDP discovery, the WebUI will visualize a CDP Link and an LLDP Link. |
16.2. Layer 2 Link Discovery
Enlinkd is able to discover Layer 2 network links based on the following protocols:
-
Cisco Discovery Protocol (CDP)
-
Bridge Discovery (Bridge)
This information are provided by SNMP Agents with appropriate MIB support. For this reason it is required to have a working SNMP configuration running. The following section describes the required SNMP MIB provided by the SNMP agent to allow the Link Discovery.
16.2.1. LLDP Discovery
The Link Layer Discovery Protocol (LLDP) is a vendor-neutral link layer protocol. It is used by network devices for advertising their identity, capabilities, and neighbors. LLDP performs functions similar to several proprietary protocols, such as the Cisco Discovery Protocol (CDP), Extreme Discovery Protocol, Foundry Discovery Protocol (FDP), Nortel Discovery Protocol (also known as SONMP), and Microsoft’s Link Layer Topology Discovery (LLTD)[1].
Only nodes with a running LLDP process can be part of the link discovery.
The data is similar to running a show lldp neighbor command on the device.
Linux and Windows servers don’t have an LLDP process running by default and will not be part of the link discovery.
|
The following OIDs are supported to discover and build the LLDP network topology and are collected by the LLDP Discovery Collector.
| Name | OID | Description |
|---|---|---|
lldpLocChassisIdSubtype |
|
The type of encoding used to identify the chassis associated with the local system. Possible values can be: |
lldpLocChassisId |
|
The string value used to identify the chassis component associated with the local system. |
lldpLocSysName |
|
The string value used to identify the system name of the local system. If the local agent supports IETF RFC 3418, lldpLocSysName object should have the same value of sysName object. |
lldpLocPortIdSubtype |
|
The type of port identifier encoding used in the associated lldpLocPortId object. |
lldpLocPortId |
|
The string value used to identify the port component associated with a given port in the local system. |
lldpLocPortDesc |
|
The string value used to identify the 802 LAN station’s port description associated with the local system. If the local agent supports IETF RFC 2863, lldpLocPortDesc object should have the same value of ifDescr object. |
lldpRemChassisIdSubtype |
|
The type of encoding used to identify the chassis associated with the local system. Possible values can be: |
lldpRemChassisId |
|
The string value used to identify the chassis component associated with the remote system. |
lldpRemPortIdSubtype |
|
The type of port identifier encoding used in the associated lldpRemPortId object. |
lldpRemPortId |
|
The string value used to identify the port component associated with the remote system. |
lldpRemPortDesc |
|
The string value used to identify the description of the given port associated with the remote system. |
lldpRemSysName |
|
The string value used to identify the system name of the remote system. |
Generic information about the LLDP process can be found in the LLDP Information box on the Node Detail Page of the device. Information gathered from these OIDs will be stored in the following database table:
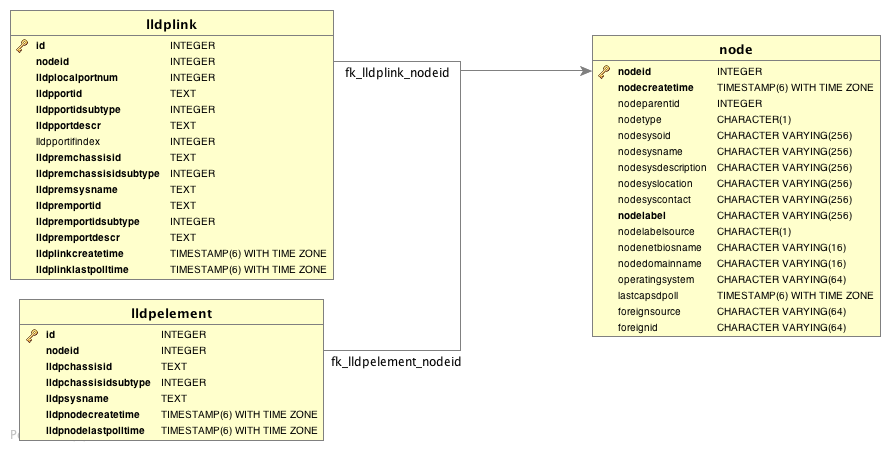
Lldp Topology Updater provide LLDP OnmsTopology consolidating lldp data collected by LLDP Collector only full bidirectional connections between two Lldp supported devices become Edges. Node A and Node B are connected by an LLDP Edge if and only if there is an LLDP MIB port connection in Node A to Node B and viceversa.
16.2.2. CDP Discovery
The Cisco Discovery Protocol (CDP) is a proprietary link layer protocol from Cisco. It is used by network devices to advertise identity, capabilities and neighbors. CDP performs functions similar to several proprietary protocols, such as the Link Layer Discovery Protocol (LLDP), Extreme Discovery Protocol, Foundry Discovery Protocol (FDP), Nortel Discovery Protocol (also known as SONMP), and Microsoft’s Link Layer Topology Discovery (LLTD). The CDP discovery uses information provided by the CISCO-CDP-MIB and CISCO-VTP-MIB.
Only nodes with a running CDP process can be part of the link discovery.
The data is similar to running a show cdp neighbor command on the IOS CLI of the device.
Linux and Windows servers don’t have a CDP process running by default and will not be part of the link discovery.
|
The following OIDs are supported to discover and build the CDP network topology and are collected by the CDP Discovery Collector.
| Name | OID | Description |
|---|---|---|
ifDescr |
|
A textual string containing information about the interface. This string should include the name of the manufacturer, the product name and the version of the interface hardware/software. |
| Name | OID | Description |
|---|---|---|
cdpInterfaceName |
|
The name of the local interface as advertised by CDP in the Port-ID TLV. |
cdpCacheEntry |
|
An entry (conceptual row) in the cdpCacheTable, containing the information received via CDP on one interface from one device. Entries appear when a CDP advertisement is received from a neighbor device. Entries disappear when CDP is disabled on the interface, or globally. |
cdpCacheAddressType |
|
An indication of the type of address contained in the corresponding instance of cdpCacheAddress. |
cdpCacheAddress |
|
The (first) network-layer address of the device’s SNMP-agent as reported in the Address TLV of the most recently received CDP message.
For example, if the corresponding instance of cacheAddressType had the value |
cdpCacheVersion |
|
The Version string as reported in the most recent CDP message. The zero-length string indicates no Version field (TLV) was reported in the most recent CDP message. |
cdpCacheDeviceId |
|
The Device-ID string as reported in the most recent CDP message. The zero-length string indicates no Device-ID field (TLV) was reported in the most recent CDP message. |
cdpCacheDevicePort |
|
The Port-ID string as reported in the most recent CDP message.
This will typically be the value of the ifName object (e.g., |
cdpCachePlatform |
|
The Device’s Hardware Platform as reported in the most recent CDP message. The zero-length string indicates that no Platform field (TLV) was reported in the most recent CDP message. |
cdpGlobalRun |
|
An indication of whether the Cisco Discovery Protocol is currently running. Entries in cdpCacheTable are deleted when CDP is disabled. |
cdpGlobalDeviceId |
|
The device ID advertised by this device. The format of this device id is characterized by the value of cdpGlobalDeviceIdFormat object. |
cdpGlobalDeviceIdFormat |
|
An indication of the format of Device-Id contained in the corresponding instance of cdpGlobalDeviceId.
User can only specify the formats that the device is capable of as denoted in cdpGlobalDeviceIdFormatCpb object. |
| vtpVersion | .1.3.6.1.4.1.9.9.46.1.1.1.0 |
The version of VTP in use on the local system. A device will report its version capability and not any particular version in use on the device. If the device does not support VTP, the version is none(3). |
|---|---|---|
ciscoVtpVlanState |
|
The state of this VLAN.
The state mtuTooBigForDevice indicates that this device cannot participate in this VLAN because the VLAN’s MTU is larger than the device can support. |
ciscoVtpVlanType |
|
The type of this VLAN. |
ciscoVtpVlanName |
|
The name of this VLAN. This name is used as the ELAN-name for an ATM LAN-Emulation segment of this VLAN. |
Generic information about the CDP process can be found in the CDP Information box on the Node Detail Page of the device. Information gathered from these OIDs will be stored in the following database table:
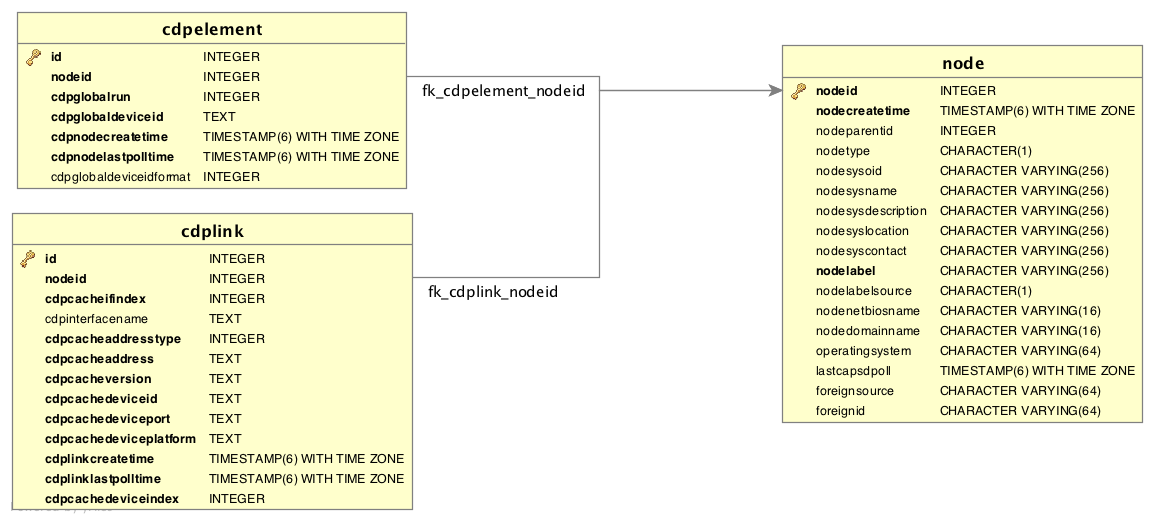
Cdp Topology Updater provide CDP OnmsTopology consolidating cdp data collected by CDP Collector only full bidirectional connections between two Cdp supported devices become Edges. Node A and Node B are connected by an CDP Edge if and only if there is a CDP MIB port connection in Node A to Node B and viceversa.
16.2.3. Transparent Bridge Discovery
Discovering Layer 2 network links using the Bridge Forwarding table requires a special algorithm. To discover Links an algorithm based on a scientific paper with the title Topology Discovery for Large Ethernet Networks is implemented. The gathered information is used to classify Links in macLink and bridgeLink. A macLink represents a Link between a workstation or server identified by a mac address. A bridgeLink is a connection between backbone ports. A Shared Segment is a connection among workstations or servers (several mac addresses) and backbone ports (for example devices connected via an hub). A _bridgeLink is a a shared segment with only two bridge backbone ports. A macLink is a shared segment with only a bridge port and only one mac address. A Broadcast Domain is a collection of Shared Segment baed on common set of mac addresses.
Discovery Bridge Broadcast Domains is made in two step, the first step regards data collection. The Bridge Forwarding Table together with other Spanning Tree information is collected by the BridgeDiscovery Collector. The BTF is not persisted into database and is maintained in memory to be processed by the BridgeDomainDiscovery. BridgeDomainDiscovery runs the specified algorithm over collected BFT and will produce a Bridge Domain or several Bridge domains depending on the broadcasts set of mac addresses found. Bridge Domains are collection of Shared Segments as described above.
BridgeDomainDiscovery does not support multi vlan, the Bridge Network model identify a Bridge for every VLAN. Each VLAN has it’s own Bridge Forwarding Table and it’s own Spanning Tree. So in line to discovery a Bridge Topology the algorithm has to be run against every bridge and every vlan. Actually the discovery is run only against the main VLAN.
Bridge Domains provide no information about layer 3 but only a layer 2 two map of the Broadcast Domains. While Bridge/Switch are identified by the fact that are OpenNMS Nodes to map mac to Nodes where possible the IpNetToMedia table is needed. In this manned we are able to associate to mac address the corresponding ip address and then the associated node. The Bridge Topology Updater put together the information stored into bridge domains with the ipnettomedia data. and provide Bridge OnmsTopology.
Bridge Topology Updater whenever possible tries to associate a mac address to an ip address and then to a node. It can happen that the mac address and the ip address specified are not associate to a single node (for example because there are duplicated node or also because the nodes supports protocol like LACP), in this case we do not resolve the node but leave the association found mac:ip into a specific Vertex.
Bridge Topology Updater do not support LACP protocols and other similar aggregation protocols.
Transparent bridging is not loop free so if you have loops you have to enable the spanning tree protocol that will detect loops and again will put some ports in a blocking state to avoid loops. To get links it is necessary to perform some calculations that let us define the Links. The following MIBS must be supported by the SNMP agent to allow Transparent Bridge Discovery.
Name |
OID |
Description |
vtpVersion |
|
The version of VTP in use on the local system. A device will report its version capability and not any particular version in use on the device. If the device does not support VTP, the version is none(3). |
Name |
OID |
Description |
ipNetToMediaIfIndex |
|
The interface on which this entry’s equivalence is effective. The layer-2 interface identified by a particular value of this index is the same interface as identified by the same value of ifIndex. |
ipNetToMediaPhysAddress |
|
The media-dependent physical address. |
ipNetToMediaNetAddress |
|
The IpAddress corresponding to the media-dependent physical address. |
ipNetToMediaType |
|
The type of mapping. Setting this object to the value invalid(2) has the effect of invalidating the corresponding entry in the ipNetToMediaTable. That is, it effectively dissasociates the interface identified with said entry from the mapping identified with said entry. It is an implementation-specific matter as to whether the agent removes an invalidated entry from the table. Accordingly, management stations must be prepared to receive tabular information from agents that corresponds to entries not currently in use. Proper interpretation of such entries requires examination of the relevant ipNetToMediaType object. |
Name |
OID |
Description |
dot1dBaseBridgeAddress |
|
The MAC address used by this bridge when it must be referred to in a unique fashion. It is recommended that this be the numerically smallest MAC address of all ports that belong to this bridge. However it is only required to be unique. When concatenated with dot1dStpPriority a unique BridgeIdentifier is formed which is used in the Spanning Tree Protocol. |
dot1dBaseNumPorts |
|
The number of ports controlled by this bridging entity. |
dot1dBaseType |
|
Indicates what type of bridging this bridge can perform. If a bridge is actually performing a certain type of bridging this will be indicated by entries in the port table for the given type. |
dot1dBasePort |
|
The port number of the port for which this entry contains bridge management information. |
dot1dPortIfIndex |
|
The value of the instance of the ifIndex object, defined in MIB-II, for the interface corresponding to this port. |
dot1dStpProtocolSpecification |
|
An indication of what version of the Spanning Tree Protocol is being run. The value decLb100(2) indicates the DEC LANbridge 100 Spanning Tree protocol. IEEE 802.1d implementations will return ieee8021d(3). If future versions of the IEEE Spanning Tree Protocol are released that are incompatible with the current version a new value will be defined. |
dot1dStpPriority |
|
The value of the writeable portion of the Bridge ID, i.e., the first two octets of the (8 octet long) Bridge ID. The other (last) 6 octets of the Bridge ID are given by the value of dot1dBaseBridgeAddress. |
dot1dStpDesignatedRoot |
|
The bridge identifier of the root of the spanning tree as determined by the Spanning Tree Protocol as executed by this node. This value is used as the Root Identifier parameter in all configuration Bridge PDUs originated by this node. |
dot1dStpRootCost |
|
The cost of the path to the root as seen from this bridge. |
dot1dStpRootPort |
|
The port number of the port which offers the lowest cost path from this bridge to the root bridge. |
dot1dStpPort |
|
The port number of the port for which this entry contains Spanning Tree Protocol management information. |
dot1dStpPortPriority |
|
The value of the priority field which is contained in the first (in network byte order) octet of the (2 octet long) Port ID. The other octet of the Port ID is given by the value of dot1dStpPort. |
dot1dStpPortState |
|
The port’s current state as defined by application of the Spanning Tree Protocol. This state controls what action a port takes on reception of a frame. If the bridge has detected a port that is malfunctioning it will place that port into the broken(6) state. For ports which are disabled (see dot1dStpPortEnable), this object will have a value of disabled(1). |
dot1dStpPortEnable |
|
The enabled/disabled status of the port. |
dot1dStpPortPathCost |
|
The contribution of this port to the path cost of paths towards the spanning tree root which include this port. 802.1D-1990 recommends that the default value of this parameter be in inverse proportion to the speed of the attached LAN. |
dot1dStpPortDesignatedRoot |
|
The unique Bridge Identifier of the Bridge recorded as the Root in the Configuration BPDUs transmitted by the Designated Bridge for the segment to which the port is attached. |
dot1dStpPortDesignatedCost |
|
The path cost of the Designated Port of the segment connected to this port. This value is compared to the Root Path Cost field in received bridge PDUs. |
dot1dStpPortDesignatedBridge |
|
The Bridge Identifier of the bridge which this port considers to be the Designated Bridge for this port’s segment. |
dot1dStpPortDesignatedPort |
|
The Port Identifier of the port on the Designated Bridge for this port’s segment. |
dot1dTpFdbAddress |
|
A unicast MAC address for which the bridge has forwarding and/or filtering information. |
dot1dTpFdbPort |
|
Either the value '0', or the port number of the port on which a frame having a source address equal to the value of the corresponding instance of dot1dTpFdbAddress has been seen. A value of '0' indicates that the port number has not been learned but that the bridge does have some forwarding/filtering information about this address (e.g. in the dot1dStaticTable). Implementors are encouraged to assign the port value to this object whenever it is learned even for addresses for which the corresponding value of dot1dTpFdbStatus is not learned(3). |
dot1dTpFdbStatus |
|
The status of this entry.
The meanings of the values are: |
Name |
OID |
Description |
dot1qTpFdbPort |
|
Either the value 0, or the port number of the port on which a frame having a source address equal to the value of the corresponding instance of dot1qTpFdbAddress has been seen. A value of 0 indicates that the port number has not been learned but that the device does have some forwarding/filtering information about this address (e.g., in the dot1qStaticUnicastTable). Implementors are encouraged to assign the port value to this object whenever it is learned, even for addresses for which the corresponding value of dot1qTpFdbStatus is not learned(3). |
dot1qTpFdbStatus |
|
The status of this entry.
The meanings of the values are: |
Generic information about the bridge link discovery process can be found in the Bridge Information box on the Node Detail Page of the device. Information gathered from this OID will be stored in the following database table:
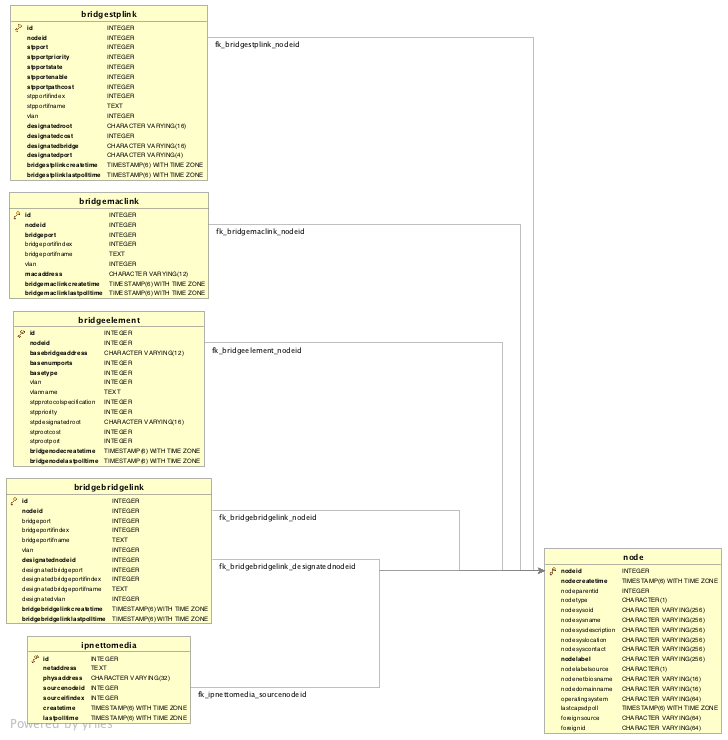
16.3. Layer 3 Link Discovery
With Enlinkd it is possible to get Links based on network routing applications. The following routing daemons can be used to provide a discovery of links based Layer 3 information:
This information is provided by SNMP Agents with appropriate MIB support. For this reason it is required to have a working SNMP configuration running. The link data discovered from Enlinkd is provided in the Topology User Interface and on the detail page of a node.
16.3.1. OSPF Discovery
The following MIBSs are supported to discover and build the OSPF network topology and are collected by the OSPF Discovery Collector.
The relevant MIBs for OSPF topology are OSPF-MIB and OSPF-TRAP-MIB. In these MIBs are defined the relevant objects used to find OSPF links, specifically:
-
The Router ID which, in OSPF, has the same format as an IP address
-
But identifies the router independent of its IP address.
Also all the interfaces are identified by their IP addresses. The OSPF links come from the SNMP ospfNbrTable defined in OSPF-MIB and this table is in practice persisted in the ospfLink table:
| Name | OID | Description |
|---|---|---|
ospfRouterId |
|
A 32-bit integer uniquely identifying the router in the Autonomous System. By convention, to ensure uniqueness, this should default to the value of one of the router’s IP interface addresses. This object is persistent and when written the entity should save the change to non-volatile storage. |
ospfAdminStat |
|
The administrative status of OSPF in the router. The value enabled denotes that the OSPF Process is active on at least one interface; disabled disables it on all interfaces. This object is persistent and when written the entity should save the change to non-volatile storage. |
ospfVersionNumber |
|
The current version number of the OSPF protocol is 2. |
ospfAreaBdrRtrStatus |
|
A flag to note whether this router is an Area Border Router. |
ospfAreaASBdrRtrStatus |
|
A flag to note whether this router is configured as an Autonomous System Border Router. This object is persistent and when written the entity should save the change to non-volatile storage. |
ospfIfIpAddress |
|
The IP address of this OSPF interface. |
ospfAddressLessIf |
|
For the purpose of easing the instancing of addressed and addressless interfaces; this variable takes the value 0 on interfaces with IP addresses and the corresponding value of ifIndex for interfaces having no IP address. |
ospfNbrIpAddr |
|
The IP address this neighbor is using in its IP source address. Note that, on addressless links, this will not be 0.0.0.0 but the address of another of the neighbor’s interfaces. |
ospfNbrAddressLessIndex |
|
On an interface having an IP address, zero. On addressless interfaces, the corresponding value of ifIndex in the Internet Standard MIB. On row creation, this can be derived from the instance. |
ospfNbrRtrId |
|
A 32-bit integer (represented as a type IpAddress) uniquely identifying the neighboring router in the Autonomous System. |
| Name | OID | Description |
|---|---|---|
ipAdEntIfIndex |
|
The index value which uniquely identifies the interface to which this entry is applicable. The interface identified by a particular value of this index is the same interface as identified by the same value of the IF-MIB’s ifIndex. |
ipAdEntNetMask |
|
The subnet mask associated with the IPv4 address of this entry. The value of the mask is an IPv4 address with all the network bits set to 1 and all the hosts bits set to 0. |
Generic information about the OSPF link discovery process can be found in the OSPF Information box on the Node Detail Page of the device. Information gathered from these OIDs will be stored in the following database table:
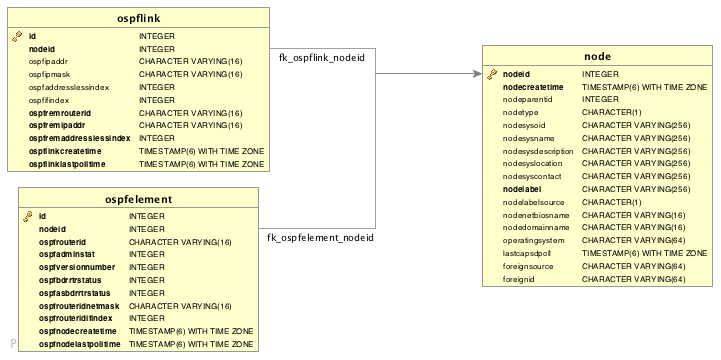
OSPF Topology Updater provide OSPF OnmsTopology consolidating OSPF data collected by OSPF Collector only full bidirectional connections between two OSPF supported devices become Edges. Node A and Node B are connected by an OSPF Edge if and only if there is a OSPF link in Node A to Node B and viceversa.
16.3.2. IS-IS Discovery
IS-IS Links are found in the isisISAdjTable that is defined in ISIS-MIB (mib-rfc4444.txt). In this table is found the information needed to find the Adjacency Intermediate System. The information about IS-IS is stored into two tables: isisElement and isisLink. isisElement contains the ISISSysID, a unique identifier of the "Intermediate System" (the name for the Router in ISO protocols). Each entry in this SNMP MIB table represents a unidirectional link from the Intermediate System that is queried to the Adjacent Intermediate Systems running IS-IS and "peering" with the source router. If two routers IS-A and IS-B support ISIS-MIB, then EnLinkd will create two link entries in OpenNMS Horizon: one from IS-A to IS-B (from the adjtable of IS-A) the complementary link back from IS-B to IS-A (from the adjTable of _IS-B). IS-IS links are represented in the ISIS-MIB as follows:
The following OIDs are supported to discover and build the ISIS network topology and are collected by the ISIS Discovery Collector.
| Name | OID | Description |
|---|---|---|
isisSysID |
|
The ID for this Intermediate System. This value is appended to each of the area addresses to form the Network Entity Titles. The derivation of a value for this object is implementation specific. Some implementations may automatically assign values and not permit an SNMP write, while others may require the value to be set manually. Configured values must survive an agent reboot. |
isisSysAdminState |
|
The administrative state of this Intermediate System.
Setting this object to the value |
isisSysObject |
|
isisSysObject |
isisCircIfIndex |
|
The value of ifIndex for the interface to which this circuit corresponds. This object cannot be modified after creation. |
isisCircAdminState |
|
The administrative state of the circuit. |
isisISAdjState |
|
The state of the adjacency. |
isisISAdjNeighSNPAAddress |
|
The SNPA address of the neighboring system. |
isisISAdjNeighSysType |
|
The type of the neighboring system. |
isisISAdjNeighSysID |
|
The system ID of the neighboring Intermediate System. |
isisISAdjNbrExtendedCircID |
|
The 4-byte Extended Circuit ID learned from the Neighbor during 3-way handshake, or 0. |
Generic information about the IS-IS link discovery process can be found in the IS-IS Information box on the Node Detail Page of the device. Information gathered from this OIDs will be stored in the following database table:
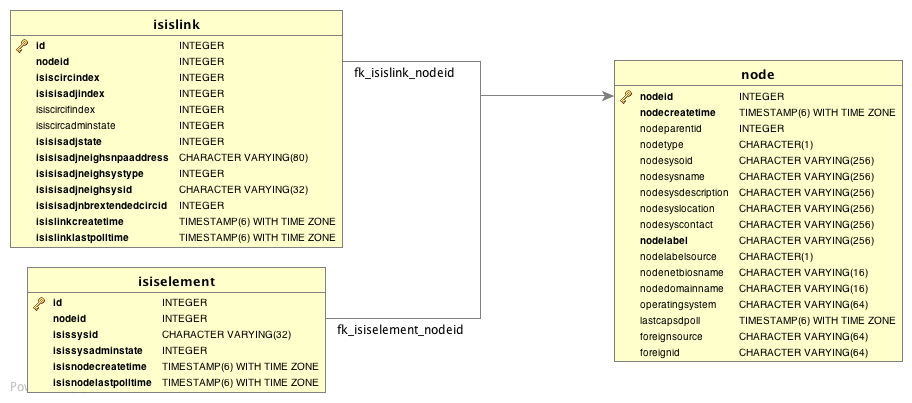
ISIS Topology Updater provide ISIS OnmsTopology consolidating Is-IS data collected by ISIS Collector only full bidirectional connections between two ISIS supported devices become Edges. Node A and Node B are connected by an ISIS Edge if and only if there is a ISIS link in Node A to Node B and viceversa.
17. OpenTracing
17.1. Introduction
OpenTracing enables distributed tracing which makes it possible to monitor RPCs or transactions across process boundaries. This functionality can be leveraged to help track and diagnose communication problems that may arise in distributed deployments of OpenNMS Horizon that leverage Minion and/or Sentinel. OpenNMS Horizon currently supports Jaeger which implements the OpenTracing API.
OpenTracing is now supported on RPC calls between Minion and OpenNMS Horizon and Sink API calls (including flows) between Minion and Sentinel or OpenNMS Horizon.
17.1.1. Enabling Tracing on OpenNMS Horizon
By default the tracing instrumentation OpenNMS Horizon is disabled (a no-op tracer is used.)
Enable tracing with Jeager as follows:
echo 'org.opennms.core.tracer=jaeger' >> "$OPENNMS_HOME/etc/opennms.properties.d/jaeger.properties"
echo 'opennms-core-tracing-jaeger' >> "$OPENNMS_HOME/etc/featuresBoot.d/jaeger.boot"Restart OpenNMS Horizon to apply the changes.
Additional Jaeger tracing options can be added to the jaeger.properties file specified above.
Available configuration options are listed here.
17.1.2. Enabling Tracing on Minion
Enable tracing with Jaeger on Minion by installing the opennms-core-tracing-jaeger feature.
echo 'opennms-core-tracing-jaeger' >> "$MINION_HOME/etc/featuresBoot.d/jaeger.boot"
Uninstalling the opennms-core-tracing-jaeger feature at runtime is not yet supported.
To disable tracing with Jaeger, remove the reference from the features boot file and restart Minion.
|
Additional Jaeger tracing options can be added to $MINION_HOME/etc/system.properties on Minion.
Available configuration options are listed here.
17.1.3. Enabling Tracing on Sentinel
Enable tracing with Jaeger on Sentinel by installing the opennms-core-tracing-jaeger feature.
echo 'opennms-core-tracing-jaeger' >> "$SENTINEL_HOME/etc/featuresBoot.d/jaeger.boot"
Either sentinel-flows or sentinel-telemetry need to be installed before installing opennms-core-tracing-jaeger feature.
Uninstalling the opennms-core-tracing-jaeger feature at runtime is not yet supported.
To disable tracing with Jaeger, remove the reference from the features boot file and restart Sentinel.
|
Additional Jaeger tracing options can be added to $SENTINEL_HOME/etc/system.properties on Sentinel.
Available configuration options are listed here.
18. Operation
18.1. HTTPS / SSL
This chapter covers the possibilities to configure OpenNMS Horizon to protect web sessions with HTTPS and also explains how to configure OpenNMS Horizon to establish secure connections.
In order to use HTTPS the Java command line tool keytool is used.
It is automatically shipped with each JRE installation.
More details about the keytool can be found at the official documentation.
|
18.1.1. Standalone HTTPS with Jetty
To configure OpenNMS Horizon to protect web sessions with HTTPS, see How to setup SSL with Jetty.
18.1.2. OpenNMS Horizon as HTTPS client
To establish secure HTTPS connections within Java one has to setup a so called Java Trust Store.
The Java Trust Store contains all certificates a Java application should trust when making connections as a client to a server.
Setup Java Trust Store
To setup the Java Trust Store the following command can be issued.
| If you do not have a Java Trust Store setup yet, it is created automatically. |
keytool \
-import \ (1)
-v \ (2)
-trustcacerts \ (3)
-alias localhost \ (4)
-file localhost.cert \ (5)
-keystore /$OPENNMS_HOME/etc/trust-store.jks (6)| 1 | Define to import a certificate or a certificate chain |
| 2 | Use verbose output |
| 3 | Define to trust certificates from cacerts |
| 4 | The alias for the certificate to import, e.g. the common name |
| 5 | The certificate to import |
| 6 | The location of the Java Trust Store |
If you create a new Java Trust Store you are asked for a password to protect the Java Trust Store. If you update an already existing Java Trust Store please enter the password you chose when creating the Java Trust Store initially.
Download existing public certificate
To Download an existing public certificate the following command can be issued.
openssl \
s_client \ (1)
-showcerts \ (2)
-connect localhost:443 \ (3)
-servername localhost \ (4)
< /dev/null \ (5)
> localhost.cert (6)| 1 | Use SSL/TLS client functionality of openssl. |
| 2 | Show all certificates in the chain |
| 3 | PORT:HOST to connect to, e.g. localhost:443 |
| 4 | This is optional, but if you are serving multiple certificates under one single ip address you may define a server name, otherwise the ip of localhost:PORT certificate is returned which may not match the requested server name (mail.domain.com, opennms.domain.com, dns.domain.com) |
| 5 | No input |
| 6 | Where to store the certificate. |
Configure OpenNMS Horizon to use the defined Java Trust Store
To setup OpenNMS Horizon to use the defined Java Trust Store the according javax.net.ssl.trustStore* properties have to be set.
Open $OPENNMS_HOME/etc/opennms.properties and add the properties javax.net.ssl.trustStore and javax.net.ssl.trustStorePassword as shown below.
javax.net.ssl.trustStore=/$OPENNMS_HOME/etc/trust-store.jks (1)
javax.net.ssl.trustStorePassword=change-me (2)| 1 | The location of the Java Trust Store |
| 2 | The password of the Java Trust Store |
For more details on the Java build-in SSL System properties have a look at chapter Debugging / Properties.
| Each time you modify the Java Trust Store you have to restart OpenNMS Horizon to have the changes take effect. |
18.1.3. Differences between Java Trust Store and Java Key Store
The Java Trust Store is used to determine whether a remote connection should be trusted or not, e.g. whether a remote party is who it claims to be (client use case).
The Java Key Store is used to decide which authentication credentials should be sent to the remote host for authentication during SSL handshake (server use case).
For more details, please check the JSSE Reference Guide.
18.1.4. Debugging / Properties
If you encounter issues while using HTTPS it might be useful to enable debugging or use one of the build-in Java System Properties to configure the proper use of SSL.
| System Property Name | Description |
|---|---|
|
Location of the Java keystore file containing an application process’s own certificate and private key.
On Windows, the specified pathname must use forward slashes, |
|
Password to access the private key from the keystore file specified by |
|
(Optional) For Java keystore file format, this property has the value |
|
Location of the Java keystore file containing the collection of CA certificates trusted by this application process (trust store). On Windows, the specified pathname must use forward slashes, |
|
Password to unlock the keystore file (store password) specified by |
|
(Optional) For Java keystore file format, this property has the value |
|
To switch on logging for the SSL/TLS layer, set this property to ssl. More details about possible values can be found here. |
18.2. Request Logging
HTTP requests logs for Jetty can be enabled by uncommenting the following snippet in etc/jetty.xml:
<!-- NCSA Request Logging
<Item>
<New id="RequestLog" class="org.eclipse.jetty.server.handler.RequestLogHandler">
<Set name="requestLog">
<New id="RequestLogImpl" class="org.eclipse.jetty.server.NCSARequestLog">
<Arg>logs/jetty-requests-yyyy_mm_dd.log</Arg>
<Set name="retainDays">90</Set>
<Set name="append">true</Set>
<Set name="extended">true</Set>
<Set name="logTimeZone">US/Central</Set>
</New>
</Set>
</New>
</Item>
-->
If you do not have a jetty.xml in the etc directory, you can start by copying the example from etc/examples/jetty.xml.
|
If you would like the include the usernames associated with the requests in the log file, you must also uncomment the following snippet in jetty-webapps/opennms/WEB-INF/web.xml:
<!-- Enable this filter mapping when using NCSA request logging
<filter-mapping>
<filter-name>jettyUserIdentityFilter</filter-name>
<url-pattern>/*</url-pattern>
</filter-mapping>
-->After restarting OpenNMS Horizon, requests logs of the following form should be available in logs/jetty-requests-*.log:
127.0.0.1 - - [02/Jun/2017:09:16:38 -0500] "GET / HTTP/1.1" 302 0 "-" "Mozilla/5.0 (X11; Fedora; Linux x86_64) AppleWebKit/537.36 (KHTML, like Gecko) Chrome/5
8.0.3029.110 Safari/537.36"
127.0.0.1 - anonymousUser [02/Jun/2017:09:16:39 -0500] "GET /opennms/ HTTP/1.1" 302 0 "-" "Mozilla/5.0 (X11; Fedora; Linux x86_64) AppleWebKit/537.36 (KHTML, like Gecko) Chrome/58.0.3029.110 Safari/537.36"
127.0.0.1 - admin [02/Jun/2017:09:16:46 -0500] "POST /opennms/rest/datachoices?action=enable HTTP/1.1" 200 0 "http://127.0.0.1:8980/opennms/index.jsp" "Mozilla/5.0 (X11; Fedora; Linux x86_64) AppleWebKit/537.36 (KHTML, like Gecko) Chrome/58.0.3029.110 Safari/537.36"
127.0.0.1 - rtc [02/Jun/2017:09:16:45 -0500] "POST /opennms/rtc/post/DNS+and+DHCP+Servers HTTP/1.1" 200 35 "-" "Java/1.8.0_121"18.3. Geocoder Service
The Geocoder Service is used to resolve geolocation information within OpenNMS Horizon. OpenNMS Horizon supports several Geocoder Services. By default geolocation resolution is disabled.
| To enable or configure the Geocoder Service please use the web based configuration tool. This can be found in the administration section: Admin → Configure Geocoder Service |
The currently used Geocoder Service is configured via the property activeGeocoderId in etc/org.opennms.features.geocoder.cfg.
18.3.1. Google
The Google Geocoder API requires at least an apiKey or a clientId and signature.
For more details please refer to the official documentation.
The following properties in etc/org.opennms.features.geocoder.google.cfg are supported:
| Property | Type | Required | Default | Description |
|---|---|---|---|---|
|
|
|
empty string |
Is only required if |
|
|
|
|
If authentication with |
|
|
|
empty string |
Is only required if |
|
|
|
empty string |
The Google Geocoder API |
|
|
|
|
Should the system wide proxy settings be used? The system proxy settings can be configured in opennms.conf |
|
|
|
|
The connection timeout in milliseconds the Geocoder tries to resolve a single geolocation. |
18.3.2. Mapquest
For more details please refer to the official documentation.
The following properties in etc/org.opennms.features.geocoder.mapquest.cfg are supported:
| Property | Type | Required | Default | Description |
|---|---|---|---|---|
|
|
|
empty string |
The |
|
|
|
The url template for the Mapquest Geocoder API.
The |
|
|
|
|
|
Should the system wide proxy settings be used? The system proxy settings can be configured in opennms.conf |
18.3.3. Nominatim
For more details please refer to the official documentation and ensure to check out the Nominatim Usage Policy before using the Geocoder Service.
The following properties in etc/org.opennms.features.geocoder.nominatim.cfg are supported:
| Property | Type | Required | Default | Description |
|---|---|---|---|---|
|
|
|
|
In order to use the Nominatim Geocoder Service the
Nominatim Usage Policy must be accepted.
Set this to |
|
|
|
|
The url template for the Nominatim Geocoder API.
The |
|
|
|
empty string |
According to the official documentation, this should be provided in case you are making a large number of requests.
Alternatively provide this information in the |
|
|
either |
empty string |
According to the Nominatim Usage Policy
please provide either a |
|
|
either |
|
According to the Nominatim Usage Policy
please provide either a |
|
|
|
false |
Should the system wide proxy settings be used? The system proxy settings can be configured in system properties |
18.4. newts-repository-converter: Rrd/Jrb to Newts migration utility
This utility can be used to migrate existing RRDTool- or JRobin-based data to a Newts cluster.
This will be achieved by traversing the share/rrd directory and its subdirectories, reading the data and properties files and persisting this data to Newts.
18.4.1. Migration
The following suggestions try to minimize the data collection gap that occur when reconfiguring OpenNMS Horizon for a different storage strategy. First, we determine the parameters needed for migration of the existing data. After that, we reconfigure OpenNMS Horizon to persists all new collected data to Newts storage. Finally, the Rrd- or JRobin-based data will be converted and persisted to Newts using the newts-repository-converter utility.
Prerequisites
-
Working OpenNMS Horizon installation with RRDTool- or JRobin-based storage strategy configured.
-
Installed and working Newts cluster reachable by the OpenNMS Horizon instance.
Migration plan
-
Check and write down the values for the following options in your
opennms.propertiesfile. You will need these information later to invoke the newts-repository-converter utility.-
File
etc/opennms.properties:-
Check for the entry
org.opennms.rrd.storeByGroupwhetherstoreByGroupis enabled. -
Check for the entry
rrd.base.dirfor the location where Rrd or Jrb files are stored. -
Check for the entry
rrd.binaryfor the location of the RRDTool binary.
-
-
File
etc/rrd-configuration.properties:-
Check for the entry
org.opennms.rrd.strategyClasswhetherJRobinRrdStrategy(JRobin) orJniRrdStrategy/MultithreadedJniRrdStrategy(RRDTool) is used.
-
-
-
Stop your OpenNMS Horizon instance.
-
Reconfigure OpenNMS Horizon to persist data to Newts - so, when correctly configured all new samples will be persisted into Newts after OpenNMS Horizon is started. Note, that the converter assumes storeByForeignSource to be enabled.
-
Start your OpenNMS Horizon instance.
-
Use the newts-repository-converter utility to convert the existing data to Newts by specifying the options that correspond to the information gathered during step #1.
This procedure will minimize the data collection gap to the time needed to reconfigure OpenNMS Horizon for Newts storage.
| The newts_converter utility needs the path to the base directory of your OpenNMS Horizon instance for reading the configuration files. For instance the utility needs the datasource configuration during the migration process to query the database to lookup node data. |
18.4.2. Usage
The utility is installed by default and its wrapper script is located in the ${OPENNMS_HOME}/bin directory.
$ cd /path/to/opennms/bin
$ ./newts-repository-converter| When invoked without parameters the usage and help information is printed. |
The newts-repository-converter tool provide the following options and parameters:
| Short-option | Long-option | Description | Default |
|---|---|---|---|
|
|
Prints help and usage information |
false |
|
|
OpenNMS Horizon Home Directory |
/opt/opennms |
|
|
The path to the RRD data |
ONMS-HOME/share/rrd |
|
|
Whether to use rrdtool or JRobin |
|
|
|
The binary path to the rrdtool command (only used if rrd-tool is set) |
/usr/bin/rrdtool |
|
|
Whether store by group was enabled or not |
|
|
|
Number of conversion threads |
defaults to number of CPUs |
18.4.3. Example 1: convert Rrd-based data with storeByGroup enabled
The following example shows how to convert RRDTool-based data that was stored with storeByGroup enabled.
The OpenNMS Horizon home is /opt/opennms, the data directory is /opt/opennms/share/rrd and the RRDTool binary located at /usr/local/bin/rrdtool.
This program call will use 16 concurrent threads to convert the Rrd files.
$ ./newts-repository-converter -t true -s true -T /usr/local/bin/rrdtool -n 16
<output omitted>18.4.4. Example 2: convert JRobin-based data with storeByGroup disabled
The following example shows how to convert JRobin-based data located in the directory /mnt/opennms/rrd that was collected with storeByGroup disabled.
This program call will use 8 concurrent threads to convert the Jrb files.
$ ./newts-repository-converter -t false -s false -r /mnt/opennms/rrd -n 8
<output omitted>18.5. Configuration Tester
To identify configuration problems there is a config-tester located in $OPENNMS_HOME/bin/.
Use config-tester to check configuration files.
Type -l, --list to view the list of files checked.
It prints issues into output.log.
The tool can be used while OpenNMS is running to check configuration beforehand.
Possible Parameters:
---
$OPENNMS_HOME/bin/config-tester -h
usage: config-tester -a
OR: config-tester [config files]
OR: config-tester -l
OR: config-tester -h
-a,--all check all supported configuration files
-h,--help print this help and exit
-i,--ignore-unknown ignore unknown configuration files and continue
processing
-l,--list list supported configuration files and exit
-v,--verbose list each configuration file as it is tested
---18.6. Newts
This section describes how to configure OpenNMS Horizon to use Newts and how to use OpenNMS Horizon to monitor your Cassandra cluster.
18.6.1. Configuration
Enabling Newts
OpenNMS Horizon can be configured to use Newts by setting the following property in in ${OPENNMS_HOME}/etc/opennms.properties:
org.opennms.timeseries.strategy=newtsIt is also highly recommended that resources stored in Newts are referenced by their foreign source and foreign ID, as opposed to their database ID. To this end, the following property should also be set in the same file:
org.opennms.rrd.storeByForeignSource=trueWith these set, OpenNMS Horizon will begin persisting metrics using the Newts engine when restarted.
Additional configuration options are presented in the next section.
Configuration Reference
The following properties, found in ${OPENNMS_HOME}/etc/opennms.properties, can be used to configure and tune Newts.
General
| Name | Default | Description |
|---|---|---|
|
|
Name of the keyspace to use. |
|
|
IP address or hostnames of the Cassandra nodes. Multiple hosts can be separated by a comma. |
|
|
CQL port used to connect to the Cassandra nodes. |
|
|
Username to use when connecting to Cassandra via CQL. |
|
|
Password to use when connecting to Cassandra via CQL. |
|
|
Enable/disable SSL when connecting to Cassandra. |
|
Driver default |
Core number of connections per host. |
|
Driver default |
Maximum number of connections per host. |
|
Driver default |
Maximum amount of requests that can be in-flight on a single connection at the same time. |
|
|
Consistency level used for read operations. See Configuring data consistency for a list of available options. |
|
|
Consistency level used for write operations. See Configuring data consistency for a list of available options. |
|
|
Maximum number of records to insert in a single transaction. Limited by the size of the Cassandra cluster’s batch_size_fail_threshold_in_kb property. |
|
|
Maximum number of records that can be held in the ring buffer. Must be a power of two. |
|
|
Number of threads used to pull samples from the ring buffer and insert them into Newts. |
|
|
Number of seconds after which samples will automatically be deleted. Defaults to one year. |
|
|
Duration in seconds for which samples will be stored at the same key. Defaults to 7 days in seconds. |
|
|
Minimum step size in milliseconds. Used to prevent large queries. |
|
|
If no interval is specified in the query, the step will be divided into this many intervals when aggregating values. |
|
|
Duration in milliseconds. Used when no heartbeat is specified. Should generally be 1.5x your largest collection interval. |
|
Number of cores |
Maximum number of threads that can be used to compute aggregates. Defaults to the number of available cores. |
|
See bellow |
Canonical name of the class used for resource level caching. See the table bellow for all of the available options. |
|
|
Maximum number of records to keep in the cache when using an in-memory caching strategy. |
|
|
Disables the processing of counter wraps, replacing these with NaNs instead. |
|
|
Disables the cache primer, which pre-emptively loads the cache with indexed resources on start-up. |
|
|
Block startup for this many milliseconds while waiting for the cache to be primed.
Set this value to |
Available caching strategies include:
| Name | Class | Default |
|---|---|---|
In-Memory Cache |
|
Y |
Redis-based Cache |
|
N |
Redis Cache
When enabled, the following options can be used to configure the Redis-based cache.
| Name | Default | Description |
|---|---|---|
|
|
IP address of hostname of the Redis server. |
|
|
TCP port used to connect to the Redis server. |
Recommendations
You will likely want to change the values of cache.max_entries and the ring_buffer_size to suit your installation.
Meta-data related to resources are cached in order to avoid writing redundant records in Cassandra.
If you are collecting data from a large number of resources, you should increase the cache.max_entries to reflect the number of resources you are collecting from, with a suitable buffer.
The samples gathered by the collectors are temporarily stored in a ring buffer before they are persisted to Cassandra using Newts.
The value of the ring_buffer_size should be increased if you expect large peaks of collectors returning at once or latency in persisting these to Cassandra.
However, note that the memory used by the ring buffer is reserved, and larger values may require an increased heap size.
Cache priming is used to help reduce the number of records that need to be indexed after restarting OpenNMS Horizon. This works by rebuilding the cache using the index data that has already been persisted in Cassandra. If you continue to see large spikes of index related inserts after rebooting you may want to consider increasing the amount of time spent priming the cache.
18.6.2. Cassandra Monitoring
This section describes some of the metrics OpenNMS Horizon collects from a Cassandra cluster.
| JMX must be enabled on the Cassandra nodes and made accessible from _OpenNMS Horizon in order to collect these metrics. See Enabling JMX authentication for details. |
| The data collection is bound to the agent IP interface with the service name JMX-Cassandra. The JMXCollector is used to retrieve the MBean entities from the Cassandra node. |
Client Connections
The number of active client connections from org.apache.cassandra.metrics.Client are collected:
| Name | Description |
|---|---|
|
Metrics for connected native clients |
|
Metrics for connected thrift clients |
Compaction Bytes
The following compaction manager metrics from org.apache.cassandra.metrics.Compaction are collected:
| Name | Description |
|---|---|
|
Number of bytes compacted since node started |
Compaction Tasks
The following compaction manager metrics from org.apache.cassandra.metrics.Compaction are collected:
| Name | Description |
|---|---|
|
Estimated number of completed compaction tasks |
|
Estimated number of pending compaction tasks |
Storage Load
The following storage load metrics from org.apache.cassandra.metrics.Storage are collected:
| Name | Description |
|---|---|
|
Total disk space (in bytes) used by this node |
Storage Exceptions
The following storage exception metrics from org.apache.cassandra.metrics.Storage are collected:
| Name | Description |
|---|---|
|
Number of unhandled exceptions since start of this Cassandra instance |
Dropped Messages
Measurement of messages that were DROPPABLE.
These ran after a given timeout set per message type so was thrown away.
In JMX these are accessible via org.apache.cassandra.metrics.DroppedMessage.
The number of dropped messages in the different message queues are good indicators whether a cluster can handle its load.
| Name | Stage | Description |
|---|---|---|
|
MutationStage |
If a write message is processed after its timeout (write_request_timeout_in_ms) it either sent a failure to the client or it met its requested consistency level and will relay on hinted handoff and read repairs to do the mutation if it succeeded. |
|
MutationStage |
If a write message is processed after its timeout (write_request_timeout_in_ms) it either sent a failure to the client or it met its requested consistency level and will relay on hinted handoff and read repairs to do the mutation if it succeeded. |
|
MutationStage |
Times out after write_request_timeout_in_ms. |
|
ReadStage |
Times out after read_request_timeout_in_ms. No point in servicing reads after that point since it would of returned error to client. |
|
ReadStage |
Times out after range_request_timeout_in_ms. |
|
RequestResponseStage |
Times out after request_timeout_in_ms. Response was completed and sent back but not before the timeout |
Thread pools
Apache Cassandra is based on a so called Staged Event Driven Architecture (SEDA). This seperates different operations in stages and these stages are loosely coupled using a messaging service. Each of these components use queues and thread pools to group and execute their tasks. The documentation for Cassandra Thread pool monitoring is originated from Pythian Guide to Cassandra Thread Pools.
| Name | Description |
|---|---|
|
Tasks that are currently running |
|
Tasks that have been completed |
|
Tasks that have been blocked due to a full queue |
|
Tasks queued for execution |
Memtable FlushWriter
Sort and write memtables to disk from org.apache.cassandra.metrics.ThreadPools.
A vast majority of time this backing up is from over running disk capability.
The sorting can cause issues as well however.
In the case of sorting being a problem, it is usually accompanied with high load but a small amount of actual flushes (seen in cfstats).
Can be from huge rows with large column names, i.e. something inserting many large values into a CQL collection.
If overrunning disk capabilities, it is recommended to add nodes or tune the configuration.
| Alerts: pending > 15 || blocked > 0 |
Memtable Post Flusher
Operations after flushing the memtable. Discard commit log files that have had all data in them in sstables. Flushing non-cf backed secondary indexes.
| Alerts: pending > 15 || blocked > 0 |
Anti Entropy Stage
Repairing consistency. Handle repair messages like merkle tree transfer (from Validation compaction) and streaming.
| Alerts: pending > 15 || blocked > 0 |
Gossip Stage
Post 2.0.3 there should no longer be issue with pending tasks. Instead monitor logs for a message:
Gossip stage has {} pending tasks; skipping status check ...Before that change, in particular older versions of 1.2, with a lot of nodes (100+) while using vnodes can cause a lot of CPU intensive work that caused the stage to get behind.
Been known to of been caused with out of sync schemas.
Check NTP working correctly and attempt nodetool resetlocalschema or the more drastic deleting of system column family folder.
| Alerts: pending > 15 || blocked > 0 |
Migration Stage
Making schema changes
| Alerts: pending > 15 || blocked > 0 |
MiscStage
Snapshotting, replicating data after node remove completed.
| Alerts: pending > 15 || blocked > 0 |
Mutation Stage
Performing a local including:
-
insert/updates
-
Schema merges
-
commit log replays
-
hints in progress
Similar to ReadStage, an increase in pending tasks here can be caused by disk issues, over loading a system, or poor tuning. If messages are backed up in this stage, you can add nodes, tune hardware and configuration, or update the data model and use case.
| Alerts: pending > 15 || blocked > 0 |
Read Stage
Performing a local read. Also includes deserializing data from row cache. If there are pending values this can cause increased read latency. This can spike due to disk problems, poor tuning, or over loading your cluster. In many cases (not disk failure) this is resolved by adding nodes or tuning the system.
| Alerts: pending > 15 || blocked > 0 |
Request Response Stage
When a response to a request is received this is the stage used to execute any callbacks that were created with the original request.
| Alerts: pending > 15 || blocked > 0 |
Read Repair Stage
Performing read repairs.
Chance of them occurring is configurable per column family with read_repair_chance.
More likely to back up if using CL.ONE (and to lesser possibly other non-CL.ALL queries) for reads and using multiple data centers.
It will then be kicked off asynchronously outside of the queries feedback loop.
Note that this is not very likely to be a problem since does not happen on all queries and is fast providing good connectivity between replicas.
The repair being droppable also means that after write_request_timeout_in_ms it will be thrown away which further mitigates this.
If pending grows attempt to lower the rate for high read CFs.
| Alerts: pending > 15 || blocked > 0 |
JVM Metrics
Some key metrics from the running Java virtual machine are also collected:
- java.lang:type=Memory
-
The memory system of the Java virtual machine. This includes heap and non-heap memory
- java.lang:type=GarbageCollector,name=ConcurrentMarkSweep
-
Metrics for the garbage collection process of the Java virtual machine
| If you use Apache Cassandra for running Newts you can also enable additional metrics for the Newts keyspace. |
18.6.3. Newts Monitoring
This section describes the metrics OpenNMS Horizon collects for monitoring the Newts keyspace from org.apache.cassandra.metrics.Keyspace on an Cassandra node.
| JMX must be enabled on the Cassandra nodes and made accessible from _OpenNMS Horizon in order to collect these metrics. See Enabling JMX authentication for details. |
The data collection is bound to the agent IP interface with the service name JMX-Cassandra-Newts. The JMXCollector is used to retrieve the MBean entities from the Cassandra node.
All Memory Table Data Size
| Name | Description |
|---|---|
|
Total amount of live data stored in the memtables (2i and pending flush memtables included) that resides off-heap, excluding any data structure overhead |
|
Total amount of data stored in the memtables (2i and pending flush memtables included) that resides off-heap. |
|
Total amount of data stored in the memtables (2i and pending flush memtables included) that resides on-heap. |
Memtable Switch Count
| Name | Description |
|---|---|
|
Number of times flush has resulted in the memtable being switched out. |
Memtable Columns Count
| Name | Description |
|---|---|
|
Total number of columns present in the memtable. |
Memory Table Data Size
| Name | Description |
|---|---|
|
Total amount of live data stored in the memtable, excluding any data structure overhead |
|
Total amount of data stored in the memtable that resides off-heap, including column related overhead and partitions overwritten. |
|
Total amount of data stored in the memtable that resides on-heap, including column related overhead and partitions overwritten. |
Read and Write Latency
| Name | Description |
|---|---|
|
Local read metrics. |
|
Local write metrics. |
Range Latency
| Name | Description |
|---|---|
|
Local range slice metrics 99th percentile. |
Latency
| Name | Description |
|---|---|
|
|
|
|
|
Bloom Filter Disk Space
| Name | Description |
|---|---|
|
Disk space used by bloom filter |
Bloom Filter Off Heap Memory
| Name | Description |
|---|---|
|
Off heap memory used by bloom filter |
Newts Memory Used
| Name | Description |
|---|---|
|
Off heap memory used by compression meta data |
|
Off heap memory used by index summary |
Pending
| Name | Description |
|---|---|
|
Estimate of number of pending compactions for this column family |
|
Estimated number of tasks pending for this column family |
Disk Space
| Name | Description |
|---|---|
|
Total disk space used by SSTables belonging to this column family including obsolete ones waiting to be garbage collected. |
|
Disk space used by SSTables belonging to this column family |
18.7. Timeseries Integration Layer
This section describes how to configure OpenNMS Horizon to use the Time Series Integration Layer.
Traditionally OpenNMS Horizon supports storing time series data in RRD files on disk or via Newts in Cassandra. These implementations require a deep knowledge of OpenNMS. It is hard to add another time series database.
With the rise of many new time series databases, we want to provide an easy way to support other time series databases with minimal effort. This lead to the development of the Time Series Integration Layer.
The Time Series Integration Layer allows users to integrate a new time series database via OSGi plugin.
Examples of time series plugins:
18.7.1. Configuration
Enabling Time Series Integration Layer
OpenNMS Horizon can be configured to use the Time Series Integration Layer by setting the following property in ${OPENNMS_HOME}/etc/opennms.properties:
org.opennms.timeseries.strategy=integrationAfter activating the Time Series Integration Layer, you need to start an actual implementation. Do this via Karaf. Here is an example of how to activate the in memory time series plugin:
clone & build: git clone git@github.com:opennms-forge/timeseries-integration-inmemory.git mvn install in Karaf shell: bundle:install -s mvn:org.opennms.plugins.timeseries.inmemory/timeseries-inmemory-plugin/1.0.0-SNAPSHOT
For specific instructions, check your plugin description.
We also highly recommend that you reference resources stored in the Time Series Integration Layer by their foreign source and foreign ID, as opposed to their database ID. To this end, set the following property in the same file:
org.opennms.rrd.storeByForeignSource=trueWith these set, OpenNMS Horizon will begin persisting metrics using the Time Series Integration Layer when restarted.
Additional configuration options are presented in the next section.
Configuration Reference
The following properties, found in ${OPENNMS_HOME}/etc/opennms.properties, can be used to configure and tune the Time Series Integration Layer.
General
| Name | Default | Description |
|---|---|---|
|
|
Maximum number of records that can be held in the ring buffer. Must be a power of two. |
|
|
Number of threads used to pull samples from the ring buffer and insert them into the Time Series Database. |
|
|
Minimum step size in milliseconds. Used to prevent large queries. |
|
|
If no interval is specified in the query, the step will be divided into this many intervals when aggregating values. |
|
|
Duration in milliseconds. Used when no heartbeat is specified. Should generally be 1.5x your largest collection interval. |
|
Number of cores |
Maximum number of threads that can be used to compute aggregates. Defaults to the number of available cores. |
|
|
Expiry time in seconds for MetaTagCache. |
|
|
Maximum size for MetaTagCache. |
|
|
Should cache statistics be exposed via JMX for MetaTagCache? |
|
|
Expiry time in seconds for TimeseriesSearcherCache. |
|
|
Maximum size for TimeseriesSearcherCache. |
|
|
Should cache statistics be exposed via JMX for TimeseriesSearcherCache? |
|
|
Expiry time in seconds for TimeseriesMetaDataCache. |
|
|
Maximum size for TimeseriesMetaDataCache. |
|
|
Should cache statistics be exposed via JMX for TimeseriesMetaDataCache? |
Recommendations
Caches have been introduced to improve performance. You might need to tune the cache settings to suit your needs. See parameters above.
| Name | Description |
|---|---|
TimeseriesMetaDataCache |
Caches metadata that uses OpenNMS Horizon internally. |
TimeseriesSearcherCache |
Caches metrics by tag to improve the resource lookup. |
TimeseriesPersisterMetaTagCache |
Caches all additionally configured and resolved meta-tag values by resource. |
The samples gathered by the collectors are temporarily stored in a ring buffer before they are persisted to the Time Series Integration Layer.
The value of the ring_buffer_size should be increased if you expect large peaks of collectors returning at once or latency in persisting these.
However, note that the memory used by the ring buffer is reserved, and larger values may require an increased heap size.
Expose additional meta tags
Metrics that are stored via the time series plugin contain the minimal set of tags for OpenNMS Horizon to work.
This might not be sufficient if the data is used outside of OpenNMS Horizon as well.
Configure additional meta tags via ${OPENNMS_HOME}/etc/opennms.properties.
The configuration of the tags has the following form:
prefix.tagKey=${query expression}
-
The prefix is:
org.opennms.timeseries.tin.metatags.tag -
The tagKey can by an arbitrary string as long as it doesn’t break the java property file syntax.
-
The query expression allows to query the value. Hereby we can make use of the Meta-Data-DSL
Examples:
org.opennms.timeseries.tin.metatags.tag.nodelabel=${node:label}
org.opennms.timeseries.tin.metatags.tag.sysObjectID=${node:sys-object-id}
Expose categories by setting org.opennms.timeseries.tin.metatags.exposeCategories to true.
Example:
org.opennms.timeseries.tin.metatags.exposeCategories=true
will lead to:
Tag("cat_myFirstCategory", "myFirstCategory")
Tag("cat_mySecondCategory", "mySecondCategory")
18.8. Daemon Configuration Files
Configuration changes require a restart of OpenNMS and some daemons are able to reload configuration changes triggered by a daemon reload event. This section gives an overview about all daemons and the related configuration files and which can be reloaded without restarting OpenNMS.
18.8.1. Eventd
| Internal Daemon Name | Reload Event |
|---|---|
Eventd |
|
| File | Restart Required | Reload Event | Description |
|---|---|---|---|
|
yes |
no |
Configure generic behavior of Eventd, i.e. TCP and UDP port numbers with IP addresses to listen for Events and socket timeouts. |
|
no |
yes |
Main configuration file for Eventd. |
|
no |
yes |
Out-of-the-box, all files in this folder are included via |
18.8.2. Notifd
| Internal Daemon Name | Reload Event |
|---|---|
Notifd |
|
| File | Restart Required | Reload Event | Description |
|---|---|---|---|
|
no |
yes |
Describes auto-acknowledge prefix, e.g. prefix "RESOLVED: " for nodeUp/nodeDown events. |
|
no |
no |
Configuration for notification media, e.g. scripts, XMPP or HTTP Post, immediately applied. |
|
no |
no |
Event notification definitions and changes are immediately applied. |
|
no |
no |
Contains paths for notification targets, e.g. JavaMail, XMPP or external scripts. |
|
no |
no |
Contain pager and address information for notification destination paths. |
|
no |
no |
Groups can be used as target for notifications. |
|
no |
no |
Configuration to send notification mails via specific mail servers. |
18.8.3. Pollerd
| Internal Daemon Name | Reload Event |
|---|---|
Pollerd |
|
| File | Restart Required | Reload Event | Description |
|---|---|---|---|
|
yes |
yes |
Restart is required in case new monitors are created or removed. Reload Event loads changed configuration parameters of existing monitors. |
|
no |
no |
Graph definition for response time graphs from monitors |
|
no |
yes |
Can be reloaded with |
18.8.4. Syslogd
| Internal Daemon Name | Reload Event |
|---|---|
Syslogd |
|
Syslogd reload event stops and starts daemon and loads all the syslogd configuration changes.
Syslog daemon can be reloaded with following shell command on karaf.
$ ssh -p 8101 admin@localhost
...
admin@opennms> opennms:reload-daemon syslogd18.8.5. Trapd
| Internal Daemon Name | Reload Event |
|---|---|
Trapd |
|
Trapd reload event stops and starts daemon and loads all the trapd configuration changes.
Trapd daemon can also be reloaded with following shell command on karaf.
$ ssh -p 8101 admin@localhost
...
admin@opennms> opennms:reload-daemon trapd19. System Properties
The global behavior of OpenNMS Horizon is configured with properties files.
Configuration can also affect the Java Virtual Machine under which OpenNMS Horizon runs.
Changes in these properties files require a restart of OpenNMS Horizon.
The configuration files can be found in ${OPENNMS_HOME}/etc.
The priority for Java system properties is as follows:
-
Those set via the Java command line i.e. in
opennms.confviaADDITIONAL_MANAGER_OPTIONS -
opennms.properties.d/*.properties -
opennms.properties -
libraries.properties -
rrd-configuration.properties -
bootstrap.properties
Property files in opennms.properties.d/ are sorted alphabetically.
To avoid conflicts with customized configurations, all custom properties can be added to one or more files in ${OPENNMS_HOME}/etc/opennms.properties.d/.
It is recommended to avoid modification of OpenNMS properties from the default installation.
Create dedicated files with your customized properties in opennms.properties.d/.
|
19.1. Configuring system proxies
System proxy settings may be used with certain OpenNMS Horizon components via the use-system-proxy or useSystemProxy parameters.
To configure system proxy servers, set some or all of the following properties:
| Property | Default | Description |
|---|---|---|
|
None |
Hostname or IP address of proxy server to use for plain HTTP requests |
|
3128 |
TCP port of proxy server to use for plain HTTP requests |
|
None |
Hostname or IP address of proxy server to use for HTTPS requests |
|
3128 |
TCP port of proxy server to use for HTTPS requests |
|
None |
Pipe-separated list of hostnames or IP addresses which bypass HTTP proxying |
|
None |
Pipe-separated list of hostnames or IP addresses which bypass HTTPS proxying |
Depending on the JVM in use, the properties http.proxyUser, http.proxyPassword, and their https.* equivalents may enable the use of proxy servers that require authentication.
|
| Setting these properties may have unintended effects. Use with care. |
20. Ticketing
The ticketing integration allows OpenNMS Horizon to create trouble tickets in external systems. Tickets can be created and updated in response to new and/or resolved alarms.
To activate the ticketing integration, the following properties in ${OPENNMS_HOME}/etc/opennms.properties must be set accordingly:
| Property | Default | Description |
|---|---|---|
|
|
The plugin implementation to use.
Each ticketer integration should define which value to set.
The |
|
|
Defines if the integration is enabled. If enabled various links to control the issue state is shown on the alarm details page. |
opennms.alarmTroubleTicketLinkTemplate |
|
A template to generate a link to the issue, e.g. |
20.1. JIRA Ticketing Plugin
The JIRA Ticketing Plugin is used to create JIRA Issues in response to OpenNMS Horizon alarms.
20.1.1. Setup
First, you’ll need to install the opennms-plugin-ticketer-jira package for your system.
The JIRA ticketing plugin and its dependencies are not part of the core packages.
Now, in order to enable the plugin start by setting following property in ${OPENNMS_HOME}/etc/opennms.properties:
opennms.ticketer.plugin=org.opennms.netmgt.ticketd.OSGiBasedTicketerPluginConfigure the plugin options by setting the following properties in ${OPENNMS_HOME}/etc/jira.properties:
| Name | Description |
|---|---|
|
JIRA Server Url |
|
Username |
|
Password |
|
The key of the project to use. Use |
|
The Issue Type Id to use when opening new issues. Use |
|
Name of the transition to use when resolving issues |
|
Name of the transition to use when re-opening issues |
|
Comma-separated list of JIRA status names for which the ticket should be considered 'Open' |
|
Comma-separated list of JIRA status names for which the ticket should be considered 'Closed' |
|
Comma-separated list of JIRA status names for which the ticket should be considered 'Cancelled' |
|
The time in milliseconds it takes to reload the fields cache.
This is required to prevent the plugin to read the issue type’s meta data every time an issue is created.
A value of 0 disables the cache.
Default value is |
The transition names for resolve and reopen are typically found on buttons when looking at the ticket in JIRA
|
Either use opennms:jist-list-issue-types OSGI Command or https://confluence.atlassian.com/display/JIRA050/Finding+the+Id+for+Issue+Types for determining the appropriate issue type id.
|
Next, add jira-troubleticketer to the featuresBoot property in the ${OPENNMS_HOME}/etc/org.apache.karaf.features.cfg
Restart OpenNMS Horizon.
When OpenNMS Horizon has started again, login to the Karaf Shell and install the feature:
feature:install jira-troubleticketerThe plugin should be ready to use.
20.1.2. Jira Commands
The JIRA Ticketing Plugin provides various OSGI Commands which can be used on the Karaf Shell to help set up the plugin.
There are OSGI Commands to list all available projects, versions, components, groups, issue types and even more.
To list all available commands simply type help | grep jira in the Karaf Shell.
Afterwards you can type for example opennms:jira-list-projects --help to determine the usage of a command.
20.1.3. Custom fields
The OpenNMS Horizon Ticketer model is limited to the most common fields provided by all ticketing systems.
Besides the common fields creator, create date, description or subject, ticket system proprietary fields usually need to be set.
In some cases, even additional - so called - custom fields are defined.
In order to set these fields, the JIRA Ticketing Plugin provides the possibility to define those in the OpenNMS Ticket attributes which can be overwritten with the Usage of Drools.
To enable the Drools Ticketing integration, the following property in ${OPENNMS_HOME}/etc/opennms.properties must be set:
opennms.ticketer.servicelayer=org.opennms.netmgt.ticketd.DroolsTicketerServiceLayerIn addition the property in ${OPENNMS_HOME/etc/drools-ticketer.properties must point to a drools-ticketer-rules.drl file:
drools-ticketer.rules-file=${OPENNMS_HOME/etc/drools-ticketer-rules.drlFinally a Drools Rule file named drools-ticketer-rules.drl must be placed in ${OPENNMS_HOME}/etc.
The following drools example snippet defines attributes to set custom fields:
// Set ticket defaults
rule "TicketDefaults"
salience 100
when
$alarm : OnmsAlarm()
then
ticket.setSummary($alarm.logMsg);
ticket.setDetails($alarm.description);
ticket.addAttribute("customfield_10111", "custom-value");
ticket.addAttribute("customfield_10112", "my-location");
ticket.addAttribute("customfield_10113", "some classification");
endFields must be referenced by their id.
To identify the id of a field, the opennms:jira-list-fields command can be used.
By default only custom fields are shown.
The -s options allows to show all fields.
This may be necessary if JIRA default values need to be set as well, e.g. the Component, the Reporter, the Asignee, etc.
Even the project key or issue type can be defined differently than originally in the jira.properties.
The OpenNMS Ticketer Attribute model only allows to set a String value. However the JIRA model is slightly different. Therefore each String value must be converted to a JIRA field type. The following table describes valid values for an OpenNMS attribute.
| Type | Description |
|---|---|
|
Any string. |
|
Any date in the format of |
|
Any datetime in ISO 8601 format: |
|
The name of the group. |
|
The name of the user. |
|
The key of the project (e.g. |
|
The name of the version. To list all available versions, use |
|
Any string. |
|
The name of the option. |
|
The name of the issuetpye, e.g. |
|
The name of the priority, e.g. |
|
Either the name of the option, or a comma separated list (e.g. |
|
Any valid number (e.g. |
|
If the type is |
As described above the values are usually identified by their name instead of their id (projects are identified by their key).
This is easier to read, but may break the mapping code, if for example the name of a component changes in the future.
To change the mapping from name (or key) to id an entry in jira.properties must be made:
jira.attributes.customfield_10113.resolution=id
To learn more about the Jira REST API please consult the following pages:
The following jira (custom) fields have been tested with jira version 6.3.15:
-
Checkboxes
-
Date Picker
-
Date Time Picker
-
Group Picker (multiple groups)
-
Group Picker (single group)
-
Labels
-
Number Field
-
Project Picker (single project)
-
Radio Buttons
-
Select List (cascading)
-
Select List (multiple choices)
-
Select List (single choice)
-
Text Field (multi-line)
-
Text Field (read only)
-
Text Field (single line)
-
URL Field
-
User Picker (multiple user)
-
User Picker (single user)
-
Version Picker (multiple versions)
-
Version Picker (single version)
| All other field types are mapped as is and therefore may not work. |
Examples
The following output is the result of the command opennms:jira-list-fields -h http://localhost:8080 -u admin -p testtest -k DUM -i Bug -s and lists all available fields for project with key DUM and issue type Bug:
Name Id Custom Type
Affects Version/s versions false array
Assignee assignee false user
Attachment attachment false array
Component/s components false array (1)
Description description false string
Environment environment false string
Epic Link customfield_10002 true any
Fix Version/s fixVersions false array (2)
Issue Type issuetype false issuetype (3)
Labels labels false array
Linked Issues issuelinks false array
Priority priority false priority (4)
Project project false project (5)
Reporter reporter false user
Sprint customfield_10001 true array
Summary summary false string
custom checkbox customfield_10100 true array (6)
custom datepicker customfield_10101 true date| 1 | Defined Components are core, service, web |
| 2 | Defined versions are 1.0.0 and 1.0.1 |
| 3 | Defined issue types are Bug and Task |
| 4 | Defined priorities are Major and Minor |
| 5 | Defined projects are NMS and HZN |
| 6 | Defined options are yes, no and sometimes |
The following snipped shows how to set the various custom fields:
ticket.addAttribute("components", "core,web"); (1)
ticket.addAttribute("assignee", "ulf"); (2)
ticket.addAttribute("fixVersions", "1.0.1"); (3)
ticket.addAttribte("issueType", "Task"); (4)
ticket.addAttribute("priority", "Minor"); (5)
ticket.addAttribute("project", "HZN"); (6)
ticket.addAttribute("summary", "Custom Summary"); (7)
ticket.addAttribute("customfield_10100", "yes,no"); (8)
ticket.addAttribute("customfield_10101", "2016-12-06"); (9)| 1 | Sets the components of the created issue to core and web. |
| 2 | Sets the Asignee of the issue to the user with login ulf. |
| 3 | Sets the fix version of the issue to 1.0.1 |
| 4 | Sets the issue type to Task, overwriting the value of jira.type. |
| 5 | Sets the priority of the created issue to Minor. |
| 6 | Sets the project to HZN, overwriting the value of jira.project. |
| 7 | Sets the summary to Custom Summary, overwriting any previous summary. |
| 8 | Checks the checkboxes yes and no. |
| 9 | Sets the value to 2016-12-06. |
20.1.4. Troubleshooting
When troubleshooting, consult the following log files:
-
${OPENNMS_HOME}/data/log/karaf.log
-
${OPENNMS_HOME}/logs/trouble-ticketer.log
You can also try the opennms:jira-verify OSGI Command to help identifying problems in your configuration.
20.2. Remedy Ticketing Plugin
The Remedy Ticketing Plugin is used to create requests in the BMC Remedy ARS Help Desk Module in response to OpenNMS Horizon alarms.
20.2.1. Remedy Product Overview
It’s important to be specific when discussing Remedy, because BMC Remedy is a suite of products. The OpenNMS Horizon Remedy Ticketing Plugin requires the core Remedy ARS and the Help Desk Module. The Help Desk Module contains a Help Desk Interface Web Service, which serves as the endpoint for creating, updating, and fetching tickets.
The Help Desk Interface (HDI) Web Service requires extensive configuration for its basic operation, and may need additional customization to interoperate with the OpenNMS Horizon Remedy Ticketing Plugin. Contact your Remedy administrator for help with required configuration tasks.
20.2.2. Supported Remedy Product Versions
Currently supported Remedy product versions are listed below:
| Product | Version |
|---|---|
Remedy ARS |
7.6.04 Service Pack 2 |
Help Desk Module |
7.6.04 Service Pack 1 |
HDI Web Service |
Same as Help Desk Module |
20.2.3. Setup
The Remedy Ticketing Plugin and its dependencies are part of the OpenNMS Horizon core packages.
Start by enabling the plugin and the ticket controls in the OpenNMS Horizon web interface, by setting the following properties in ${OPENNMS_HOME}/etc/opennms.properties:
opennms.ticketer.plugin=org.opennms.netmgt.ticketer.remedy.RemedyTicketerPlugin
opennms.alarmTroubleTicketEnabled = trueIn the same file, set the property opennms.alarmTroubleTicketLinkTemplate to a value appropriate for constructing a link to tickets in the Remedy web interface.
A sample value is provided but must be customized for your site; the token ${id} will be replaced with the Remedy ticket ID when the link is rendered.
Now configure the plugin itself by setting the following properties in ${OPENNMS_HOME}/etc/remedy.properties:
| Name | Required | Description |
|---|---|---|
|
required |
Username for authenticating to Remedy |
|
required |
Password for authenticating to Remedy |
|
optional |
Authentication style to use |
|
optional |
Locale for text when creating and updating tickets |
|
optional |
Timezone for interaction with Remedy |
|
required |
The endpoint URL of the HPD web service |
|
required |
The Port name of the HPD web service |
|
required |
The endpoint location of the Create-HPD web service |
|
required |
The Port name of the Create-HPD web service |
|
optional |
Colon-separated list of Remedy groups to which created tickets may be assigned ( |
|
optional |
Assigned group for the target group |
|
optional |
Assigned support company for the target group |
|
optional |
Assigned support organization for the target group |
|
required |
Default group to assign the ticket in case the ticket itself lacks information about a target assigned group |
|
required |
First name for ticket creation and updating. Must exist in Remedy. |
|
required |
Last name for ticket creation and updating. Must exist in Remedy. |
|
required |
A valid Remedy Service CI for ticket creation |
|
required |
A valid Remedy Service CI Reconciliation ID for ticket creation |
|
required |
A valid default assigned support company for ticket creation |
|
required |
A valid default assigned support organization for ticket creation |
|
required |
A valid categorization tier (primary) for ticket creation |
|
required |
A valid categorization tier (secondary) for ticket creation |
|
required |
A valid categorization tier (tertiary) for ticket creation |
|
required |
A valid service type for ticket creation |
|
required |
A valid Reported Source for ticket creation |
|
required |
A valid value for Impact, used in ticket creation |
|
required |
A valid value for Urgency, used in ticket creation |
|
required |
The reason code set in Remedy when the ticket is reopened in OpenNMS Horizon |
|
required |
The reason code set in Remedy when the ticket is closed in OpenNMS Horizon |
|
required |
The reason code set in Remedy when the ticket is cancelled in OpenNMS Horizon |
| The values for many of the required properties are site-specific; contact your Remedy administrator for assistance. |
Restart OpenNMS Horizon.
The plugin should be ready to use. When troubleshooting, consult the following log files:
-
${OPENNMS_HOME}/logs/trouble-ticketer.log
20.3. TSRM Ticketing Plugin
The TSRM Ticketing Plugin is used to create TSRM incidents in response to OpenNMS Horizon alarms.
20.3.1. Setup
In order to enable the plugin start by setting following property in ${OPENNMS_HOME}/etc/opennms.properties:
opennms.ticketer.plugin=org.opennms.netmgt.ticketd.OSGiBasedTicketerPluginConfigure the plugin options by setting the following properties in ${OPENNMS_HOME}/etc/tsrm.properties:
| Name | Description |
|---|---|
|
TSRM Endpoint URL |
|
Strict SSL Check (true/false) |
|
TSRM status for open ticket |
|
TSRM status for close ticket |
Next, add tsrm-troubleticketer to the featuresBoot property in the ${OPENNMS_HOME}/etc/org.apache.karaf.features.cfg
Restart OpenNMS.
When OpenNMS has started again, login to the Karaf Shell and install the feature:
feature:install tsrm-troubleticketerThe plugin should be ready to use. When troubleshooting, consult the following log files:
-
${OPENNMS_HOME}/data/log/karaf.log
-
${OPENNMS_HOME}/logs/trouble-ticketer.log
20.3.2. Mapping OpenNMS Ticket with TSRM Incident
Following tables shows mapping between OpenNMS ticket and TSRM Incident
| Ticket Field | TSRM Incident Field |
|---|---|
|
|
|
|
|
|
|
|
|
|
Below fields are not part of Ticket, they have to be added as attributes.
| Ticket Field | TSRM Incident Field |
|---|---|
|
|
|
|
|
|
|
|
|
|
|
|
|
|
|
|
|
|
|
|
|
|
|
|
|
|
|
|
21. Enabling RMI
By default, the RMI port in the OpenNMS Horizon server is disabled, for security reasons. If you wish to enable it so you can access OpenNMS Horizon through jconsole, remote-manage OpenNMS Horizon, or use the remote poller over RMI, you will have to add some settings to the default OpenNMS Horizon install.
21.1. Enabling RMI
To enable the RMI port in OpenNMS Horizon, you will have to add the following to the ${OPENNMS_HOME}/etc/opennms.conf file. If you do not have an opennms.conf file, you can create it.
# Configure remote JMX
ADDITIONAL_MANAGER_OPTIONS="$ADDITIONAL_MANAGER_OPTIONS -Dcom.sun.management.jmxremote.port=18980"
ADDITIONAL_MANAGER_OPTIONS="$ADDITIONAL_MANAGER_OPTIONS -Dcom.sun.management.jmxremote.local.only=false"
ADDITIONAL_MANAGER_OPTIONS="$ADDITIONAL_MANAGER_OPTIONS -Dcom.sun.management.jmxremote.authenticate=true"
ADDITIONAL_MANAGER_OPTIONS="$ADDITIONAL_MANAGER_OPTIONS -Dcom.sun.management.jmxremote.ssl=false"
# Listen on all interfaces
ADDITIONAL_MANAGER_OPTIONS="$ADDITIONAL_MANAGER_OPTIONS -Dopennms.poller.server.serverHost=0.0.0.0"
# Accept remote RMI connections on this interface
ADDITIONAL_MANAGER_OPTIONS="$ADDITIONAL_MANAGER_OPTIONS -Djava.rmi.server.hostname=<your-server-ip-address>"This tells OpenNMS Horizon to listen for RMI on port 18980, and to listen on all interfaces. (Originally, RMI was only used for the Remote Poller, so despite the porperty name mentioning the "opennms poller server" it applies to RMI as a whole.) Note that you must include the -Djava.rmi.server.hostname= option or OpenNMS Horizon will accept connections on the RMI port, but not be able to complete a valid connection.
Authentication will only be allowed for users that are in the admin role (i.e. ROLE_ADMIN), or the jmx role (i.e. ROLE_JMX).
To make a user an admin, be sure to add only the ROLE_ADMIN role to the user in users.xml.
To add the jmx role to the user, add the ROLE_JMX role to the user in users.xml, and also the ROLE_USER role if is required to provide access to the WebUI.
Make sure $OPENNMS_HOME/etc/jmxremote.access has the appropriate settings:
admin readwrite jmx readonly
The possible types of access are:
- readwrite
-
Allows retrieving JMX metrics as well as executing MBeans.
- readonly
-
Allows retrieving JMX metrics but does not allow executing MBeans, even if they just return simple values.
21.2. Enabling SSL
To enable SSL on the RMI port, you will need to have an existing keystore for the OpenNMS Horizon server. For information on configuring a keystore, please refer to the official OpenNMS Horizon Wiki article Standalone HTTPS with Jetty.
You will need to change the com.sun.management.jmxremote.ssl option to true, and tell OpenNMS Horizon where your keystore is.
# Configure remote JMX
ADDITIONAL_MANAGER_OPTIONS="$ADDITIONAL_MANAGER_OPTIONS -Dcom.sun.management.jmxremote.port=18980"
ADDITIONAL_MANAGER_OPTIONS="$ADDITIONAL_MANAGER_OPTIONS -Dcom.sun.management.jmxremote.local.only=false"
ADDITIONAL_MANAGER_OPTIONS="$ADDITIONAL_MANAGER_OPTIONS -Dcom.sun.management.jmxremote.authenticate=true"
ADDITIONAL_MANAGER_OPTIONS="$ADDITIONAL_MANAGER_OPTIONS -Dcom.sun.management.jmxremote.ssl=true"
# Configure SSL Keystore
ADDITIONAL_MANAGER_OPTIONS="$ADDITIONAL_MANAGER_OPTIONS -Djavax.net.ssl.keyStore=/opt/opennms/etc/opennms.keystore"
ADDITIONAL_MANAGER_OPTIONS="$ADDITIONAL_MANAGER_OPTIONS -Djavax.net.ssl.keyStorePassword=changeit"
# Listen on all interfaces
ADDITIONAL_MANAGER_OPTIONS="$ADDITIONAL_MANAGER_OPTIONS -Dopennms.poller.server.serverHost=0.0.0.0"
# Accept remote RMI connections on this interface
ADDITIONAL_MANAGER_OPTIONS="$ADDITIONAL_MANAGER_OPTIONS -Djava.rmi.server.hostname=<your-server-ip-address>"21.3. Connecting to RMI over SSL
Note that if you are using a self-signed or otherwise untrusted certificate, you will need to configure a truststore on the client side when you attempt to connect over SSL-enabled RMI. To create a truststore, follow the example in the HTTPS client instructions in the operator section of the manual. You may then use the truststore to connect to your OpenNMS Horizon RMI server.
For example, when using jconsole to connect to the OpenNMS Horizon RMI interface to get JVM statistics, you would run:
jconsole -J-Djavax.net.ssl.trustStore=/path/to/opennms.truststore -J-Djavax.net.ssl.trustStorePassword=changeit
22. Minion
22.1. Using JMS
By default, OpenNMS Horizon uses the JMS protocol with an ActiveMQ broker to communicate with Minions. This is used for both issuing remote procedure calls (RPCs, ie. ping this host) and for transporting unsolicited messages such as SNMP traps and syslog messages. OpenNMS Horizon provides an embedded ActiveMQ broker to help simplify installation.
| It is also possible (and recommended for large installations) to use an external broker. |
22.1.1. Tuning the ActiveMQ broker
The settings for the embedded ActiveMQ broker are found in $OPENNMS_HOME/etc/opennms-activemq.xml.
Memory and storage limits are conservative by default and should be tuned to accommodate your workload.
Consider increasing the memoryUsage (defaults to 20MB) to 512MB or greater, assuming you have enough heap available.
| If the memory limit is reached, flow control will prevent messages from being published to the broker. |
22.1.2. Monitoring the ActiveMQ broker using the Karaf shell
The opennms:activemq-stats command available via the Karaf shell can be used to show statistics about the embedded broker:
opennms:activemq-stats
If the command is not available, try installing the feature using feature:install opennms-activemq-shell
|
This command reports some high level broker statistics as well as message, enqueue and dequeue counts for the available queues. Pay close attention to the memory usage that is reported. If the usage is high, use the queue statistics to help isolate which queue is consuming most of the memory.
The opennms:activemq-purge-queue command can be used to delete all of the available messages in a particular queue:
opennms:activemq-purge-queue OpenNMS.Sink.Trap22.1.3. Authentication and authorization with ActiveMQ
The embedded ActiveMQ broker is pre-configured to authenticate clients using the same authentication mechanisms (JAAS) as the OpenNMS Horizon web application.
Users associated with the ADMIN role can read, write or create any queue or topic.
Users associated with the MINION role are restricted in such a way that prevents them from making RPC requests to other locations, but can otherwise read or write to the queues they need.
See the authorizationPlugin section in $OPENNMS_HOME/etc/opennms-activemq.xml for details.
22.1.4. Multi-tenancy with OpenNMS Horizon and ActiveMQ
The queue names used by OpenNMS Horizon are prefixed with a constant value.
If many OpenNMS Horizon are configured to use the same broker, then these queues would end up being shared amongst the instances, which is not desired.
In order to isolate multiple instances on the same broker, you can customize the prefix by setting the value of the org.opennms.instance.id system property to something that is unique per instance.
echo 'org.opennms.instance.id=MyNMS' > "$OPENNMS_HOME/etc/opennms.properties.d/instance-id.properties"| If you change the instance id setting when using the embedded broker, you will need to update the authorization section in the broker’s configuration to reflect the updated prefix. |
22.1.5. Tuning the RPC client in OpenNMS
The following system properties can be used to tune the thread pool used to issue RPCs:
General
| Name | Default | Description |
|---|---|---|
|
|
Number of threads which are always active. |
|
|
Maximum number of threads which can be active. These will exit after remaining unused for some period of time. |
|
|
Maximum number of requests to queue. Set to |
Use the opennms:stress-rpc Karaf shell command to help evaluate and tune performance.
|
22.1.6. Diagnosing RPC failures
Symptoms of RPC failures may include missed polls, missed data collection attempts and the inability to provision or re-scan existing nodes. For these reasons, it is important to ensure that RPC related communication with Minion at the various monitoring locations remains healthy.
If you want to verify that a specific location is operating correctly make sure that:
-
Nodes exist and were automatically provisioned for all of the Minions at the location
-
The
Minion-Heartbeat,Minion-RPCandJMX-Minionservices are online for one or more Minions at the location -
Response time graphs for the
Minion-RPCservice are populated and contain reasonable values-
These response time graphs can be found under the
127.0.0.1response time resource on the Minion node -
Values should typically be under 100ms but may vary based on network latency
-
-
Resource graphs for the
JMX-Minionservice are populated and reasonable values
To interactively test RPC communication with a remote location use the opennms:poll command from the Karaf shell:
opennms:poll -l LOCATION -c org.opennms.netmgt.poller.monitors.IcmpMonitor 127.0.0.1
Replace LOCATION in the command above with the name of the location you want to test.
|
22.2. Using AWS SQS
By default, OpenNMS Horizon uses an ActiveMQ broker to communicate with Minions. This broker is used for both issuing remote procedure calls (RPCs, ie. ping this host) and for transporting unsolicited messages such as SNMP traps and syslog messages.
AWS SQS can be used as an alternative to ActiveMQ for both remote procedure calls and transporting the unsolicited messages.
AWS SQS must be enabled on both OpenNMS Horizon and Minion to function.
22.2.1. OpenNMS Horizon Configuration
Enable and configure the AWS SQS on OpenNMS Horizon by using the following commands.
The initialSleepTime property will ensure that messages are not consumed from AWS SQS until the OpenNMS Horizon system has fully initialized.
echo 'org.opennms.core.ipc.rpc.strategy=sqs
org.opennms.core.ipc.sink.strategy=sqs
org.opennms.core.ipc.sink.initialSleepTime=60000
org.opennms.core.ipc.aws.sqs.aws_region=us-east-1' > "$OPENNMS_HOME/etc/opennms.properties.d/aws-sqs.properties"AWS Credentials are required in order to access SQS. The default credential provider chain looks for credentials in this order:
-
Environment Variables (i.e.
AWS_ACCESS_KEY_IDandAWS_SECRET_ACCESS_KEY) -
Java system properties (i.e.
aws.accessKeyIdandaws.secretKey. These keys can be added to$OPENNMS_HOME/etc/opennms.conf) -
Default credential profiles file (i.e.
~/.aws/credentials) -
Amazon ECS container credentials (i.e.
AWS_CONTAINER_CREDENTIALS_RELATIVE_URI) -
Instance profile credentials (i.e. through the metadata service when running on EC2)
Alternatively, the credentials can be specified inside the aws-sqs.properties file:
echo 'org.opennms.core.ipc.aws.sqs.aws_access_key_id=XXXXXXXXXXX
org.opennms.core.ipc.aws.sqs.aws_secret_access_key=XXXXXXXXXXX' >> "$OPENNMS_HOME/etc/opennms.properties.d/aws-sqs.properties"When running OpenNMS inside AWS, it is possible to use the default provider chain with an IAM Role to avoid hard coding the AWS Credentials on a configuration file. The following shows an example of the role that should be associated with the EC2 instance on which OpenNMS is going to run:
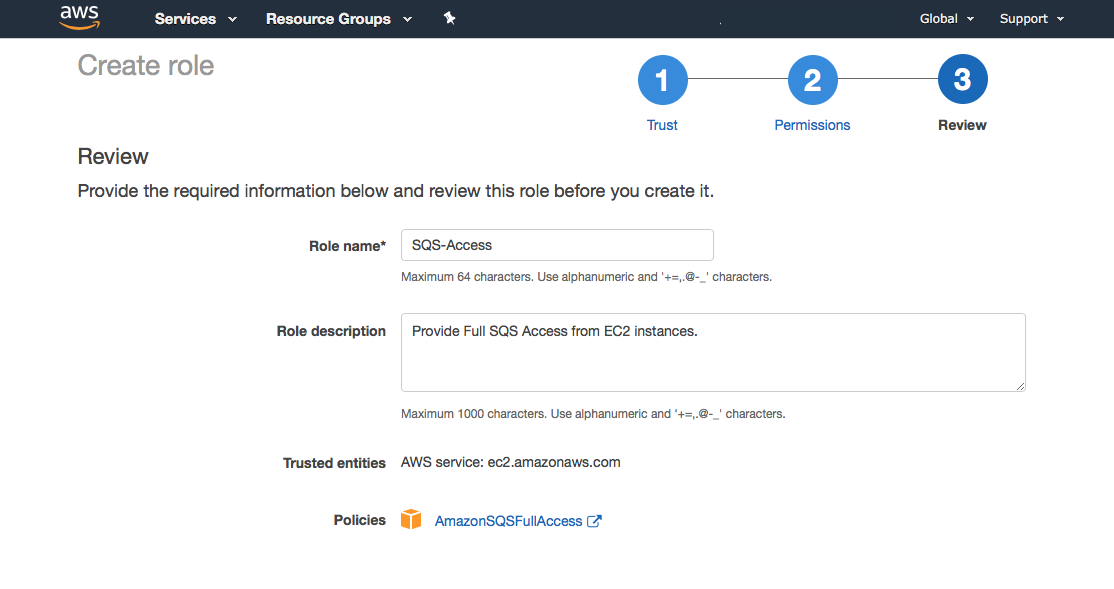
If you require consistent ordering of the messages, you should use FIFO queues instead of Standard queues.
You can enable FIFO queues by adding the following parameter to the aws-sqs.properties file referenced above:
org.opennms.core.ipc.aws.sqs.sink.FifoQueue=trueRestart OpenNMS Horizon to apply the changes.
22.2.2. Minion Configuration
Enable the AWS SQS on Minion using:
echo '!minion-jms
!opennms-core-ipc-rpc-jms
!opennms-core-ipc-sink-camel
opennms-core-ipc-rpc-aws-sqs
opennms-core-ipc-sink-aws-sqs' > "$MINION_HOME/etc/featuresBoot.d/aws-sqs.boot"| The snippet above prevents the default JMS related features from starting and loads the SQS related features instead. |
Next, configure AWS SQS on Minion using:
echo 'aws_region=us-east-1
aws_access_key_id=XXXXXXXXXXX
aws_secret_access_key=XXXXXXXXXXX' > "$MINION_HOME/etc/org.opennms.core.ipc.aws.sqs.cfg"The AWS credentials are required. If they are not specified on the configuration file, the default credentials provider chain (explained above) will be used instead.
If you require consistent ordering to the messages, you should use FIFO queues instead of Standard queues.
You can enable FIFO queues by adding the following parameter to the org.opennms.core.ipc.aws.sqs.cfg file referenced above:
sink.FifoQueue=trueRestart Minion to apply the changes.
| AWS credentials are required when the Minion is not running inside a VPC. |
| The Minion SQS settings must match what OpenNMS currently has. This is particularly critical for the FifoQueue setting. |
22.2.3. SQS Configuration Settings
From the Amazon SQS Documentation, the following tables list parameters which can be added to either Minion (via MINION_HOME/etc/org.opennms.core.ipc.aws.sqs.cfg) or OpenNMS Horizon (via OPENNMS_HOME/etc/opennms.properties.d/aws-sqs.properties), along with the correct syntax for each environment.
Sink Settings
Queues used for reception of unsolicited messages (e.g. SNMP traps, syslog messages) are configured by setting properties with sink prepended to the SQS parameter name:
| Parameter | Notes | OpenNMS Horizon | Minion |
|---|---|---|---|
|
Default: 0 seconds |
|
|
|
Default: 262144 bytes |
|
|
|
Default: 1209600 seconds |
|
|
|
Default: 10 seconds (for OpenNMS) |
|
|
|
Default: 30 seconds |
|
|
|
- |
|
|
|
- |
|
|
|
- |
|
|
|
- |
|
|
|
Default: false |
|
|
|
Valid only when |
|
|
RPC Settings
Queues used for provisioning, service polling, data collection, and other concerns apart from unsolicited message reception are configured by setting properties with rpc prepended to the SQS parameter name:
| Parameter | Notes | OpenNMS Horizon | Minion |
|---|---|---|---|
|
Default: 0 seconds |
|
|
|
Default: 262144 bytes |
|
|
|
Default: 1209600 seconds |
|
|
|
Default: 10 seconds (for OpenNMS) |
|
|
|
Default: 30 seconds |
|
|
|
- |
|
|
|
- |
|
|
|
- |
|
|
|
- |
|
|
|
Default: false |
|
|
|
Valid only when |
|
|
When FIFO queues are not required, there is no need to add FifoQueue=false to the configuration files, as this is the default behavior.
|
22.2.4. Managing Multiple Environments
In order to support multiple OpenNMS Horizon environments in a single AWS region, the aws_queue_name_prefix property can be used to prefix the queue names.
For example, if we set this property to be "PROD", the queue names will resemble PROD-OpenNMS-Sink-Heartbeat, instead of OpenNMS-Sink-Heartbeat.
| This property must be properly configured at OpenNMS Horizon and Minion side. |
22.2.5. AWS Credentials
The credentials (a.k.a. the Access Key ID and the Secret Access Key) are required in both sides, OpenNMS and Minion.
In order to create credentials just for accessing SQS resources, follow this procedure:
-
From the AWS Console, choose the appropriate region.
-
Open the IAM Dashboard and click on "Add user".
-
Choose a name for the user, for example
opennms-minion. -
Check only
Programmatic accessfor the Access type. -
On the permissions, click on
Attach existing policies directly. -
On the search bar, write SQS, and then check on
AmazonSQSFullAccess. -
Click on Create User
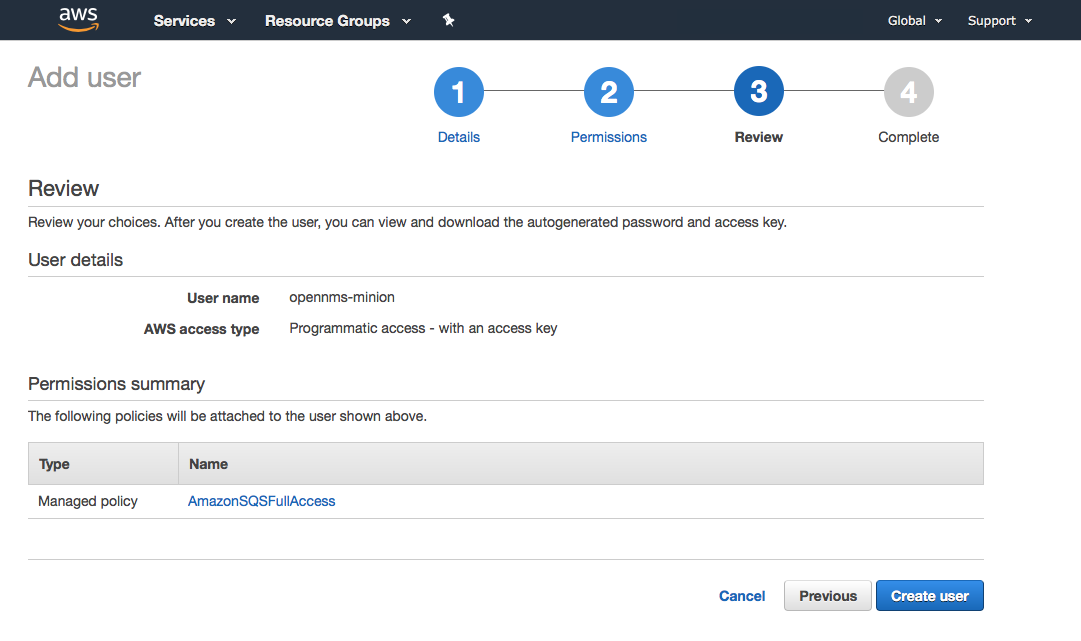
Finally, either click on Download .csv or click on "Show" to grab a copy of the Access key ID, and the Secret access key.
22.2.6. Limitations
There are a number of limitations when using AWS SQS, in particular:
-
A message can include only XML, JSON, and unformatted text. The following Unicode characters are allowed:
#x9|#xA|#xD|#x20to#xD7FF|#xE000to#xFFFD|#x10000to#x10FFFF. Any characters not included in this list are rejected. -
The minimum message size is 1 byte (1 character). The maximum is 262,144 bytes (256 KB).
-
Without batching, FIFO queues can support up to 300 messages per second (300 send, receive, or delete operations per second).
See Amazon SQS Limits for further details.
Location names
Queue names in AWS SQS are limited to 80 characters. When issuing remote procedure calls, the target location is used a part of the queue name. For this reason, it is important that:
-
The length of the location name and queue name prefix (if used) must not exceed 32 characters in aggregate.
-
Both the location name and queue name prefix (if used) may only contain alphanumeric characters, hyphens (-), and underscores (_). :imagesdir: ../../images
22.3. Using Off-heap Storage for Sink Messages
If a Minion loses connectivity with the broker (i.e. Kafka or ActiveMQ), then any received messages (i.e. syslog, flows, SNMP traps) are queued until connectivity is restored. This queue is limited by a fixed (and configurable) number of messages queued in the JVM heap and can optionally queue additional messages by persisting directly to the filesystem avoiding heap memory usage. Once the queue is full, additional messages will be dropped.
The off-heap storage feature allows us to extend the storage capacity by queuing messages outside of the JVM heap.
22.3.1. Configuring Off-heap Storage
Configure storage limits:
echo 'offHeapSize = 1GB
entriesAllowedOnHeap = 100000
offHeapFilePath =' > "$MINION_HOME/etc/org.opennms.core.ipc.sink.offheap.cfg"A file will be created for each module and the configuration will be applied to each module individually. Therefore setting a size of 1GB for example means that the maximum size for each module’s file is 1GB not that the total for all modules is 1GB.
The number of entries allowed to be queued on the heap can be controlled by setting the entriesAllowedOnHeap value.
Specify offHeapSize in KB, MB or GB. For ex: 1, 128MB, 65536KB. The size specified must be a power of 2. For example 128MB is a valid value but 140MB is not.
The offHeapSize can also be left empty or set to 0 to disable queueing off heap. In this case only heap memory will be used for queueing.
The offHeapFilePath should be set to the path where the queue files should be stored and defaults to the Karaf data directory if left empty. :imagesdir: ../../images
22.4. Installing JDBC drivers in Minion
For any JDBC service to be detected/polled/collected, corresponding JDBC driver needs to be installed in Minion. Following are steps to install JDBC driver.
-
JDBC driver jar needs to be copied into
minion/repositories/defaultby following maven repositories pattern. For ex: Mysql driver jar should be placed inrepositories/core/mysql/mysql-connector-java/8.0.15/mysql-connector-java-8.0.15.jar -
Install the JDBC driver jar as a feature. Modify contents of following
features-jdbc.xmlrelevant to JDBC driver that is getting installed. Copyfeatures-jdbc.xmlfile into${MINION_HOME}/deploy/. Multiple JDBC drivers can be added to this file each one as a new feature.
<?xml version="1.0" encoding="UTF-8"?>
<features
name="opennms-${project.version}"
xmlns="http://karaf.apache.org/xmlns/features/v1.4.0"
xmlns:xsi="http://www.w3.org/2001/XMLSchema-instance"
xsi:schemaLocation="http://karaf.apache.org/xmlns/features/v1.4.0 http://karaf.apache.org/xmlns/features/v1.4.0"
>
<!-- Bootstrap mysql bundle to get loaded by default in minion -->
<feature name="mysql-bundle" version="8.0.15" install="auto">
<bundle>wrap:mvn:mysql/mysql-connector-java/8.0.15</bundle>
</feature>
</features>-
Restart Minion with :
systemctl restart minionand that should load the JDBC driver. :imagesdir: ../../images
22.5. Time to Live (TTL) for RPCs
Remote procedure calls (RPCs) between OpenNMS Horizon and Minion include a time limit which, if exceeded, aborts the requests and discards any subsequent responses. We call this limit the time-to-live or TTL. We make an effort to use logical values where possible and provide means to configure the TTLs for circumstances where the default values are not suitable (i.e. for interacting with devices or locations with high latency).
Our modules and services have different rules for determining the TTL.
| To troubleshoot TTLs, consider enabling the OpenTracing integration on both OpenNMS Horizon and Minion. |
22.5.1. TTLs in Pollerd & Collectd
The TTL used when invoking monitors and collectors remotely is:
-
The value from the
ttlparameter associated with the service -
Fall-back to using the service interval as the TTL (this is the rate at which the service is scheduled)
These rules apply to all monitors and collectors, excluding the SnmpCollector.
22.5.2. TTLs for the SNMP Collector
The TTL used when invoking the SnmpCollector remotely is:
-
The value of the
ttlassociate with the SNMP agent’s configuration -
Fall-back to using the service interval as the TTL (this is the rate at which the service is scheduled)
22.5.3. TTLs for the other SNMP communication
The TTL used when invoking other types of SNMP requests remotely is:
-
The value of the
ttlassociate with the SNMP agent’s configuration -
Fall-back to using the service interval as the TTL (this is the rate at which the service is scheduled)
| These rules apply to SNMP queries like agent scans in provisiond, table scans in enlinkd, etc… |
22.5.4. TTLs for Provisiond Detectors
The TTL used when invoking detectors remotely is:
-
The value from the
ttlparameter associated with the detector -
Fall-back to using the global default TTL
22.5.5. Global TTL
For cases where we cannot derive a suitable TTL, a global value is used wich defaults to 20000 (20 seconds).
This value can be configured.
When using the JMS-based RPC implementation, set value of the org.opennms.jms.timeout system property to the desired number of milliseconds.
When using the Kafka-based RPC implementation, set the value of the org.opennms.core.ipc.rpc.kafka.ttl system property to the desired number of milliseconds.
22.5.6. Using meta-data for TTLs
For RPCs that derive TTLs from service parameters, the meta-data feature can be used to customize these values on a node/interface/service basis.
For example, the ICMP detector could be configured to use the value of the ttl associated with the node meta-data, or default to 30 seconds if none is setup as follows:
<detector name="ICMP" class="org.opennms.netmgt.provision.detector.icmp.IcmpDetector">
<parameter key="ttl" value="${requisition:ttl|300000}"/>
</detector>23. Sentinel
The goal of Sentinel is to scale out and distribute individual components from OpenNMS Horizon.
| The sentinel feature is still in development and this is only a very rough documentation, not covering all aspects. Please refer to the Limitations section for more details |
23.1. Limitations
Currently Sentinel is in a very early state of development and therefore the usage is limited:
-
Only allows distribution of Telemetryd functionality (such as processing flows, or use the existing telemetry adapters to store measurements data to Newts)
-
Requires a Minion to work as a (message) producer
-
In most cases, it is advised to disable those adapters and listeners in OpenNMS Horizon if they are also running by a Sentinel instance.
23.2. Installation
If Minion is working, the ground work for Sentinel is already done. For more details on how to install Sentinel refer to the Installation Guide.
23.3. Clean Start
On each start the cache of the Sentinel is cleared, that means the container returns in it’s original state.
To disable this functionality set karaf.clean.cache = false in ${SENTINEL_HOME}/etc/system.properties.
23.4. Configuration
It is assumed, that the Sentinel container is running on a different system than the OpenNMS Horizon and Minion. Therefore at least the following configurations are necessary:
-
Configure the datasource to connect to the Postgres database
-
Configure the controller (identity and connection to communicate with OpenNMS - same as for Minion)
-
Configure the communication layer (for now either JMS or Kafka)
-
Install features
23.4.1. Configure the datasource
This is required in order to have Sentinel connect to the PostgreSQL database OpenNMS Horizon.
config:edit org.opennms.netmgt.distributed.datasource config:property-set datasource.url jdbc:postgresql://<db-host>:<db-port>/<db-name> config:property-set datasource.username <db-user> config:property-set datasource.password <db-password> config:property-set datasource.databaseName <db-name> config:update
23.4.2. Configure the controller
config:edit org.opennms.sentinel.controller config:property-set location SENTINEL (1) config:property-set id 00000000-0000-0000-0000-000000ddba11 (2) config:property-set http-url http://127.0.0.1:8980/opennms (3) config:property-set broker-url failover:tcp://127.0.0.1:61616 (4) config:update
| 1 | used only for tracing, must be provided |
| 2 | used only for tracing, must be provided |
| 3 | url which points to OpenNMS Horizon (required) |
| 4 | url which points to the OpenNMS Horizon Active MQ Broker (only required if using feature sentinel-jms, otherwise may be omitted) |
Basically the same properties as for the Minion Controller are supported, but must be placed in config file
org.opennms.sentinel.controller.cfg instead of org.opennms.minion.controller.cfg.
|
23.4.3. Configure Connectivity
By default the Sentinel consumes messages from the OpenNMS Horizon ActiveMQ Broker.
See Configure the Controller for more details.
As with Minion the Sentinel can also be configured to consume messages from Kafka
Using Kafka
When Using Sentinel with Kafka the same rules for using Kafka with Minions apply.
Kafka Configuration
Each Minion works as a Producer and must be configured beforehead. Please refer to section Minion Kafka Producer Configuration on how to configure Minion as a Kafka Producer.
Each Sentinel works as a Consumer and can be configured in the file ${SENTINEL_HOME}/etc/org.opennms.core.ipc.sink.kafka.consumer.cfg.
Either manually or via the config:edit org.opennms.core.ipc.sink.kafka.consumer statement.
For supported properties, see here
By default each Kafka Consumer starts consuming messages immediately after the feature has been started.
It is possible to set a property org.opennms.core.ipc.sink.initialSleepTime to define an initial sleep time in ms before any messages are consumed.
In order to set this up, please add an entry to the end of the file ${SENTINEL_HOME}/etc/system.properties:
# Initial delay of 5 seconds before consuming of messages is started in milliseconds
org.opennms.core.ipc.sink.initialSleepTime=500023.4.4. Available features
The following list contains some features which may be installed manually:
| Feature | Required | Description |
|---|---|---|
sentinel-core |
true |
Base feature, installing all required bundles such as |
sentinel-jms |
false |
Provides connectivity to the OpenNMS Horizon ActiveMQ Broker. |
sentinel-kafka |
false |
Provides connectivity to Kafka. |
sentinel-flows |
false |
Feature which starts all dependencies to start processing flows. |
sentinel-newts |
false |
Provides functionality to persist measurement data to Newts. |
sentinel-telemetry-nxos |
false |
Allows using the |
sentinel-telemetry-jti |
false |
Allows using the |
sentinel-telemetry-bmp |
false |
Allows using the |
23.4.5. Auto install
In some cases it is desired to automatically configure the Sentinel instance and also start required features/bundles.
As Sentinel is based on Apache Karaf - which supports auto deployment by simply copying any kind of data
to the deploy folder, Sentinel can make use of that mechanism to enable auto or hot deployment.
In order to do so, in most cases it is sufficient to copy a features.xml file to ${SENTINEL_HOME}/deploy.
This can be done even if the container is running.
The chapter Configure Flow Processing contains an example on how to automatically start them with Sentinel
23.4.6. Auto Start
In some cases it might not be sufficient to auto-deploy/configure the container with a features.xml file.
If more flexibility is required it is suggested to modify/copy .cfg and .properties files directly to the ${SENTINEL_HOME}/etc directory.
To automatically start features with the container, the file ${SENTINEL_HOME}/etc/org.apache.karaf.features.cfg must be updated:
# ...
featuresBoot = \
(aries-blueprint, \
deployer), \
instance/4.2.2, \
package/4.2.2, \
log/4.2.2, \
scv/26.1.3-SNAPSHOT, \
ssh/4.2.2, \
framework/4.2.2, \
system/4.2.2, \
eventadmin/4.2.2, \
feature/4.2.2, \
shell/4.2.2, \
management/4.2.2, \
service/4.2.2, \
system/4.2.2, \
eventadmin/4.2.2, \
feature/4.2.2, \
shell/4.2.2, \
management/4.2.2, \
service/4.2.2, \
jaas/4.2.2, \
shell-compat/4.2.2, \
diagnostic/4.2.2, \
wrap, \
bundle/4.2.2, \
config/4.2.2, \
kar/4.2.2, \
sentinel-jms, \ (1)
sentinel-flows (2)
# ....| 1 | Install and Start JMS communication feature |
| 2 | Install and Start Sentinel Flows feature |
23.4.7. Health Check / Troubleshooting
The opennms:health-check command allows to verify the health of the Sentinel container.
It performs various health checks depending on the installed features to calculate the overall container health.
For more information please try opennms:health-check --help.
In order to run the opennms:health-check command, the feature sentinel-core must be installed.
|
This is also available in Minion Containers and will replace the now deprecated command minion:ping.
|
23.5. Flow Processing
In order to process flows via Sentinel ensure that OpenNMS Horizon, Minion and Sentinel are all installed according to the official Installation Guide.
Afterwards the following configuration examples help setting everything up.
23.5.1. Configure Sentinel
In order to process flows, Sentinel must start appropriate flow adapters.
In Sentinel flow adapters are configured by either be placing a .cfg file in ${SENTINEL_HOME}/etc or via config:edit statement.
The following example will configure the consumption of Netflow5 flows and saves the configuration in
${SENTINEL_HOME/etc/org.oennms.features.telemetry.adaters-netflow5.cfg.
First login to the Karaf Shell
$ ssh -p 8301 admin@localhost
admin@sentinel> config:edit --alias netflow5 --factory org.opennms.features.telemetry.adapters admin@sentinel> config:property-set name Netflow-5 admin@sentinel> config:property-set adapters.0.name Netflow-5-Adapter admin@sentinel> config:property-set adapters.0.class-name org.opennms.netmgt.telemetry.protocols.netflow.adapter.netflow5.Netflow5Adapter admin@sentinel> config:update
Afterwards the feature sentinel-flows can be installed:
admin@sentinel> feature:install sentinel-jms (1) admin@sentinel> feature:install sentinel-flows
| 1 | or sentinel-kafka |
Only processing of Netflow5 flows has been tested.
|
To check everything is working as expected, run the opennms:health-check command, e.g.:
admin@sentinel> opennms:health-check Verifying the health of the container Verifying installed bundles [ Success ] Connecting to JMS Broker [ Success ] Connecting to OpenNMS ReST API [ Success ] Retrieving NodeDao [ Success ] Connecting to ElasticSearch ReST API (Flows) [ Success ] => Everything is awesome
23.5.2. Configure Minion
The Minion must be configured to listen to incoming flow packages, e.g.:
$ ssh -p 8201 admin@localhost
admin@minion()> config:edit --alias udp-8877 --factory org.opennms.features.telemetry.listeners admin@minion()> config:property-set name Netflow-5 admin@minion()> config:property-set class-name org.opennms.netmgt.telemetry.listeners.UdpListener admin@minion()> config:property-set parameters.port 8877 admin@minion()> config:property-set parsers.0.name Netflow-5-Parser admin@minion()> config:property-set parsers.0.class-name org.opennms.netmgt.telemetry.protocols.netflow.parser.Netflow5UdpParser admin@minion()> config:update
The name of the listener, in this case Netflow-5 must match with the name of the adapter
configuration in the Sentinel container.
|
23.5.3. Configure OpenNMS
OpenNMS Horizon must expose its ActiveMQ Broker to have a Minion and Sentinel connect to it.
This can be done in $OPENNMS_HOME/etc/opennms-activemq.xml.
For more details please refer to the Minion Installation Guide.
23.5.4. Auto configure flow processing for Sentinel
The following examples illustrate a features.xml which configures the Sentinel instance and automatically starts
all required features to either consume messages via JMS (ActiveMQ) or Kafka.
Simply copy it to ${SENTINEL_HOME}/deploy/.
<?xml version="1.0" encoding="UTF-8"?>
<features
name="opennms-${project.version}"
xmlns="http://karaf.apache.org/xmlns/features/v1.4.0"
xmlns:xsi="http://www.w3.org/2001/XMLSchema-instance"
xsi:schemaLocation="http://karaf.apache.org/xmlns/features/v1.4.0 http://karaf.apache.org/xmlns/features/v1.4.0"
>
<!-- Bootstrap feature to start all flow related features automatically -->
<feature name="autostart-sentinel-flows" version="${project.version}" start-level="100" install="auto">
<!-- Configure the controller itself -->
<config name="org.opennms.sentinel.controller">
location = SENTINEL
id = 00000000-0000-0000-0000-000000ddba11
http-url = http://127.0.0.1:8980/opennms
broker-url = failover:tcp://127.0.0.1:61616
</config>
<!-- Configure datasource connection -->
<config name="org.opennms.netmgt.distributed.datasource">
datasource.url = jdbc:postgresql://localhost:5432/opennms
datasource.username = postgres
datasource.password = postgres
datasource.databaseName = opennms
</config>
<!--
Starts the Netflow5Adapter to process Netflow5 Messages.
Be aware, that this requires a Listener with name "Netflow-5" on the Minion-side to have messages
processed properly.
-->
<config name="org.opennms.features.telemetry.adapters-netflow5">
name = Netflow-5
class-name = org.opennms.netmgt.telemetry.adapters.netflow.v5.Netflow5Adapter
</config>
<!-- Point sentinel to the correct elastic endpoint -->
<config name="org.opennms.features.flows.persistence.elastic">
elasticUrl = http://elasticsearch:9200
</config>
<!-- Install JMS related features -->
<feature>sentinel-jms</feature>
<!-- Install Flow related features -->
<feature>sentinel-flows</feature>
</feature>
</features><?xml version="1.0" encoding="UTF-8"?>
<features
name="opennms-${project.version}"
xmlns="http://karaf.apache.org/xmlns/features/v1.4.0"
xmlns:xsi="http://www.w3.org/2001/XMLSchema-instance"
xsi:schemaLocation="http://karaf.apache.org/xmlns/features/v1.4.0 http://karaf.apache.org/xmlns/features/v1.4.0"
>
<!-- Bootstrap bootstrap feature to start all flow related features automatically -->
<feature name="autostart-sentinel-telemetry-flows" version="${project.version}" start-level="200" install="auto">
<!-- Configure the controller itself -->
<config name="org.opennms.sentinel.controller">
location = SENTINEL
id = 00000000-0000-0000-0000-000000ddba11
http-url = http://127.0.0.1:8980/opennms
broker-url = failover:tcp://127.0.0.1:61616
</config>
<!-- Configure datasource connection -->
<config name="org.opennms.netmgt.distributed.datasource">
datasource.url = jdbc:postgresql://localhost:5432/opennms
datasource.username = postgres
datasource.password = postgres
datasource.databaseName = opennms
</config>
<!--
Starts the Netflow5Adapter to process Netflow5 Messages.
Be aware, that this requires a Listener with name "Netflow-5" on the Minion-side to have messages
processed properly.
-->
<config name="org.opennms.features.telemetry.adapters-netflow5">
name = Netflow-5
class-name = org.opennms.netmgt.telemetry.adapters.netflow.v5.Netflow5Adapter
</config>
<!-- Point sentinel to the correct elastic endpoint -->
<config name="org.opennms.features.flows.persistence.elastic">
elasticUrl = http://elasticsearch:9200
</config>
<!--
Configure as Kafka Consumer.
All properties desribed at https://kafka.apache.org/0100/documentation.html#newconsumerconfigs are supported.
-->
<config name="org.opennms.core.ipc.sink.kafka.consumer">
group.id = OpenNMS
bootstrap.servers = localhost:9092
</config>
<!--
Configure as Kafka Producer for sending Events from Sentinel.
All properties desribed at https://kafka.apache.org/0100/documentation.html#producerconfigs are supported.
-->
<config name="org.opennms.core.ipc.sink.kafka">
bootstrap.servers = localhost:9092
</config>
<!-- Install Kafka related features -->
<feature>sentinel-kafka</feature>
<!-- Install flow related features -->
<feature>sentinel-flows</feature>
</feature>
</features>23.6. Persisting Collection Sets to Newts
In the previous chapter it is described on how to setup OpenNMS Horizon, Minion and Sentinel in order to distribute the processing of flows.
However, it only covered flow processing adapters, but there are more, e.g. the NxosGpbAdapter, which can also be run on a Sentinel.
23.6.1. Adapters
This chapter describes the various adapters which may contain sample data which may be stored to a Persistence Storage and can also run on a Sentinel. At the moment only Newts is supported as a Persistence Storage. See chapter Configure Newts on how to configure Newts.
In order to get it to work properly, please note, that an apropriate listener on the Minion must also be configured. The name of the listener should share the same name on Sentinel.
SFlowTelemetryAdapter
In order to use this adapter, the feature sentinel-flows and sentinel-newts must be installed.
In addition either sentinel-jms or sentinel-kafka should be installed and configured properly.
See the previous Flow Processing chapter for more details.
If only sample data should be persisted, the following commands can be run on the Sentinel's Karaf Shell
$ ssh -p 8301 admin@localhost
admin@sentinel> config:edit --alias sflow --factory org.opennms.features.telemetry.adapters admin@sentinel> config:property-set name SFlow-Telemetry admin@sentinel> config:property-set class-name org.opennms.netmgt.telemetry.adapters.netflow.sflow.SFlowTelemetryAdapter admin@sentinel> config:property-set parameters.script /opt/sentinel/etc/sflow-host.groovy admin@sentinel> config:update
If SFlow flows and the sample data should be processed, multiple adapters can be configured:
config:edit --alias sflow-telemetry --factory org.opennms.features.telemetry.adapters config:property-set name SFlow config:property-set adapters.1.name SFlow-Adapter config:property-set adapters.1.class-name org.opennms.netmgt.telemetry.adapters.netflow.sflow.SFlowAdapter config:property-set adapters.2.name SFlow-Telemetry config:property-set adapters.2.class-name org.opennms.netmgt.telemetry.adapters.netflow.sflow.SFlowTelemetryAdapter config:property-set adapters.2.parameters.script /opt/sentinel/etc/sflow-host.groovy config:update
Please note, that in both cases the file /opt/sentinel/etc/sflow-host.groovy must be provided manually, e.g. by manually copying it over from OpenNMS Horizon.
NxosGpbAdapter
In order to use this adapter, the feature sentinel-telemetry-nxos and sentinel-newts must be installed.
In addition either sentinel-jms or sentinel-kafka should be installed and configured properly.
See the previous Flow Processing chapter for more details.
Besides this, configuration files from OpenNMS Horizon must be copied to Sentinel to /opt/sentinel/etc.
The following files and directories are required:
-
${OPENNMS_HOME}/etc/datacollection -
${OPENNMS_HOME}/etc/datacollection-config.xml -
${OPENNMS_HOME}/etc/resource-types.d
Afterwards the adapter can be set up:
$ ssh -p 8301 admin@localhost
admin@sentinel> config:edit --alias nxos --factory org.opennms.features.telemetry.adapters admin@sentinel> config:property-set name NXOS admin@sentinel> config:property-set class-name org.opennms.netmgt.telemetry.protocols.nxos.adapter.NxosGpbAdapter admin@sentinel> config:property-set parameters.script /opt/sentinel/etc/cisco-nxos-telemetry-interface.groovy admin@sentinel> config:update
Please note, that the file /opt/sentinel/etc/cisco-nxos-telemetry-interface.groovy must also be provided manually,
e.g. by manually copying it over from OpenNMS Horizon.
JtiGpbAdapter
In order to use this adapter, the feature sentinel-telemetry-jti and sentinel-newts must be installed.
In addition either sentinel-jms or sentinel-kafka should be installed and be configured properly.
See the previous Flow Processing chapter for more details.
Besides this, configuration files from OpenNMS Horizon must be copied to Sentinel to /opt/sentinel/etc.
The following files and directories are required:
-
${OPENNMS_HOME}/etc/datacollection -
${OPENNMS_HOME}/etc/datacollection-config.xml -
${OPENNMS_HOME}/etc/resource-types.d
Afterwards the adapter can be set up:
$ ssh -p 8301 admin@localhost
admin@sentinel> config:edit --alias jti --factory org.opennms.features.telemetry.adapters admin@sentinel> config:property-set name JTI admin@sentinel> config:property-set class-name org.opennms.netmgt.telemetry.protocols.jti.adapter.JtiGpbAdapter admin@sentinel> config:property-set parameters.script /opt/sentinel/etc/junos-telemetry-interface.groovy admin@sentinel> config:update
Please note, that the file /opt/sentinel/etc/junos-telemetry-interface.groovy must also be provided manually,
e.g. by manually copying it over from OpenNMS Horizon.
23.6.2. Configure Newts
The configuration of Newts for Sentinel uses the same properties as for OpenNMS Horizon.
The only difference is, that the properties for Sentinel are stored in /opt/sentinel/etc/org.opennms.newts.config.cfg instead of *.properties files.
The name of each property is the same as for OpenNMS Horizon without the org.opennms.newts.config prefix.
The following example shows a custom Newts configuration using the Sentinel's Karaf Shell.
$ ssh -p 8301 admin@localhost
admin@sentinel> config:edit org.opennms.newts.config admin@sentinel> config:property-set hostname localhost admin@sentinel> config:property-set port 9042 admin@sentinel> config:property-set cache.strategy org.opennms.netmgt.newts.support.GuavaSearchableResourceMetadataCache admin@sentinel> config:update
24. Special Cases and Workarounds
24.1. Overriding SNMP Client Behavior
By default, the SNMP subsystem in OpenNMS Horizon does not treat any RFC 3416 error-status as fatal. Instead, it will attempt to continue the request, if possible. However, only a subset of errors will cause OpenNMS Horizon’s SNMP client to attempt retries. The default SNMP error-status handling behavior is as follows:
error-status |
Fatal? | Retry? |
|---|---|---|
noError(0) |
false |
false |
tooBig(1) |
false |
true |
noSuchName(2) |
false |
true |
badValue(3) |
false |
false |
readOnly(4) |
false |
false |
genErr(5) |
false |
true |
noAccess(6) |
false |
true |
wrongType(7) |
false |
false |
wrongLength(8) |
false |
false |
wrongEncoding(9) |
false |
false |
wrongValue(10) |
false |
false |
noCreation(11) |
false |
false |
inconsistentValue(12) |
false |
false |
resourceUnavailable(13) |
false |
false |
commitFailed(14) |
false |
false |
undoFailed(15) |
false |
false |
authorizationError(16) |
false |
true |
notWritable(17) |
false |
false |
inconsistentName(18) |
false |
false |
You can override this behavior by setting a property inside ${OPENNMS_HOME}/etc/opennms.properties in the form:
org.opennms.netmgt.snmp.errorStatus.[statusCode].[type]
For example, to make authorizationError(16) abort and not retry, you would set:
org.opennms.netmgt.snmp.errorStatus.16.fatal=true
org.opennms.netmgt.snmp.errorStatus.16.retry=false25. IFTTT Integration
The free web-based service IFTTT allows to combine web applications using simple conditional instructions. Each supported service has several triggers that can be used to trigger actions of other services. This allows for example to change brightness and color of a smart bulb, send messages or date to IoT devices.
The OpenNMS Horizon integration makes uses of the so-called "Webhooks" service, that allows to trigger actions when a specific web-request was received. The basic operation is as follows: OpenNMS Horizon polls for alarms and matches the alarm reduction key against a given filter and the alarm’s associated nodes against a given category filter. For the resulting alarm set the maximum severity and total count is computed. If one of these values changed compared to the last poll one or more events specified for the computed maximum severity will be sent to IFTTT.
25.1. IFTTT Configuration
In order to use the IFTTT integration in OpenNMS Horizon you need an IFTTT account.
With this account you are able to create so-called applets that combine a trigger with an action.
In our case we use the "Webhooks" service as the trigger and define the event name OpenNMS.
After this step you can combine this trigger with any of the possible supported services and their actions.
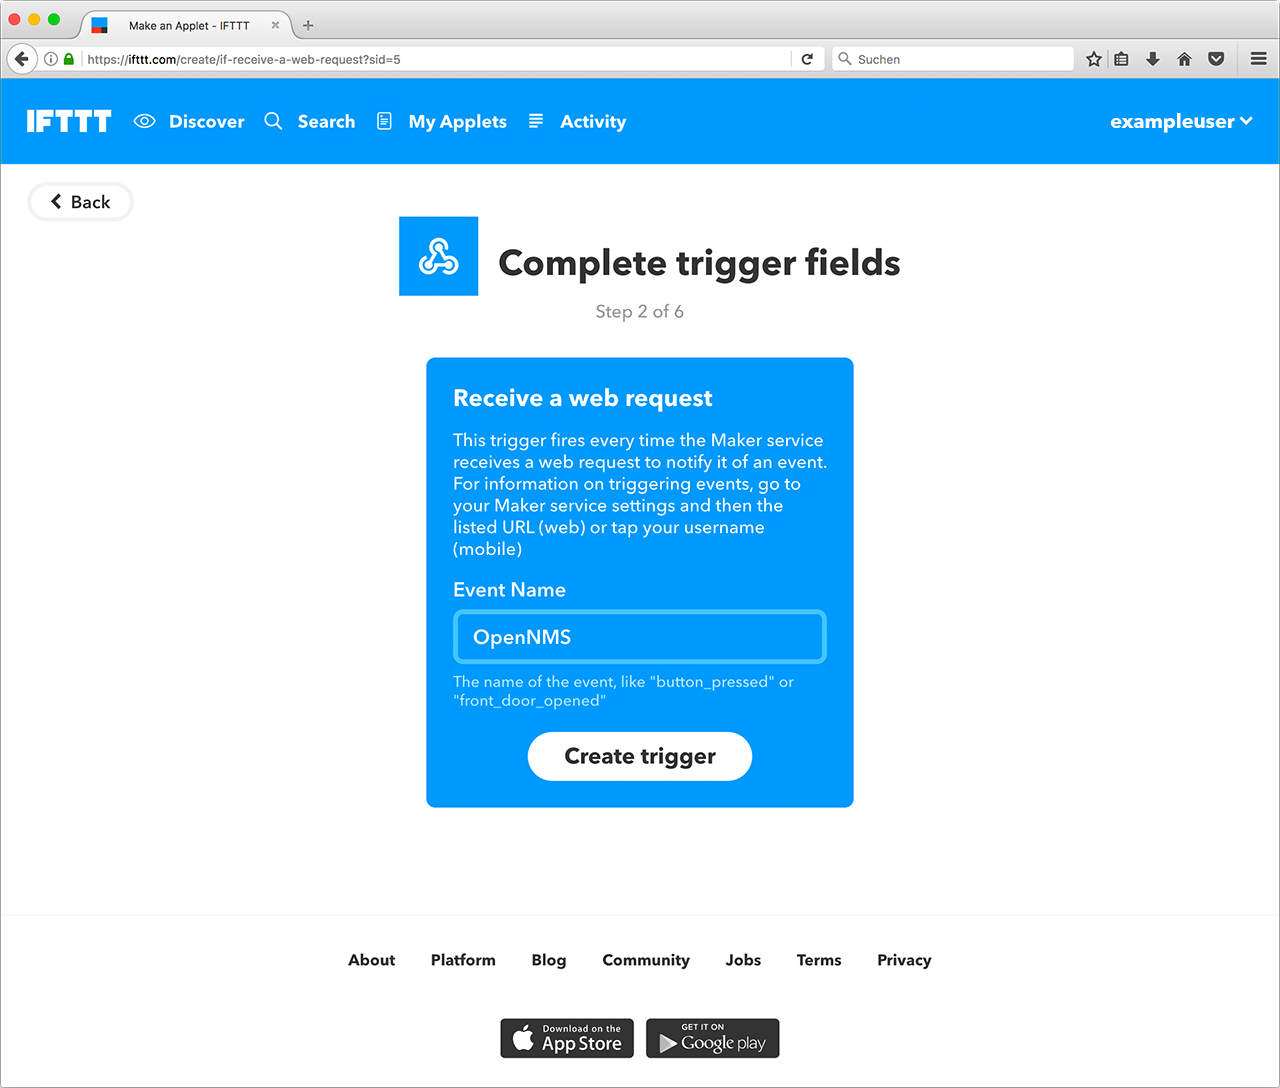
In your account service settings for the "Webhooks" service you find your key in the given service URL.
In the following example this key is X71dfUZsH4Wkl6cjsLjdV.
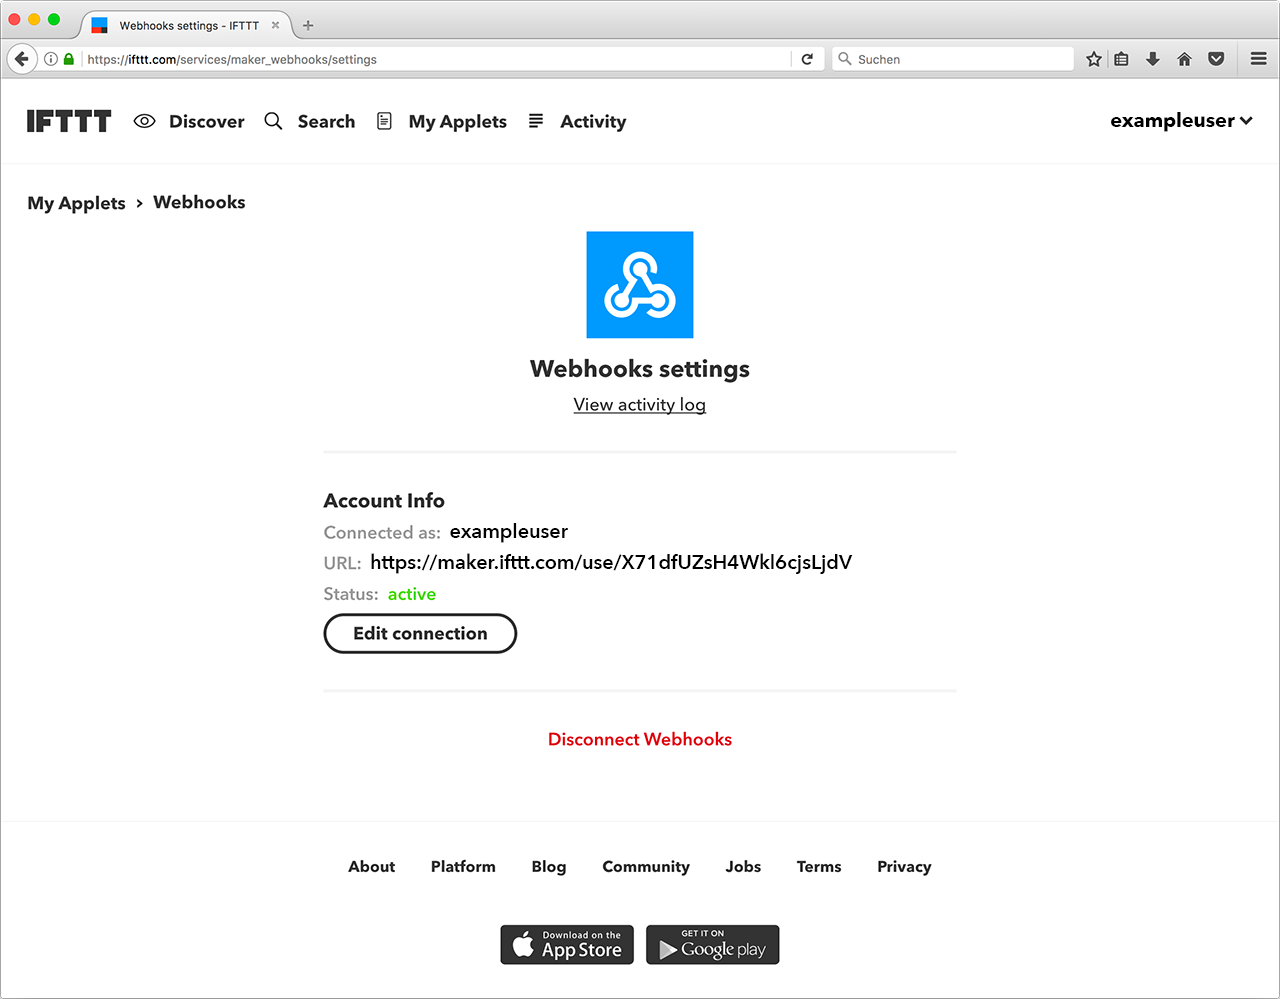
On the side of OpenNMS Horizon you need a configuration that defines which event names to send on an alarm count or severity change.
The configuration file ifttt-config.xml contains so called trigger packages.
The operation is as follows: OpenNMS Horizon retrieves all alarms that have a node associated. Each trigger package defines whether only acknowledged alarms should be taken into account. It then computes the maximum severity and alarm count for each trigger package’s category filter and reduction key filter. After that it triggers all events defined in the corresponding trigger sets for the computed maximum severity. The category and reduction key filter accepts Java regular expressions. Using an empty category filter will use all unacknowledged alarms regardless of whether these alarms have nodes assigned or not.
Each trigger inside a trigger set defines the event name to be triggered and three additional values. These values can be used to set additional attributes for the corresponding IFTTT applet action. The following trigger sets can be defined:
| Name | Execution |
|---|---|
ON |
on start of the IFTTT alarm polling daemon to switch on a device |
OFF |
on stop of the IFTTT alarm polling daemon to switch off a device |
NORMAL |
if severity is NORMAL |
WARNING |
if severity is WARNING |
MINOR |
if severity is MINOR |
MAJOR |
if severity is MAJOR |
CRITICAL |
if severity is CRITICAL |
There are also ON and OFF available for the trigger set definition.
The ON event will be sent when the polling daemon is started and the OFF when it is stopped.
These events can be used to powering up/down and initializing devices.
25.2. OpenNMS Configuration
IFTTT alarm polling will be enabled by setting the attribute enabled to true in the ifttt-config.xml file.
It is also possible to configure the polling interval.
The following trigger package defined the trigger sets which itself define a sequence of events to be triggered at IFTTT.
Each trigger defines the eventName and an additional delay.
This allows to defer the execution of the next trigger in a trigger set.
25.3. Example
The following example shows the configuration file for a WiFi light bulb controlled via IFTTT.
The defined applets use value1 for setting the color and value2 for setting the brightness.
The third value demonstrate the use of placeholders.
For the severity-based trigger sets the following placeholders can be used in the three value fields:
%os%/%oldSeverity for old severity, %ns%/%newSeverity% for new severity, %oc%/%oldCount for old alarm count and %nc%/``%newCount% for new alarm count.
This is useful for sending messages or operating LED displays via IFTTT.
<ifttt-config enabled="true" key="X71dfUZsH4Wkl6cjsLjdV" pollInterval="30">
<trigger-package categoryFilter="Routers|Switches" reductionKeyFilter=".*" onlyUnacknowledged="true">
<trigger-set name="ON">
<trigger eventName="on" delay="0">
<value1></value1>
<value2></value2>
<value3></value3>
</trigger>
</trigger-set>
<trigger-set name="OFF">
<trigger eventName="off" delay="0">
<value1></value1>
<value2></value2>
<value3></value3>
</trigger>
</trigger-set>
<trigger-set name="NORMAL">
<trigger eventName="OpenNMS" delay="0">
<value1>#336600</value1>
<value2>0.40</value2>
<value3>%os%,%ns%,%oc%,%nc%</value3>
</trigger>
</trigger-set>
<trigger-set name="WARNING">
<trigger eventName="OpenNMS" delay="0">
<value1>#FFCC00</value1>
<value2>0.50</value2>
<value3>%os%,%ns%,%oc%,%nc%</value3>
</trigger>
</trigger-set>
<trigger-set name="MINOR">
<trigger eventName="OpenNMS" delay="0">
<value1>#FF9900</value1>
<value2>0.60</value2>
<value3>%os%,%ns%,%oc%,%nc%</value3>
</trigger>
</trigger-set>
<trigger-set name="MAJOR">
<trigger eventName="OpenNMS" delay="0">
<value1>#CC3300</value1>
<value2>0.70</value2>
<value3>%os%,%ns%,%oc%,%nc%</value3>
</trigger>
</trigger-set>
<trigger-set name="CRITICAL">
<trigger eventName="OpenNMS" delay="0">
<value1>#FF0000</value1>
<value2>0.80</value2>
<value3>%os%,%ns%,%oc%,%nc%</value3>
</trigger>
</trigger-set>
<trigger-package>
</ifttt-config>26. DNS Resolver
The DNS Resolver is used internally by OpenNMS modules and functions to provide lookup functionality as required.
26.1. Modules that use DNS Resolution
26.2. Configuring DNS Resolution
In order to customize the DNS servers that are queried, the following commands can be used:
$ ssh -p 8201 admin@localhost
...
admin@minion()> config:edit org.opennms.features.dnsresolver.netty
admin@minion()> property-set nameservers 8.8.8.8,4.2.2.2:53,[::1]:5353
admin@minion()> property-set query-timeout-millis 5000
admin@minion()> property-set max-cache-size 10000
admin@minion()> config:updateIf no nameservers are set (or set to an empty string), the servers configured by the system running the JVM will be used.
The resolved host names are cached for their TTL as specified in the returned DNS records.
TTL handling can be customized by setting the min-ttl-seconds, max-ttl-seconds and negative-ttl-seconds properties in the configuration above.
26.3. Configuring Circuit Breaker
Circuit Breaker functionality exist that helps prevent your DNS infrastructure from being flooded with requests when multiple failures occur.
It is enabled by default but can be disabled by setting breaker-enabled to false.
Additional parameters can be modified to tune the functionality of the circuit breaker:
$ ssh -p 8201 admin@localhost
...
admin@minion()> config:edit org.opennms.features.dnsresolver.netty
admin@minion()> property-set breaker-enabled true
admin@minion()> property-set breaker-failure-rate-threshold 80
admin@minion()> property-set breaker-wait-duration-in-open-state 15
admin@minion()> property-set breaker-ring-buffer-size-in-half-open-state 10
admin@minion()> property-set breaker-ring-buffer-size-in-closed-state 100
admin@minion()> config:update
If the circuit breaker is disabled, the lookup statistics lookupsSuccessful and lookupsFailed are no longer tracked.
|
26.4. Configuring Bulkhead
A bulkhead is used to limit the number of concurrent DNS lookups that can be made.
Additional parameters can be modified to tune the functionality of the circuit breaker:
$ ssh -p 8201 admin@localhost
...
admin@minion()> config:edit org.opennms.features.dnsresolver.netty
admin@minion()> property-set bulkhead-max-concurrent-calls 1000
admin@minion()> property-set bulkhead-max-wait-duration-millis 5100
admin@minion()> config:update27. Telemetry Daemon
The telemetry daemon (telemetryd) provides an extensible framework you can use to handle sensor data pushed to OpenNMS Horizon. Use the framework to support applications that use different protocols to transfer metrics. With telemetryd, operators can define listeners supporting different protocols to receive the telemetry data and adapters transferring the received data into generic formats like flows or performance data.
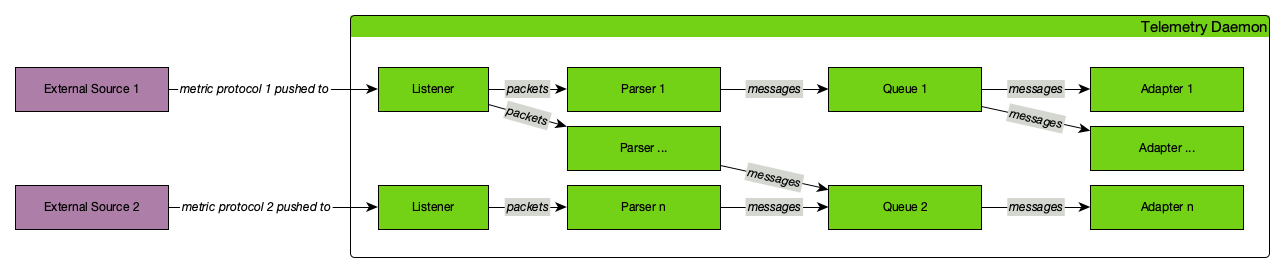
The configuration is split in two parts. Listeners and attached Parsers on one side, receive telemetry data transported over a specific protocol and parse the protocol according to its specification. On the other side, Adapters pick up the parsed data and enrich it before persisting it.
Queues transport the parsed telemetry data from Parsers to Adapters by binding a specific Parser to a specific Adapter.
27.1. Listeners and Parsers
Listeners receive sensor data from an external source and hand them off to Parsers, which handle the transport protocol format and extract the transported data.
A Listener does the transport protocol handling like opening a socket and accepting incoming connections. The received messages are then passed to the parser configured for the Listener which parses the concrete protocol implementation and extracts all available information out of the received message. For further processing, the extracted data is handed over to the configured queue.
For example: a Listener may open a UDP socket for receiving packets and an assigned Parser parses the incoming IPFIX packets.
Parsers and Listeners must work together closely. Therefore, they cannot be combined in any random way. Which Parser is supported by which Listener is described in the documentation of each respective Parser.
27.2. Adapters
Adapters enrich and process the data dispatched over a queue. They receive the data from queue and transform it into a format usable by OpenNMS Horizon. Adapters can also enrich the incoming data to attach node or interface information, depending on information already available.
For example: an Adapter may be used to transform telemetry data received via sFlow into performance data and persist it to the applicable node.
As an Adapter must handle data dependent to a transport protocol, not all Adapters can be used in combination with any possible Parser. Which Parsers are supported by which Adapters is described in the documentation of each respective Adapter.
If you have multiple Adapters, the execution order is the same as defined in the telemetryd-configuration.xml.
|
27.2.1. Working with Minions
Listeners and parsers run on Minion, but adapters do not. Adapters run on Sentinel, while the main OpenNMS Horizon instance can run listeners, parsers, and adapters. When using Minion as a listener, you must use adapters on OpenNMS Horizon or Sentinel to transform the data.
27.3. Queues
Queues transfer data between Parsers and Adapters and are represented by a channel in the messaging system.
27.3.1. Configuring Queues
The following options can help fine-tune queue behavior:
| Queue attribute (OpenNMS) | Key (Minion/Sentinel) | Description | Default value |
|---|---|---|---|
|
|
Number of threads used for consuming & dispatching messages. |
(2 * number of cores) |
|
|
Maximum number of messages to keep in memory while waiting to be dispatched. |
10000 |
|
|
Whether to use the routing key when forwarding messages to the broker. This enforces ordering of the messages. |
true |
|
|
Messages are aggregated in batches before being dispatched. When the batch reaches this size, it will be dispatched. |
1000 |
|
|
Messages are aggregated in batches before being dispatched. When the batch has been created for longer than this interval (ms) it will be dispatched, regardless of the current size. |
500 |
When using Kafka as a message broker, setting use-routing-key to false allows the messages to be balanced across all partitions.
This can be done safely for flows, but is not supported for metrics when using thresholding (order is required).
|
When setting these options in OpenNMS they can be added as an attribute to the <queue> element.
For example:
<queue name="IPFIX" use-routing-key="false">
...
</queue>When setting these options on Minion you can add them as parser properties, and on Sentinel as adapter properties:
name=IPFIX-Listener
class-name=org.opennms.netmgt.telemetry.listeners.UdpListener
parameters.host=0.0.0.0
parameters.port=4738
parsers.0.name=IPFIX
parsers.0.class-name=org.opennms.netmgt.telemetry.protocols.netflow.parser.IpfixUdpParser
parsers.0.queue.use-routing-key=false27.4. Push Sensor Data through Minion
Listeners and their Parsers may run on either OpenNMS Horizon or Minion, whereas adapters run on OpenNMS Horizon or Sentinel. If a Listener and its Parsers are running on Minion, the received messages will be automatically dispatched to the associated Adapters running in OpenNMS Horizon or Sentinel via a Queue. Minions can listen (receive) data, but requires OpenNMS Horizon or Sentinel to process.
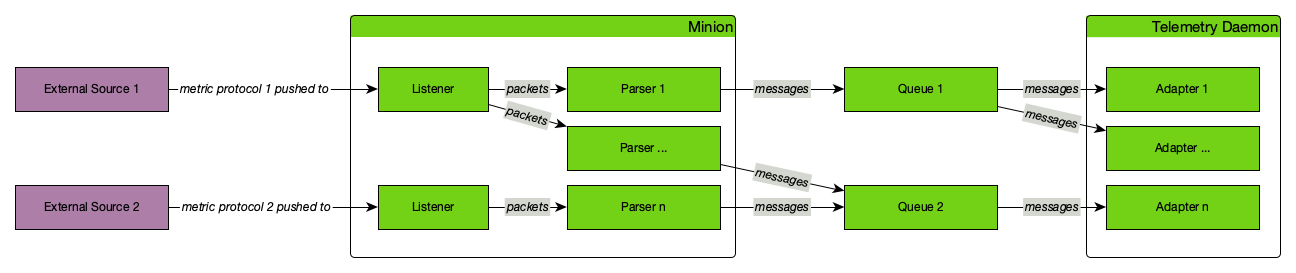
27.5. Reverse hostname resolution
Some Parsers support reverse hostname resolution to annotate IP addresses with the actual hostname. The Minion performs the reverse name lookup while parsing the protocol data. The resolved hostname, if found, is attached to the address information and both are sent to the Adapter for further processing.
For more information see DNS Resolver
The following Parsers currently support reverse hostname resolution: Netflow v5, Netflow v9, IPFIX and sFlow.
27.6. Listener Reference
27.6.1. TCP Listener
The TCP Listener accepts incoming TCP connections and forwards the TCP stream to a single Parser.
Facts
Class Name |
|
Supported on Minion |
|
Parameters
| Parameter | Description | Required | Default value |
|---|---|---|---|
|
IP address on which to bind the TCP port |
optional |
|
|
TCP port number on which to listen |
optional |
|
27.6.2. UDP Listener
The UDP Listener can be used to open a UDP socket and forward the received packets to a Parser.
The UDP Listener can support multiple Parsers if all of these Parsers support protocol detection. If this is the case, each Parser defined for the Listener will be asked if it can handle the incoming packet. The first Parser that accepts the packet is then used to parse the packet and dispatch it to its Queue.
If only a single Parser is defined in the Listener, the packet is directly handed over for parsing.
Facts
Class Name |
|
Supported on Minion |
|
Parameters
| Parameter | Description | Required | Default value |
|---|---|---|---|
|
IP address on which to bind the UDP port |
optional |
|
|
UDP port number on which to listen |
optional |
|
|
Maximum packet size in bytes (anything greater will be truncated) |
optional |
|
27.7. Protocol Reference
27.7.1. BGP Monitoring Protocol
The BGP Monitoring Protocol (BMP) provides a convenient interface for obtaining route views. The integration in OpenNMS Horizon allows you to use these route views, status updates and statistics for monitoring and management.
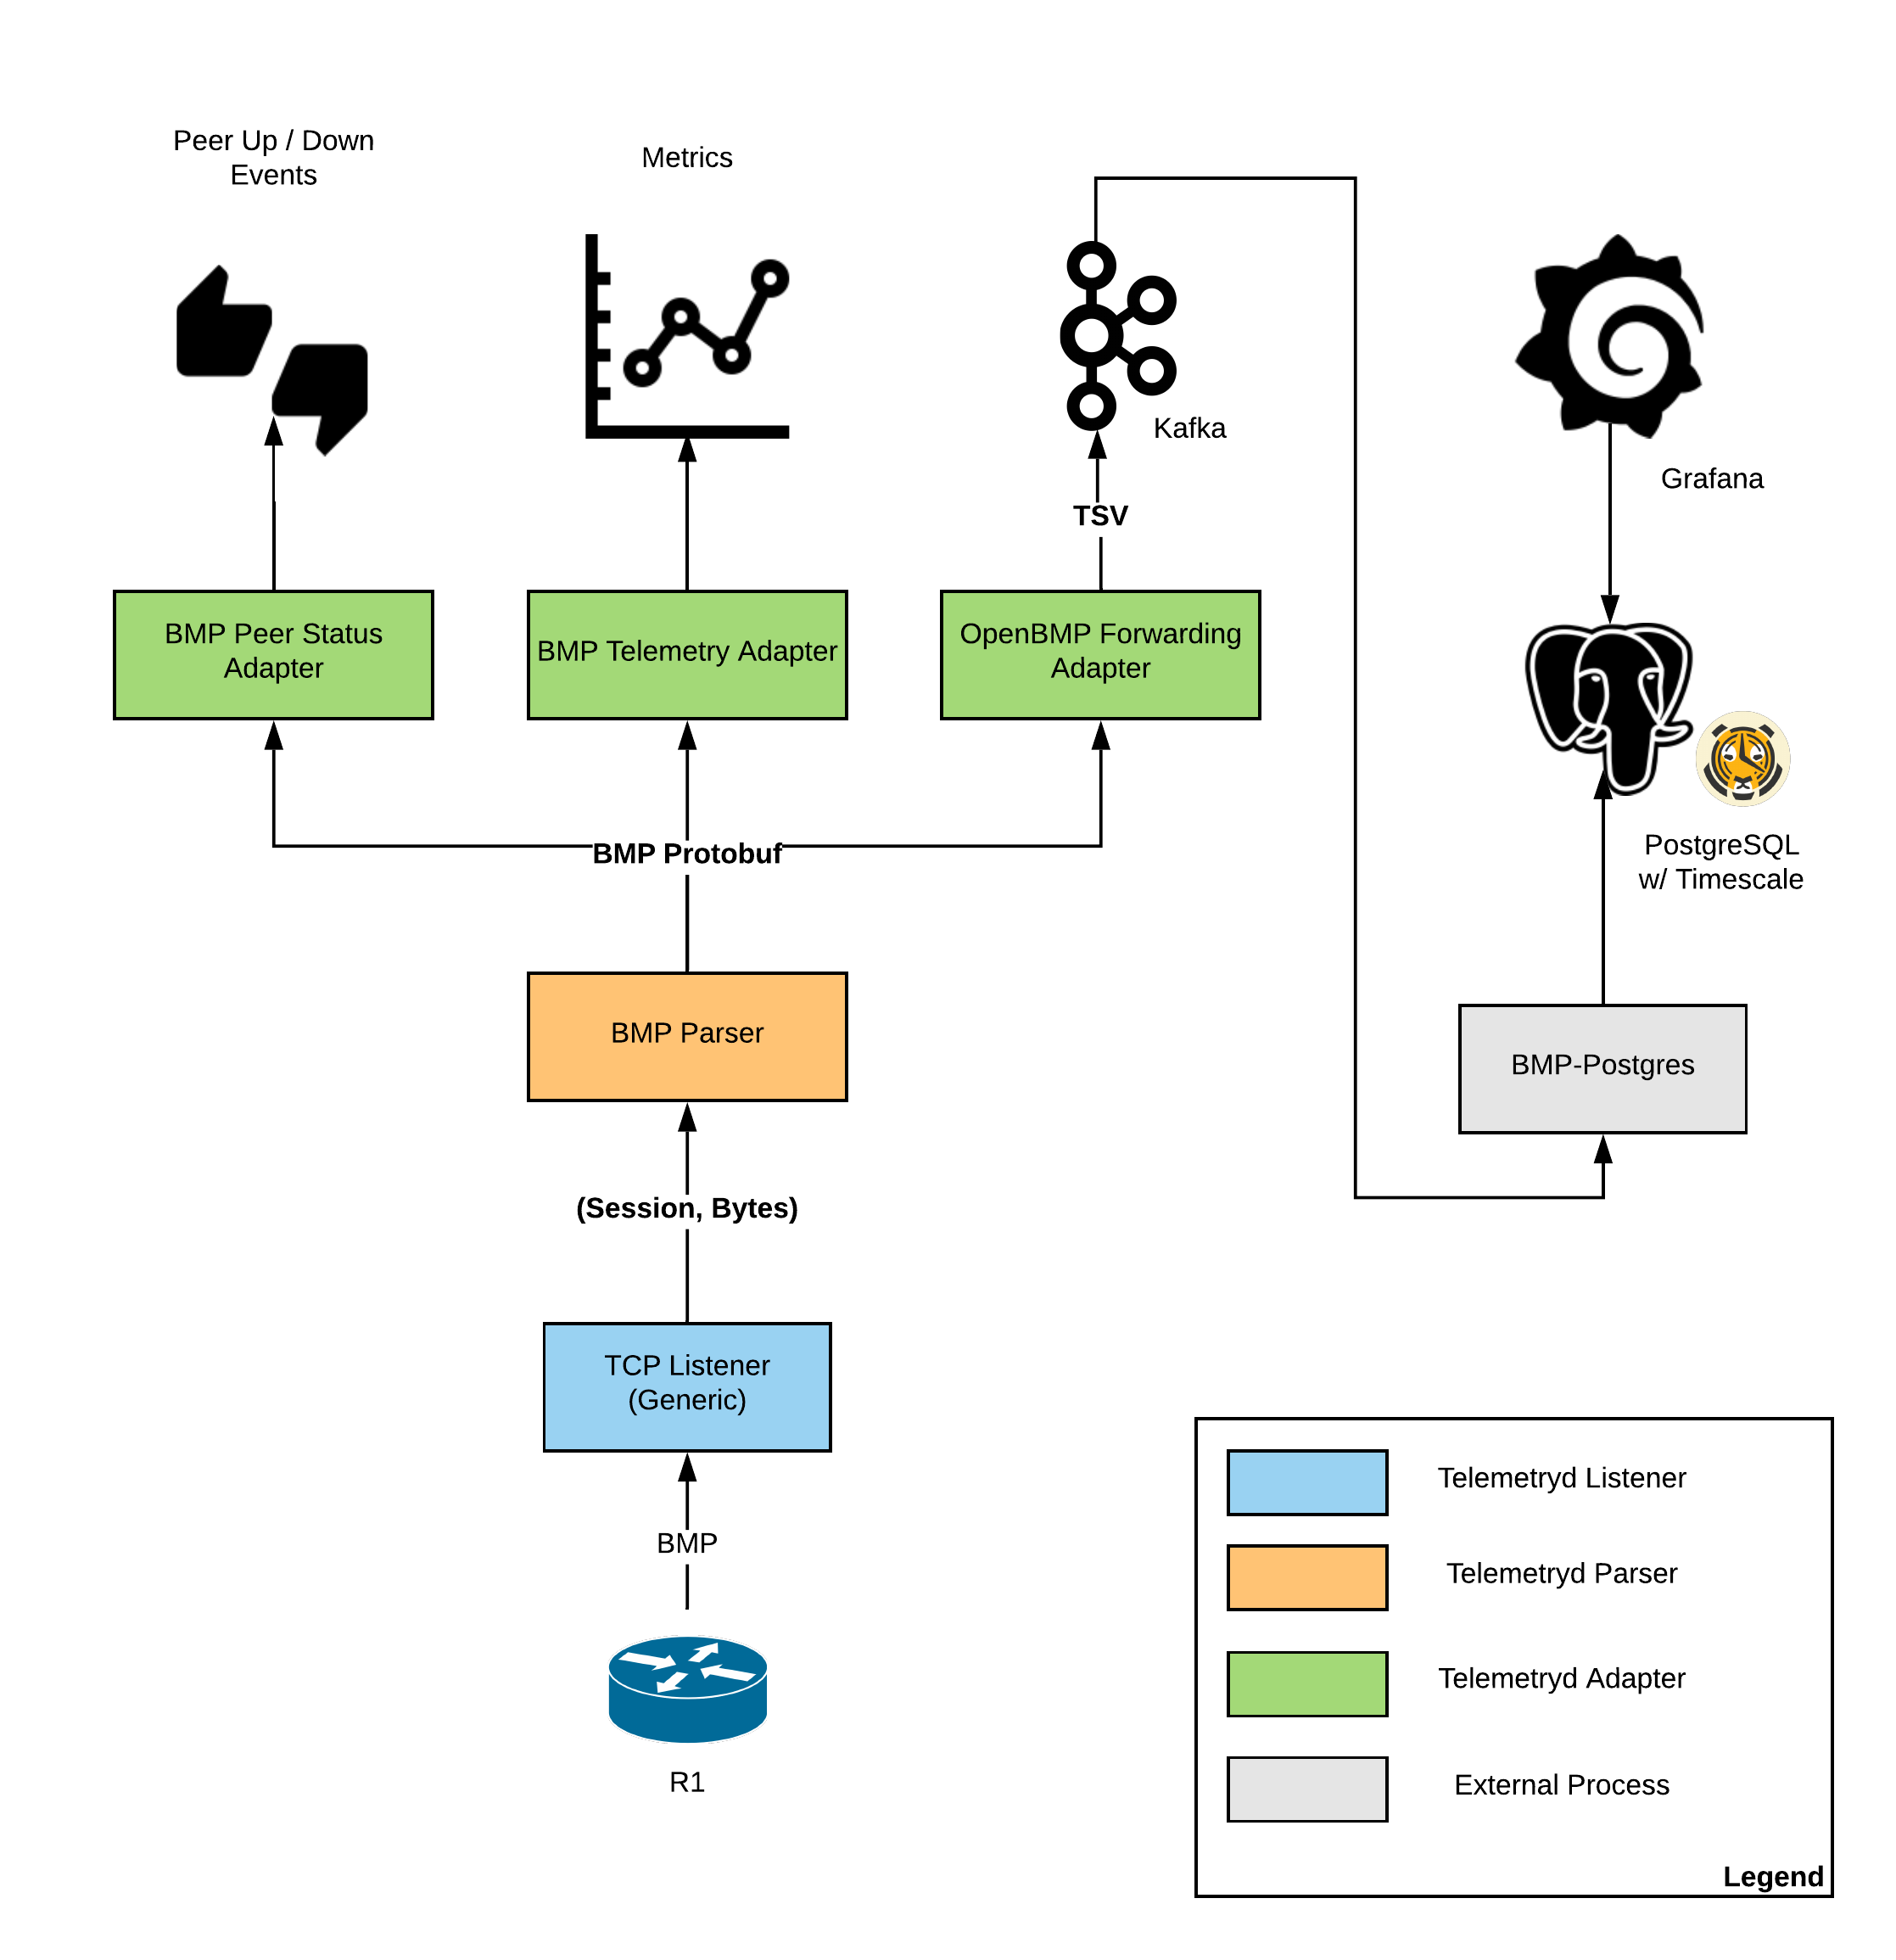
BMP TCP Parser
The BMP Parser accepts BMP connections from router packets using a TCP Listener.
Facts
Class Name |
|
Parameters
| Parameter | Description | Required | Default value |
|---|---|---|---|
|
Enable or disable DNS resolution of router and peer hostnames. |
no |
true |
|
Limits the number of parallel parsing operations. |
no |
1000 |
|
Limits the amount of time to wait for a saturated bulkhead (in milliseconds). |
no |
5 Minutes |
Configure BMP Listener on a Minion
To enable and configure a TCP Listener for BMP on Minion, connect to the Karaf Console and set the following properties:
$ ssh -p 8201 admin@localhost
...
admin@minion()> config:edit --alias tcp-5000 --factory org.opennms.features.telemetry.listeners
admin@minion()> config:property-set name BMP
admin@minion()> config:property-set class-name org.opennms.netmgt.telemetry.listeners.TcpListener
admin@minion()> config:property-set parameters.port 5000
admin@minion()> config:property-set parsers.0.name BMP
admin@minion()> config:property-set parsers.0.class-name org.opennms.netmgt.telemetry.protocols.bmp.parser.BmpParser
admin@minion()> config:update| The protocol must also be enabled on OpenNMS Horizon for the messages to be processed. If you do not specify the queue name, the fallback is the name of the parser. |
BMP Telemetry Adapter
The BMP Telemetry Adapter handles BMP statistics received and parsed by the BMP Parser. Statistics received from the router are associated as performance data with that router. The router must exist as a regular node in OpenNMS Horizon.
OpenNMS Horizon uses the IP address exporting BMP messages to associate a router with the particular OpenNMS Horizon node.
In addition, the node’s metadata can specify a BGP ID, which will then be used to associate routers.
If the parameter metaDataNodeLookup is not empty, it will be interpreted as a context:key metadata name, which will be used to lookup a node that has stored the queried BGP ID as a value in exactly this key.
Facts
Class Name |
|
Parameters
| Parameter | Description | Required | Default value |
|---|---|---|---|
|
Enables lookup using BGP IDs. |
no |
BMP Peer Status Adapter
The BMP Peer Status Adapter creates events for peer status changes. It handles BMP Peer Up and Down messages that the BMP Parser receives and parses, and converts to OpenNMS Horizon events. OpenNMS Horizon associates the created events with the router sending the messages. This router must exist as regular node in OpenNMS Horizon.
The events are called uei.opennms.org/bmp/peerUp and uei.opennms.org/bmp/peerDown.
OpenNMS Horizon uses the IP address exporting BMP messages to associate a router with the particular OpenNMS Horizon node.
In addition, the node’s metadata can specify a BGP ID, which will then be used to associate routers.
If the parameter metaDataNodeLookup is not empty, it will be interpreted as a context:key metadata name, which will be used to lookup a node that has stored the queried BGP ID as a value in exactly this key.
Facts
Class Name |
|
Parameters
| Parameter | Description | Required | Default value |
|---|---|---|---|
|
Enables lookup using BGP IDs. |
no |
OpenBMP Integration Adapter
The OpenBMP Integration Adapter integrates with an existing OpenBMP installation. It handles BMP messages the BMP Parser receives and parses, and creates OpenBMP-compatible messages, which are then passed to the OpenBMP Kafka cluster.
This setup replaces the Collector component of OpenBMP.
Facts
Class Name |
|
Parameters
| Parameter | Description | Required | Default value |
|---|---|---|---|
|
Uses options to create OpenBMP Kafka producer. Allows all known Kafka settings, but prefixed with |
no |
|
|
Prefix used before each Kafka topic. |
no |
27.7.2. IPFIX
The IP Flow Information Export (IPFIX) protocol is a vendor-neutral standard for transmitting traffic flow information. See Flow Support for details on flow support in OpenNMS Horizon.
IPFIX UDP Parser
The IPFIX UDP Parser accepts packets received by a UDP Listener and must forward them to an IPFIX Adapter.
The IPFIX UDP Parser supports protocol detection.
Facts
Class Name |
|
Parameters
| Parameter | Description | Required | Default value |
|---|---|---|---|
|
Templates must be redeclared in the given duration or they will be dropped. |
no |
30 minutes |
|
The maximum delta in seconds between exporter and Minion timestamps. |
no |
0 |
|
Used to rate-limit clock skew events in seconds. |
no |
3600 |
|
Used to enable or disable DNS resolution for flows. |
no |
true |
IPFIX TCP Parser
The IPFIX TCP Parser accepts packets received by a TCP Listener and must forward them to a IPFIX Adapter.
Facts
Class Name |
|
Parameters
This parser does not currently have any configurable parameters.
Configure IPFIX Listener on a Minion
To enable and configure a TCP Listener for IPFIX on Minion, connect to the Karaf Console and set the following properties:
$ ssh -p 8201 admin@localhost
...
admin@minion()> config:edit --alias tcp-50000 --factory org.opennms.features.telemetry.listeners
admin@minion()> config:property-set name IPFIX
admin@minion()> config:property-set class-name org.opennms.netmgt.telemetry.listeners.TcpListener
admin@minion()> config:property-set parameters.port 50000
admin@minion()> config:property-set parsers.0.name IPFIX
admin@minion()> config:property-set parsers.0.class-name org.opennms.netmgt.telemetry.protocols.netflow.parser.IpfixParser
admin@minion()> config:update| The protocol must also be enabled on OpenNMS Horizon for the messages to be processed. If you do not specify the queue name, the fallback is the name of the parser. |
IPFIX Adapter
The IPFIX Adapter handles IPFIX telemetry data received and parsed by either of the IPFIX UDP Parser or IPFIX TCP Parser. Received flows are decoded from the messages into the canonical flow format and published to the flow repository.
Facts
Class Name |
|
Parameters
| Parameter | Description | Required | Default value |
|---|---|---|---|
|
Templates must be redeclared in the given duration or they will be dropped. |
no |
30 minutes |
|
The maximum delta in seconds between exporter and Minion time stamps. |
no |
0 |
|
Used to rate-limit clock skew events in seconds. |
no |
3600 |
|
Used to enable or disable DNS resolution for flows. |
no |
true |
The parameter maxClockSkew in your parser definition enables clock skew detection for exporters.
It specifies the maximum delta in seconds between exporter and Minion timestamps.
If exceeded, an alarm will be generated for the exporting device.
The default value is 0, so clock skew detection is disabled.
Furthermore, a parameter clockSkewEventRate can be used to rate-limit clock skew events.
The default is 3600 seconds, so every hour an event will be sent.
|
27.7.3. Junos Telemetry Interface
The Junos Telemetry Interface (JTI) allows users to push operational statistics asynchronously to OpenNMS Horizon. OpenNMS Horizon sends a request to stream periodic updates once to the device. Data is generated as Google protocol buffers (gpb) structured messages over UDP. For detailed information about JTI, see the Juniper Documentation.
To enable support for JTI, edit ${OPENNMS_HOME}/etc/telemetryd-configuration.xml set enabled=true for JTI protocol.
<listener name="JTI-UDP-50000" class-name="org.opennms.netmgt.telemetry.listeners.simple.Udp" enabled="false">
<parameter key="port" value="50000"/>
<parser name="JTI-Parser" class-name="org.opennms.netmgt.telemetry.protocols.common.parser.ForwardParser" queue="JTI" />
</listener>
<queue name="JTI">
<adapter name="JTI-GPB" class-name="org.opennms.netmgt.telemetry.protocols.jti.adapter.JtiGpbAdapter" enabled="false">
<parameter key="script" value="${install.dir}/etc/telemetryd-adapters/junos-telemetry-interface.groovy"/>
<package name="JTI-Default">
<rrd step="300">
<rra>RRA:AVERAGE:0.5:1:2016</rra>
<rra>RRA:AVERAGE:0.5:12:1488</rra>
<rra>RRA:AVERAGE:0.5:288:366</rra>
<rra>RRA:MAX:0.5:288:366</rra>
<rra>RRA:MIN:0.5:288:366</rra>
</rrd>
</package>
</adapter>
</queue>Apply the changes without restarting by sending a reloadDaemonConfig event in the CLI or the Web UI:
${OPENNMS_HOME}bin/send-event.pl -p 'daemonName Telemetryd' uei.opennms.org/internal/reloadDaemonConfigBy default, this will open a UDP socket bound to 0.0.0.0:50000 to which JTI messages can be forwarded.
Configure JTI Listener on a Minion
To enable and configure a UDP Listener for JTI on Minion, connect to the Karaf Console and set the following properties:
$ ssh -p 8201 admin@localhost
...
admin@minion()> config:edit --alias udp-50000 --factory org.opennms.features.telemetry.listeners
admin@minion()> config:property-set name JTI
admin@minion()> config:property-set class-name org.opennms.netmgt.telemetry.listeners.UdpListener
admin@minion()> config:property-set parameters.port 50000
admin@minion()> config:property-set parsers.0.name JTI
admin@minion()> config:property-set parsers.0.class-name org.opennms.netmgt.telemetry.protocols.common.parser.ForwardParser
admin@minion()> config:update| The protocol must also be enabled on OpenNMS Horizon for the messages to be processed. |
JTI Adapter
The JTI adapter handles Junos Telemetry Interface payloads. Messages are decoded using the published protobuf specifications and forwarded to a JSR-223-compatible script (i.e., Beanshell or Groovy) for further processing. Use the script extension to extract the desired metrics from the JTI messages and persist the results as time series data.
Facts
Class Name |
|
Parameters
| Parameter | Description | Required | Default value |
|---|---|---|---|
|
Full path to the script used to handle the JTI messages |
required |
(none) |
Scripting
The script will be invoked for every JTI message that is received and succesfully decoded.
The following globals will be passed to the script:
| Parameter | Description | Type |
|---|---|---|
|
The agent (node) against which the metrics will be associated. |
|
|
Builder in which to add the resources and metrics. |
|
|
Decoded JTI message from which the metrics should be extracted. |
|
27.7.4. NetFlow v5
See Flow Support for details on flow support in OpenNMS Horizon.
Netflow v5 UDP Parser
The Netflow v5 UDP Parser accepts packets received by a UDP Listener and must forward them to a Netflow v5 Adapter.
The Netflow v5 UDP Parser supports protocol detection.
Facts
Class Name |
|
Parameters
| Parameter | Description | Required | Default value |
|---|---|---|---|
|
The maximum delta in seconds between exporter and Minion timestamps. |
no |
0 |
|
Used to rate-limit clock skew events in seconds. |
no |
3600 |
|
Used to enable or disable DNS resolution for flows. |
no |
true |
Netflow v5 Adapter
The Netflow v5 Adapter is used to handle Netflow v5 payloads received and parsed by by the Netflow v5 UDP Parser. Flows are decoded from the messages into the canonical flow format and are published to the flow repository
Facts
Class Name |
|
Parameters
This adapter does not currently have any configurable parameters.
27.7.5. NetFlow v9
See Flow Support for details on flow support in OpenNMS Horizon.
Netflow v9 UDP Parser
The Netflow v9 UDP Parser accepts packets received by a UDP Listener and must forward them to a Netflow v9 Adapter.
The Netflow v9 UDP Parser supports protocol detection.
Facts
Class Name |
|
Parameters
| Parameter | Description | Required | Default value |
|---|---|---|---|
|
Templates must be re-declared in the given duration or they will be dropped. |
no |
30 minutes |
|
The maximum delta in seconds between exporter and Minion timestamps. |
no |
0 |
|
Used to rate-limit clock skew events in seconds. |
no |
3600 |
|
Used to enable or disable DNS resolution for flows. |
no |
true |
Netflow v9 Adapter
The Netflow v9 Adapter is used to handle Netflow v9 payloads received and parsed by by the Netflow v9 UDP Parser. Flows are decoded from the messages into the canonical flow format and are published to the flow repository
Facts
Class Name |
|
Parameters
This adapter does not currently have any configurable parameters.
The parameter maxClockSkew in your parser definition enables clock skew detection for exporters.
It specifies the maximum delta in seconds between exporter and Minion time stamps.
If exceeded, an alarm will be generated for the exporting device.
The default value is 0, so clock skew detection is disabled.
Furthermore, a parameter clockSkewEventRate can be used to rate-limit clock skew events.
The default is 3600 seconds, so every hour an event will be sent.
|
27.7.6. Cisco NX-OS Telemetry
The Cisco NX-OS Telemetry allows to push operational statistics asynchronously to OpenNMS Horizon. OpenNMS Horizon sends a request to stream periodic updates once to the device. Data is generated as Google protocol buffers (gpb) structured messages over UDP. Detailed information about NX-OS can be found in NXOS Documentation.
To enable support for NX-OS Telemetry, edit ${OPENNMS_HOME}/etc/telemetryd-configuration.xml set enabled=true for NXOS protocol.
<listener name="NXOS-UDP-50001" class-name="org.opennms.netmgt.telemetry.listeners.simple.Udp" enabled="false">
<parameter key="port" value="50001"/>
<parser name="NXOS-GPB" class-name="org.opennms.netmgt.telemetry.protocols.common.parser.ForwardParser" queue="NXOS" />
</listener>
<queue name="NXOS">
<adapter name="NXOS-GPB" class-name="org.opennms.netmgt.telemetry.protocols.nxos.adapter.NxosGpbAdapter" enabled="false">
<parameter key="script" value="${install.dir}/etc/telemetryd-adapters/cisco-nxos-telemetry-interface.groovy"/>
<package name="NXOS-Default">
<rrd step="300">
<rra>RRA:AVERAGE:0.5:1:2016</rra>
<rra>RRA:AVERAGE:0.5:12:1488</rra>
<rra>RRA:AVERAGE:0.5:288:366</rra>
<rra>RRA:MAX:0.5:288:366</rra>
<rra>RRA:MIN:0.5:288:366</rra>
</rrd>
</package>
</adapter>
</queue>Apply the changes without restarting by sending a reloadDaemonConfig event in the CLI or the WebUI:
${OPENNMS_HOME}bin/send-event.pl -p 'daemonName Telemetryd' uei.opennms.org/internal/reloadDaemonConfigBy default, this will open a UDP socket bound to 0.0.0.0:50001 to which NXOS messages can be forwarded.
Configure NX-OS Listener on a Minion
To enable and configure an UDP Listener for NX-OS on Minion, connect to the Karaf Console and set the following properties:
$ ssh -p 8201 admin@localhost
...
admin@minion()> config:edit --alias udp-50001-nxos --factory org.opennms.features.telemetry.listeners
admin@minion()> config:property-set name NXOS
admin@minion()> config:property-set class-name org.opennms.netmgt.telemetry.listeners.UdpListener
admin@minion()> config:property-set parameters.port 50001
admin@minion()> config:property-set parsers.0.name NXOS
admin@minion()> config:property-set parsers.0.class-name org.opennms.netmgt.telemetry.protocols.common.parser.ForwardParser
admin@minion()> config:update| The protocol must also be enabled on OpenNMS Horizon for the messages to be processed. |
Cisco NX-OS Adapter
The NX-OS adapter is used to handle Cisco NX-OS Telemetry payloads. Messages are decoded using the published protobuf (proto3) specifications and forwarded to a JSR-223 compatible script (i.e. Beanshell or Groovy) for further processing. Using the script extension you can extract the desired metrics from the NX-OS messages and persist the results as time series data.
Facts
Class Name |
|
Parameters
| Parameter | Description | Required | Default value |
|---|---|---|---|
|
Full path to the script used to handle the NXOS messages |
required |
(none) |
Scripting
The script will be invoked for every NX-OS message that is received and succesfully decoded.
The following globals will be passed to the script:
| Parameter | Description | Type |
|---|---|---|
|
The agent (node) against which the metrics will be associated |
|
|
Builder in which the resources and metrics should be added |
|
|
Decoded NX-OS message from which the metrics should be extracted |
|
27.7.7. sFlow
sFlow is capable of transporting both, telemetry data and flow information. OpenNMS Horizon can utilize both data types and extract and persist accordingly.
See Flow Support for details on flow support in OpenNMS Horizon.
sFlow UDP Parser
The sFlow UDP Parser accepts packets received by a UDP Listener and must forward them to a sFlow Adapter.
The sFlow UDP Parser supports protocol detection.
Facts
Class Name |
|
Parameters
| Parameter | Description | Required | Default value |
|---|---|---|---|
|
Used to enable or disable DNS resolution for flows. |
no |
true |
sFlow Adapter
The sFlow Adapter is used to handle sFlow data received and parsed by the sFlow Parser. Flows are decoded from the messages into the canonical flow format and are published to the flow repository.
Facts
Class Name |
|
Parameters
This adapter does not currently have any configurable parameters.
sFlow Telemetry Adapter
The sFlow Telemetry Adapter is used to handle sFlow telemetry data received and parsed by the sFlow UDP Parser. The telemetry data is forwarded to a JSR-223 compatible script (i.e. Beanshell or Groovy) for further processing. Using the script extension you can extract the desired metrics from the sFlow messages and persist the results as time series data.
Facts
Class Name |
|
Parameters
| Parameter | Description | Required | Default value |
|---|---|---|---|
|
Full path to the script used to handle the sFlow messages |
required |
(none) |
Scripting
The script will be invoked for every sFlow (extended) counter sample that is received.
The following globals will be passed to the script:
| Parameter | Description | Type |
|---|---|---|
|
The agent (node) against which the metrics will be associated |
|
|
Builder in which the resources and metrics should be added |
|
|
sFlow (extended) counter sample |
dynamic Map |
See sFlow Specification for the contained fields and their meaning.
27.7.8. Graphite Telemetry
The Graphite telemetry adapter allows you to push telemetry data over UDP to OpenNMS Horizon using the plaintext protocol.
To enable support for plaintext Graphite over UDP, edit ${OPENNMS_HOME}/etc/telemetryd-configuration.xml set enabled=true for the Graphite protocol.
<listener name="Graphite-UDP-2003" class-name="org.opennms.netmgt.telemetry.listeners.UdpListener" enabled="true">
<parameter key="port" value="2003"/>
<parser name="Graphite-Parser" class-name="org.opennms.netmgt.telemetry.protocols.common.parser.ForwardParser" queue="Graphite" />
</listener>
<queue name="Graphite">
<adapter name="Graphite" class-name="org.opennms.netmgt.telemetry.protocols.graphite.adapter.GraphiteAdapter" enabled="true">
<parameter key="script" value="/Users/ranger/git/opennms-work/target/opennms-26.1.3-SNAPSHOT/etc/telemetryd-adapters/graphite-telemetry-interface.groovy"/>
<package name="Graphite-Default">
<rrd step="300">
<rra>RRA:AVERAGE:0.5:1:2016</rra>
<rra>RRA:AVERAGE:0.5:12:1488</rra>
<rra>RRA:AVERAGE:0.5:288:366</rra>
<rra>RRA:MAX:0.5:288:366</rra>
<rra>RRA:MIN:0.5:288:366</rra>
</rrd>
</package>
</adapter>
</queue>Apply the changes without restarting by sending a reloadDaemonConfig event in the CLI or the WebUI:
${OPENNMS_HOME}bin/send-event.pl -p 'daemonName Telemetryd' uei.opennms.org/internal/reloadDaemonConfigBy default, this will open a UDP socket bound to 0.0.0.0:2003 to which Graphite messages can be forwarded.
Configure Graphite Listener on a Minion
To enable and configure a UDP Listener for Graphite on Minion, connect to the Karaf Console and set the following properties:
$ ssh -p 8201 admin@localhost
...
admin@minion()> config:edit --alias udp-2003 --factory org.opennms.features.telemetry.listeners
admin@minion()> config:property-set name Graphite
admin@minion()> config:property-set class-name org.opennms.netmgt.telemetry.listeners.UdpListener
admin@minion()> config:property-set parameters.port 2003
admin@minion()> config:property-set parsers.0.name Graphite
admin@minion()> config:property-set parsers.0.class-name org.opennms.netmgt.telemetry.protocols.common.parser.ForwardParser
admin@minion()> config:update| The protocol must also be enabled on OpenNMS Horizon for the messages to be processed. |
Graphite Adapter
The Graphite adapter is used to handle Graphite payloads. Messages are decoded and forwarded to a JSR-223 compatible script (i.e. Beanshell or Groovy) for further processing. Using the script extension you can extract the desired metrics from the Graphite messages and persist the results as time series data.
Facts
Class Name |
|
Parameters
| Parameter | Description | Required | Default value |
|---|---|---|---|
|
Full path to the script used to handle the Graphite messages |
required |
(none) |
Scripting
The script will be invoked for every Graphite message that is received and succesfully decoded.
The following globals will be passed to the script:
| Parameter | Description | Type |
|---|---|---|
|
The agent (node) against which the metrics will be associated |
|
|
Builder in which the resources and metrics should be added |
|
|
Decoded message from which the metrics should be extracted |
|
28. Elasticsearch Integration
OpenNMS Horizon persists/forwards certain data to Elasticsearch.
The following chapters describe the configuration possibilities as well as the available features.
Internally all Elasticsearch integrations use the Jest library to access the Elasticsearch ReST interface.
28.1. Configuration
The location of the configuration file depends on the feature.
For flows, it can be found in ${OPENNMS_HOME}/etc/org.opennms.features.flows.persistence.elastic.cfg.
The following properties can be set:
| Property | Description | Required | default |
|---|---|---|---|
elasticUrl |
URL(s) to Elasticsearch nodes. Can either point directly to ReST API or seed nodes. The format is: |
required |
|
elasticIndexStrategy |
Index strategy for data, allowed values yearly, monthly, daily, hourly |
optional |
|
globalElasticUser |
Username to use for all nodes, when X-Pack Security is configured. |
optional |
- |
globalElasticPassword |
Password to use for all nodes, when X-Pack Security is configured. |
optional |
- |
ignoreCertificates |
Set this to ignore HTTPS/SSL/TLS certificates. |
optional |
false |
defaultMaxTotalConnectionPerRoute |
Sets the default max connections per route. If a negative value is given, the value is ignored. |
optional |
|
maxTotalConnection |
Sets the default max total connections. If a negative value is given, the value is ignored. |
optional |
|
nodeDiscovery |
Enable/Disable node discovery. Valid values are |
optional |
|
nodeDiscoveryFrequency |
Defines the frequency in seconds in which the nodes are re-discovered. Must be set, if |
optional |
- |
proxy |
Allows defining a HTTP proxy. Only accepts valid URLs. |
optional |
- |
httpCompression |
Allows the use of HTTP compression. |
optional |
- |
retries |
Defines how many times an operation is retried before considered failed. |
optional |
0 |
retryCooldown |
Defines the cooldown in ms to wait before retrying. Value of |
optional |
|
connTimeout |
Defines the connection timeout in ms. |
optional |
|
readTimeout |
Defines the read timeout in ms. |
optional |
|
bulkRetryCount |
Defines the number of retries performed before a bulk operation is considered as failed. When bulk operations fail, only the failed items are retried. |
optional |
|
settings.index.number_of_shards |
The number of primary shards that an index should have. Refer to Elasticsearch Reference → Index Modules for more details. |
optional |
- |
settings.index.number_of_replicas |
The number of replicas each primary shard has. Refer to Elasticsearch Reference → Index Modules for more details. |
optional |
- |
settings.index.refresh_interval |
How often to perform a refresh operation, which makes recent changes to the index visible to search. Refer to Elasticsearch Reference → Index Modules for more details. |
optional |
- |
settings.index.routing_partition_size |
The number of shards a custom routing valuce can go to. Refer to Elasticsearch Reference → Index Modules for more details. |
optional |
- |
indexPrefix |
Prefix is prepended to the index and template names. Can be used in cases where you want to share the same Elasticsearch cluster with many OpenNMS Horizon instances. |
optional |
- |
| If a configuration management tool is used, the properties file can be created and is used as startup configuration |
| If credentials are provided preemptive auth is used for all defined Elasticsearch nodes. |
elasticUrl=http://elastic:9200
elasticIndexStrategy=daily
globalElasticUser=elastic
globalElasticPassword=changeme28.2. Credentials
It is possible to define credentials for each Elasticsearch node individually.
Credentials for each node must be stored in ${OPENNMS_HOME}/etc/elastic-credentials.xml.
<?xml version="1.0" encoding="UTF-8" standalone="yes"?>
<elastic-credentials>
<credentials url="http://localhost:9200" username="ulf" password="ulf" />
<credentials url="https://10.10.0.1:9333" username="ulf" password="flu" />
</elastic-credentials>| Credentials are globally defined and will be used by each feature. |
28.3. Features
28.3.1. Feature Matrix
The following features leverage Elasticsearch and are compatible with version 7.x.x.
| Name | Enabled by default | Feature |
|---|---|---|
Event and Alarm Forwarder |
no |
|
Flow Support |
yes |
|
Situation Feedback (ALEC) |
no |
|
Alarm History |
yes |
|
28.3.2. Event Forwarder
The Event Forwarder (formerly known as the Elasticsearch ReST plugin) forwards events to Elasticsearch.
The events in Elasticsearch can then be used for indexing, long time archival, plotting with Grafana and browsing with Kibana.
| This feature uses the Elasticsearch ReST interface and can interact with cloud-hosted Elasticsearch instances. |
| If you use Kibana, make sure you are using the version that is compatible with your version of Elasticsearch. |
Configuration
The configuration is held in ${OPENNMS_HOME}/etc/org.opennms.plugin.elasticsearch.rest.forwarder.cfg.
Please refer to section Configuring Elasticsearch in order to configure Elasticsearch connection settings.
Besides the general Elasticsearch connection settings, the following properties are supported to configure the Event Forwarder:
| Parameter | Default Value | Required | Description |
|---|---|---|---|
|
true |
optional |
Whether to forward the event description field to Elasticsearch. It can be disabled because it contains a long text field that can be redundant with the rest of the metadata included in the event. |
|
true |
optional |
If true The following attributes representing useful node asset fields from the node asset table are included in archived events and alarms. These are included only where the values are not null or empty strings in the table. (asset-latitude,asset-longitude,asset-region,asset-building,asset-floor,asset-room,asset-rack,asset-slot,asset-port,asset-category,asset-displaycategory,asset-notifycategory,asset-pollercategory,asset-thresholdcategory,asset-managedobjecttype,asset-managedobjectinstance,asset-manufacturer,asset-vendor,asset-modelnumber,parent-nodelabel,parent-nodeid,parent-foreignsource,parent-foreignid) |
|
false |
optional |
If |
|
false |
optional |
If changed to true, then archive all events even if they have not been persisted in the OpenNMS Horizon database. |
|
200 |
optional |
Increase this value to enable batch inserts into Elasticsearch. This is the maximum size of a batch of events that is sent to Elasticsearch in a single connection. |
|
500 |
optional |
The maximum time interval in milliseconds between batch events (recommended: 500ms) when a |
Once you are sure everything is correctly configured, you can activate the Event Forwarder by logging into the OSGi console and installing the feature: opennms-es-rest.
ssh admin@localhost -p 8101
feature:install opennms-es-restLoading Historical Events
It is possible to load historical OpenNMS Horizon events into Elasticsearch from the OpenNMS Horizon database using a karaf console command. The command uses the OpenNMS Horizon Events ReST interface to retrieve a set number of historical events and forward them to Elasticsearch. Because we are using the ReST interface it is also possible to contact a remote OpenNMS Horizon and download its events into Elasticsearch by using the correct remote URL and credentials.
The following example sends historic events to Elasticsearch using the karaf console:
# open karaf command prompt using # ssh -p 8101 admin@localhost karaf> opennms:send-events-to-elasticsearch --username admin --password admin --url http://localhost:8980 --limit 10 --offset 0
For more details, consolidate the --help option of the command.
|
Index Definition
The index names used to store the events uses the following form: opennms-raw-events-<index-strategy>/type/id
For example (assuming an index strategy of monthly):
opennms-events-raw-2017-01/eventdata/11549
Viewing events using Kibana Sense
Kibana Sense is a Kibana app which allows you to run queries directly against Elasticsearch. (https://www.elastic.co/guide/en/sense/current/installing.html)
If you install Kibana Sense you can use the following commands to view the events sent to Elasticsearch You should review the Elasticsearch ReST API documentation to understand how searches are specified. (See https://www.elastic.co/guide/en/elasticsearch/reference/current/search.html)
Example searches to use in Kibana Sense (you can copy the whole contents of this panel into Kibana Sense as a set of examples)
# Search all the events indexes GET /opennms-events-*/_search # Search all the raw events indexes GET /opennms-events-raw*/_search # Delete all the events indexes DELETE /opennms-events-*/ # Get all the raw events indexes GET /opennms-events-raw*/
Mapping of Events to Elasticsearch
Overview of index mapping
In OpenNMS Horizon, Event table entries contain references to associated node, asset, service and journal message tables. In Elasticsearch, we must flatten these entries into a single index entry for each insertion. Thus each index entry contains more context information than would be found in the actual OpenNMS Horizon event. This context information includes the associated node and asset table information which was current when (but may have changed since) the event was archived.
In the Table of Index Mappings below we have example event JSON entries retrieved using a sense command. The table helps illustrate how OpenNMS Horizon saves data in Elasticsearch.
Internal Elasticsearch fields always begin with an underscore character. The internal fields id, _index and _type are combined to give the unique identifier for an entry
as described above under Index Definitions. All of the fields under _source represent the stored event (_Elasticsearch documentation refers to source entries as indexed documents).
The ID of each event is included in the _source id field and also duplicated in the internal _id.
Events in the OpenNMS Horizon events table (i.e. those corresponding to logs or traps) are copied directly to the opennms-events-raw-
indexes. In OpenNMS Horizon events can contain parameters which are key-value pairs referencing additional data stored when the
event is created. In Elasticsearch these parameters are always stored in separate fields in the index with names beginning with p_
Events have severity fields defined as integers (long) and also corresponding severity_text fields which give the
text equivalent (Critical, Major, Minor, Normal, Cleared).
Table of Index Mapping
The following table describes the mapping of simple OpenNMS Horizon events to the Raw Events Index. Note that fields that begin with an underscore (_) are internal to Elasticsearch.
| Event Index Fields | Description | ||
|---|---|---|---|
Event Field |
Example Event JSON |
Type |
Description |
"_index": |
"_index": "opennms-raw-events-2017.03", |
string |
|
"_type": |
"_type": "eventdata", |
string |
|
"_id": |
"_id": "1110", |
string |
|
"_score": |
"_score": 1, |
long |
Internal Elasticsearch ranking of the search result. |
"_source": |
"_source": { |
string |
|
"@timestamp": |
"@timestamp": "2017-03-02T15:20:56.861Z", |
date |
event time from |
"dom": |
"dom": "2", |
long |
Day of month from |
"dow": |
"dow": "5", |
long |
Day of week from |
"hour": |
"hour": "15", |
long |
Hour of day from |
"eventdescr": |
"eventdescr": "<p>Alarm <a href=\"/opennms/alarm/detail.htm?id=30\">30</a> Cleared<p>…", |
string |
Event description. |
"eventseverity": |
"eventseverity": "3", |
long |
Event severity. |
"eventseverity_text": |
"eventseverity_text": "Normal", |
string |
Text representation of severity value. |
"eventsource": |
"eventsource": "AlarmChangeNotifier", |
string |
OpenNMS event source. |
"eventuei": |
"eventuei": "uei.opennms.org/plugin/AlarmChangeNotificationEvent/AlarmCleared", |
string |
OpenNMS universal event identifier (UEI) of the event. |
"id": |
"id": "1110", |
string |
Event ID. |
"interface": |
"interface": "127.0.0.1", |
string |
IP address of the event. |
"ipaddr": |
"ipaddr": "/127.0.0.1", |
string |
IP address of the event. |
"logmsg": |
"logmsg": "<p>Alarm <a href=\"/opennms/alarm/detail.htm?id=30\">30</a> Cleared<p>", |
string |
Log message of the event. |
"logmsgdest": |
"logmsgdest": "logndisplay", |
string |
Log Destination of the Event. |
"asset-category": |
"asset-category": "Power", |
string |
All |
"asset-building": |
"asset-building": "55", |
string |
|
"asset-room": |
"asset-room": "F201", |
string |
|
"asset-floor": |
"asset-floor": "Gnd", |
string |
|
"asset-rack": |
"asset-rack": "2101", |
string |
|
"categories": |
"categories": "", |
string |
|
"foreignid": |
"foreignid": "1488375237814", |
string |
Foreign ID of the node associated with the event. |
"foreignsource": |
"foreignsource": "LocalTest", |
string |
Foreign source of the node associated with event. |
"nodeid": |
"nodeid": "88", |
string |
Node ID of the node associated with the alarm or event. |
"nodelabel": |
"nodelabel": "localhost", |
string |
Node label of the node associated with the alarm or event. |
"nodesyslocation": |
"nodesyslocation": "Unknown (edit /etc/snmp/snmpd.conf)", |
string |
SNMP |
"nodesysname": |
"nodesysname": "localhost.localdomain", |
string |
SNMP |
"qosalarmstate": null, |
"qosalarmstate": |
||
28.3.3. Flow Support
| Flow Support is described in detail here. |
When persisting flows into Elasticsearch, every flow is represented by a single document.
The following table describes a subset of the fields in the flow document:
| Field | Description |
|---|---|
|
Timestamp in milliseconds at which the flow was sent by the exporter. |
|
Monitoring location at which the flow was received.
This will be |
|
Number of bytes transferred in the flow. |
|
Timestamp in milliseconds at which the last packet of the flow was transferred. |
|
|
|
Timestamp in milliseconds at which the first packet of the flow was transferred. |
|
SNMP interface index on which packets related to this flow were received. |
|
SNMP interface index on which packets related to this flow were forwarded. |
28.3.4. Situation Feedback
| Full documentation on Situation Feedback is available here. |
When persisting Situation Feedback, feedback on each related alarm is represented by a document as follows:
| Field | Description |
|---|---|
|
Timestamp in milliseconds when the feedback was submitted. |
|
The reduction key of the situation. |
|
The reduction key of the related alarm. |
|
One of |
|
A hash calculated on the situation when the feedback was submitted. |
|
A text string provided with the feedback. |
|
The user that submitted the feedback. |
28.3.5. Alarm History
See Alarm History.
29. Flow Support
29.1. Introduction
OpenNMS Horizon supports receiving, decoding and persisting flow information sent via Netflow v5, Netflow v9, IPFIX and sFlow. While flows offer a great breadth of information, the current focus of the support in OpenNMS Horizon is aimed at:
-
Network diagnostic: Being able to view the top protocols and top talkers within the context of a particular network interface.
-
Forensic analysis: Persisting the flows for long term storage.
29.1.1. How it works
At a high level:
-
telemetryd is used to receive and decode flows on both OpenNMS Horizon and Minion.
-
The telemetryd adapters convert the flows to a canonical flow model and dispatch these to the flow repository.
-
The flow repository enriches the flows and persists them to Elasticsearch:
-
Flows are tagged with an application name via the Classification Engine.
-
Metadata related to associated nodes such as ids and categories are also added to the flows.
-
-
The REST API supports generating both summaries and time series data from the flows stored in the flow repository.
-
OpenNMS Helm is used to visualize the flow data using the flow datasource that interfaces with the OpenNMS Horizon REST API.
29.2. Setup
Here we assume that you already have:
-
An Elasticsearch cluster setup with the elasticsearch-drift-plugin installed on every Elasticsearch node.
-
An instance of Grafana OpenNMS Helm v2.0.0 or greater installed.
29.2.1. Configuration Elasticsearch persistence
From a Karaf shell on your OpenNMS Horizon instance, start by configuring the flow persistence to use your Elasticsearch cluster:
$ ssh -p 8101 admin@localhost
...
admin@opennms()> config:edit org.opennms.features.flows.persistence.elastic
admin@opennms()> config:property-set elasticUrl http://elastic:9200
admin@opennms()> config:update
This configuration is stored in ${OPENNMS_HOME/etc/org.opennms.features.flows.persistence.elastic.cfg.
See General Elasticsearch Configuration for a complete set of options.
|
29.2.2. Enabling a protocol
Next, enable one or more of the protocols you would like to handle in ${OPENNMS_HOME}/etc/telemetryd-configuration.xml.
| In this example we enable the NetFlow v5 protocol, but the same process can be repeated for any of the other flow related protocols. |
<listener name="Netflow-5-UDP-8877" class-name="org.opennms.netmgt.telemetry.listeners.UdpListener" enabled="true">
<parameter key="port" value="8877"/>
<parser name="Netflow-5-Parser" class-name="org.opennms.netmgt.telemetry.protocols.netflow.parser.Netflow5UdpParser" queue="Netflow-5" />
</listener>
<queue name="Netflow-5">
<adapter name="Netflow-5-Adapter" class-name="org.opennms.netmgt.telemetry.protocols.netflow.adapter.netflow5.Netflow5Adapter" enabled="true">
</adapter>
</queue>Apply the changes without restarting by sending a reloadDaemonConfig event via the CLI:
${OPENNMS_HOME}bin/send-event.pl -p 'daemonName Telemetryd' uei.opennms.org/internal/reloadDaemonConfigThis will open a UDP socket bound to 0.0.0.0:8877 to which NetFlow v5 messages can be forwarded.
29.2.3. Linking to OpenNMS Helm in the Web UI
In order to access flow related graphs from the OpenNMS Horizon web interface, you must configure a link to your instance of OpenNMS Helm.
$ ssh -p 8101 admin@localhost ... admin@opennms()> config:edit org.opennms.netmgt.flows.rest admin@opennms()> config:property-set flowGraphUrl 'http://grafana:3000/dashboard/flows?node=$nodeId&interface=$ifIndex' admin@opennms()> config:update
This URL can optionally point to other tools as well.
It supports placeholders for $nodeId, $ifIndex, $start and $end.
|
Once configured, an icon will appear on the top right corner of a resource graph for an SNMP interface if there is flow data for that interface.
Configuring a listener on a Minion (Optional)
In this example we’ll look at enabling a generic listener for the NetFlow v5 protocol on Minion.
NetFlow v5 uses the generic UDP listener, but other protocols require a specific listener.
See the examples in ${OPENNMS_HOME}/etc/telemetryd-configuration.xml, or Telemetryd Listener Reference for details.
|
To enable and configure a Listener for NetFlow v5 on Minion, connect to the Karaf Console and set the following properties:
$ ssh -p 8201 admin@localhost
...
admin@minion()> config:edit --alias udp-8877 --factory org.opennms.features.telemetry.listeners
admin@minion()> config:property-set name Netflow-5
admin@minion()> config:property-set class-name org.opennms.netmgt.telemetry.listeners.UdpListener
admin@minion()> config:property-set parameters.port 8877
admin@minion()> config:property-set parsers.0.name Netflow-5-Parser
admin@minion()> config:property-set parsers.0.class-name org.opennms.netmgt.telemetry.protocols.netflow.parser.Netflow5UdpParser
admin@minion()> config:update
If a configuration management tool is used, the properties file can be created and is used as startup configuration in ${MINION_HOME}/etc/org.opennms.features.telemetry.listeners-udp-8877.cfg.
|
name = Netflow-5
class-name = org.opennms.netmgt.telemetry.listeners.UdpListener
parameters.port = 8877
parsers.0.name Netflow-5-Parser
parsers.0.class-name org.opennms.netmgt.telemetry.protocols.netflow.parser.Netflow5UdpParser
The associated protocol, in this case Netflow-5 must also be enabled on OpenNMS Horizon for the messages to be processed.
|
In some scenarios the exporters address is altered due to network address translation.
In this case you can use node meta-data to identify the exporter.
Use the metaDataNodeLookup parameter to specify a context-key pair in the form of context:key for the lookup.
This value used for the lookup corresponds to the following fields from the various protocols:
| Property | Description |
|---|---|
|
|
|
|
|
|
|
|
|
|
29.2.4. Node cache configuration (Optional)
By default each Flow Document is - if known by OpenNMS Horizon - enriched with node information. To reduce the number of queries to the database, the data is cached.
The following cache properties are available to be set in ${OPENNMS_HOME/etc/org.opennms.features.flows.persistence.elastic.cfg:
| Property | Description | Required | default |
|---|---|---|---|
|
The maximum size of the cache |
|
|
|
Number of seconds until an entry in the node cache is evicted. Set to 0 to disable eviction. |
|
|
|
Defines if cache statistics are exposed via JMX. Set to |
|
|
29.2.5. Classification Exporter Filter cache configuration (Optional)
A rule in the Classification Engine may define an exporterFilter.
In order to resolve if the filter criteria matches the address of an exporter a database query is executed.
A cache can be configured to cache the result to improve performance.
The following cache properties are available to be set in ${OPENNMS_HOME/etc/org.opennms.features.flows.classification.cfg:
| Property | Description | Required | default |
|---|---|---|---|
|
Enables or disables the cache. |
|
|
|
The maximum size of the cache |
|
|
|
Number of seconds until an entry in the node cache is evicted. Set to 0 to disable eviction. The timer is reset every time an entry is read. |
|
|
|
Defines if cache statistics are exposed via JMX. Set to |
|
|
29.2.6. Configure Kafka forwarder
Enriched flows (with OpenNMS Node data) can also be forwarded to kafka.
Enriched flows are stored in flowDocuments topic and the payloads are encoded using Google Protocol Buffers (GPB).
See flowdocument.proto in the corresponding source distribution for the model definitions.
Enable kafka forwarding:
$ ssh -p 8101 admin@localhost
...
admin@opennms()> config:edit org.opennms.features.flows.persistence.elastic
admin@opennms()> config:property-set enableForwarding true
admin@opennms()> config:updateConfigure Kafka server for flows:
$ ssh -p 8101 admin@localhost
...
admin@opennms()> config:edit org.opennms.features.flows.persistence.kafka
admin@opennms()> config:property-set bootstrap.servers 127.0.0.1:9092
admin@opennms()> config:update29.3. Classification Engine
The Classification Engine applies a set of user- and/or system-defined rules to each flow to classify it.
This allows users to group flows by applications, e.g. if all flows to port 80 are marked as http.
In order to classify a flow, a rule must be defined. A rule defines at least a name, which the flow is classified with, and additional parameters which must match for a successful classification.
29.3.1. Rule definition
A rule has the following fields:
| Name | Mandatory | Description |
|---|---|---|
|
|
The group in which this rule was placed, e.g. |
|
|
The position at which it is placed within its group, relevant for the Order of evaluation. |
|
|
The name the flow is classified with, e.g. |
|
|
The |
|
|
The |
|
|
The |
|
|
The |
|
|
The exporter of the flow must match this criteria. It supports all capabilities of the OpenNMS Horizon Filters API. |
|
|
The ip protocol of the flow must match this criteria. |
Even if all fields (besides group, position and name) are optional, at least one of them must be defined to be considered a valid rule.
A list of pre-defined rules already exist in the group pre-defined.
The pre-defined rules are inspired by the IANA Service Name and Transport Protocol Port Number Registry.
New rules can be defined using the Classification UI which can be found in the Admin Menu: Admin → Configure OpenNMS → Manage Flow Classification
29.3.2. Omnidirectional Rules
Rules can be marked as omnidirectional which additionally evaluates the rules with interchanged endpoint addresses and ports. This is helpful if traffic related to a matching classification should be classified the same way.
29.3.3. Rule Groups
Rules live within a rule group.
New groups can be added, edited and deleted via the Classification UI.
The pre-defined group is read only. It (and it’s rules) can not be altered.
29.3.4. Order of evaluation
Rules and groups have a position. Lower positions are evaluated first. The position of a rules group is more important than the rules position within its group. The system defined group is always evaluated last.
An example of an evaluation:
Group Position |
Group |
Rule Position |
Rule |
|
|
|
|
|
|
|
|
|
|
|
|
|
|
|
|
|
|
|
|
|
|
|
|
|
|
|
|
|
|
|
|
|
|
|
|
|
|
|
|
The positions of rules and groups can be changed by drag and drop or by editing the position field in the edit dialogs.
29.3.5. Verification
With a more complex set of rules it is not always easy to verify if everything is configured correctly. To make things a bit easier, the Classification UI allows to test/verify a classification. To do so, please navigate to the Classification UI: Admin → Configure OpenNMS → Manage Flow Classification and select the Test Classification action in the top right. This allows to simulate a flow being send to the Classification Engine with certain fields.
29.3.6. Example
Let’s assume the following rules are defined:
| name | srcAddress | srcPort | dstAddress | dstPort | protocol | exporterFilter |
|---|---|---|---|---|---|---|
|
10.0.0.1 |
8980 |
tcp,udp |
|||
|
80,8980,8080,9000 |
udp,tcp |
||||
|
443 |
|||||
|
categoryName == 'Exporters' |
The following flows are send to OpenNMS Horizon and with the rules defined above classified accordingly.
| Flow | Classification |
|---|---|
protocol: tcp, srcAddress: 10.0.0.5, srcPort: 60123, dstAddress: 54.246.188.65, dstPort: 80, exporterAddress: 10.0.0.55 |
|
protocol: tcp, srcAddress: 10.0.0.5, srcPort: 60123, dstAddress: 54.246.188.65, dstPort: 443, exporterAddress: 10.0.0.55 |
|
protocol: tcp, srcAddress: 10.0.0.5, srcPort: 60123, dstAddress: 10.0.0.1, dstPort: 8980, exporterAddress: 10.0.0.55 |
|
29.4. Aggregation
The flow query engine supports rendering Top-N metrics from pre-aggregated documents stored in Elasticsearch. These can be used to help alleviate compute load on the Elasticsearch cluster, particularly for environments with large volumes of flows (>10,000 flows/sec).
In order to use this functionality you must enable the Kafka forwarder as described in [ga-flow-support-kafka-forwarder] and setup Nephron to process the flows.
| Nephron currently requires an Apache Flink cluster to deploy the job. |
The following properties can bet set in ${OPENNMS_HOME/etc/org.opennms.features.flows.persistence.elastic.cfg to control the query engine to use aggregated flows:
| Property | Description | Required | default |
|---|---|---|---|
|
Set to |
|
|
|
Set to |
|
|
|
Queries with time range filters that have a duration greater than this value will use aggregated flows when possible. |
|
|
|
Queries with time range filters that have an endpoint that is older than this value will use aggregated flows when possible. |
|
|
30. Kafka Producer
30.1. Overview
The Kafka Producer feature allows events, alarms, nodes, topologies and metrics from OpenNMS Horizon to be forwarded to Kafka.
These objects are stored in different topics and the payloads are encoded using Google Protocol Buffers (GPB).
See opennms-kafka-producer.proto and collectionset.proto in the corresponding source distribution for the model definitions.
30.1.1. Events
The Kafka Producer listens for all events on the event bus and forwards these to a Kafka topic. The records are keyed by event Id and contain a GPB encoded model of the event.
By default, all events are forwarded to a topic named events.
The name of the topic used can be configured, and an optional filtering expression can be set to help control which events are sent to the topic.
30.1.2. Alarms
The Kafka Producer listens for changes made to the current set of alarms and forwards the resulting alarms to a Kafka topic. The records are keyed by alarm reduction key and contain a GPB encoded model of the alarm. When an alarm is deleted, a null value is sent with the corresponding reduction key. Publishing records in this fashion allows the topic to be used as a KTable. The Kafka Producer will also perform periodic synchronization tasks to ensure that the contents of the Kafka topic reflect the current state of alarms in the OpenNMS Horizon database.
By default, all alarms (and subsequent updates) are forwarded to a topic named alarms.
The name of the topic used can be configured, and an optional filtering expression can be set to help control which alarms are sent to the topic.
30.1.3. Nodes
If an event or alarm being forwarded reference a node, then the corresponding node is also forwarded. The records are keyed by "node criteria" (see bellow) and contain a GPB encoded model of the alarm. A caching mechanism is in place to help avoid forwarding nodes that have been successfully forwarded, and have not changed since.
The name of the topic used can be configured.
| The node topic is not intended to include all of the nodes in the system, it only includes records for nodes that relate to events or alarms that have been forwarded. |
Node Criteria
The node criteria is a string representation of the unique identifier for a given node. If the node is associated with a foreign source (fs) and foreign id (fid), the node criteria resulting node criteria will be the name of the foreign source, followed by a colon (:) and then the foreign id i.e. (fs:fid). If the node is not associated with both a foreign source and foreign id, then the node id (database id) will be used.
30.1.4. Topologies
The Kafka Producer listens for changes made to the current set of topologies (bridge, cdp, isis, lldp and ospf) and forwards the resulting messages to Kafka topics. A topic is defined either for Topology Vertex Update Message and another topic is defined for Topology Edge Update Message. The topologies are provided by the enhanced linkd updaters via the OnmsTopology API. An Updater send OnmsTopologyMessage to the subscribers. The records are keyed by GPB encoded key of protocol and TopologyRef and contain a GPB encoded model of the Vertex or Edge. When a Vertex or an Edge is deleted, a null value is sent with the corresponding encoded GBP key. Publishing records in this fashion allows the topic to be used as a KTable.
| The topologies topic are not intended to include all of the vertices in the system, it only includes records for vertex that relate to topology messages that have been forwarded. |
30.1.5. Metrics
The Kafka Producer can be used to write metrics to Kafka either exclusively, or in addition to an existing persistence strategy i.e. RRD or Newts. The metrics are written in the form of "collection sets" which correspond to the internal representation used by the existing collectors and persistence strategies. The records are keyed by Node ID or by IP Address if no Node ID is available and contain a GPB encoded version of the collection sets. The records are keyed in this fashion to help ensure that collection sets related to the same resources are written to the same partitions.
When enabled (this functionality is disabled by default), the metrics are written to a topic named metrics.
| When exclusively writing to Kafka, no metrics or resource graphs will be available on the OpenNMS Horizon instance. |
30.2. Enabling the Kafka Producer
The Kafka Producer is disabled by default and can be enabled as follows.
First, login to the Karaf shell of your OpenNMS Horizon instance and configure the Kafka client settings to point to your Kafka broker. See Producer Configs for a complete list of available options.
$ ssh -p 8101 admin@localhost
...
admin@opennms()> config:edit org.opennms.features.kafka.producer.client
admin@opennms()> config:property-set bootstrap.servers 127.0.0.1:9092
admin@opennms()> config:updateNext, install the opennms-kafka-producer feature from that same shell using:
admin@opennms()> feature:install opennms-kafka-producerIn order to ensure that the feature continues to be installed as subsequent restarts, add opennms-kafka-producer to the featuresBoot property in the ${OPENNMS_HOME}/etc/org.apache.karaf.features.cfg.
30.3. Configuring the Kafka Producer
The Kafka Producer exposes the following options to help fine tune its behavior.
| Name | Default Value | Description |
|---|---|---|
|
|
Name of the topic used for events. Set this to an empty string to disable forwarding events. |
|
|
Name of the topic used for alarms. Set this to an empty string to disable forwarding alarms. |
|
|
Name of the topic used for alarm feedback. Set this to an empty string to disable forwarding alarm feedback. |
|
|
Name of the topic used for nodes. Set this to an empty string to disable forwarding nodes. Set this to an empty string to disable forwarding topologies. |
|
|
Name of the topic used for topology vertices. |
|
|
Name of the topic used for topology edges. |
|
|
Name of the topic used for metrics. |
|
|
A Spring SpEL expression (see bellow) used to filter events. Set this to an empty string to disable filtering, and forward all events. |
|
|
A Spring SpEL expression (see bellow) used to filter alarms. Set this to an empty string to disable filtering, and forward all alarms. |
|
|
Set this value to |
|
|
Number of milliseconds to wait before looking up a node in the database again. Decrease this value to improve accuracy at the cost of additional database look ups. |
|
|
Number of milliseconds at which the contents of the alarm topic will be synchronized with the local database. Decrease this to improve accuracy at the cost of additional database look ups. Set this value to 0 to disable alarm synchronization. |
|
|
Suppresses forwarding alarms that differ only by count or last event time.
Set this to |
|
|
The capacity for the queue of Kafka messages that is used when a Kafka message is pushed but Kafka is unavailable. |
|
|
Set this to |
30.3.1. Configuring Filtering
Filtering can be used to selectively forward events and/or alarms to the Kafka topics.
Filtering is performed using a Spring SpEL expression which is evaluated against each object to determine if it should be forwarded.
The expression must return a boolean value i.e. true or false.
Enabling Event Filtering
To enable event filtering, set the value of the eventFilter property to a valid SpEL expression.
$ ssh -p 8101 admin@localhost
...
admin@opennms()> config:edit org.opennms.features.kafka.producer
admin@opennms()> config:property-set eventFilter 'getUei().equals("uei.opennms.org/internal/discovery/newSuspect")'
admin@opennms()> config:updateIn the example above, the filter is configured such that only events with the given UEI are forwarded.
Consult the source code of the org.opennms.netmgt.xml.event.OnmsEvent class in your distribution for a complete list of available properties.
Enabling Alarm Filtering
To enable alarm filtering, set the value of the alarmFilter property to a valid SpEL expression.
$ ssh -p 8101 admin@localhost
...
admin@opennms()> config:edit org.opennms.features.kafka.producer
admin@opennms()> config:property-set alarmFilter 'getTTicketId() != null'
admin@opennms()> config:updateIn the example above, the filter is configured such that only alarms that are associated with a ticket id are forwarded.
Consult the source code of the org.opennms.netmgt.model.OnmsAlarm class in your distribution for a complete list of available properties.
30.3.2. Enabling Metric Forwarding
To enable metric forward, set the value of the forward.metrics property to true.
$ ssh -p 8101 admin@localhost
...
admin@opennms()> config:edit org.opennms.features.kafka.producer
admin@opennms()> config:property-set forward.metrics true
admin@opennms()> config:updateEnabling Exclusive Metric Forwarding
Once metric forwarding is enabled, you can use this as the exclusive persistence strategy as follows by setting the following system property:
echo 'org.opennms.timeseries.strategy=osgi' > "$OPENNMS_HOME/etc/opennms.properties.d/kafka-for-metrics.properties"30.3.3. Configuring Topic Names
By default five topics are created i.e. events, alarms, nodes,vertices, and edges .
To change these, you can use:
$ ssh -p 8101 admin@localhost
...
admin@opennms()> config:edit org.opennms.features.kafka.producer
admin@opennms()> config:property-set eventTopic ""
admin@opennms()> config:property-set nodeTopic "opennms-nodes"
admin@opennms()> config:updateIn the example above, we disable event forwarding by setting an empty topic name and change the node topic name to opennms-nodes.
$ ssh -p 8101 admin@localhost
...
admin@opennms()> config:edit org.opennms.features.kafka.producer
admin@opennms()> config:property-set topologyVertexTopic "opennms-bridge-vertex"
admin@opennms()> config:property-set topologyEdgeTopic "opennms-edge-vertex"
admin@opennms()> config:updateIn the example above, we set the vertex and edge topics to be different to default.
30.4. Shell Commands
The Kafka Producer also provides a series of shell commands to help administering and debugging the service.
30.4.1. opennms:kafka-list-alarms
The list-alarms command can be used to enumerate the reduction keys and show the associated event labels for the alarms that are present in the topic.
This command leverages functionality used by the alarm synchronization process, and as a result this must be enabled in for this command to function.
$ ssh -p 8101 admin@localhost
...
admin@opennms> opennms:kafka-list-alarms
uei.opennms.org/alarms/trigger:n33:0.0.0.0:HTTPS_POOLs
Alarm: Generic Trigger30.4.2. kafka-producer:sync-alarms
The sync-alarms command can be used to manually trigger the alarm synchronization process.
$ ssh -p 8101 admin@localhost
...
admin@opennms> opennms:kafka-sync-alarms
Performing synchronization of alarms from the database with those in the ktable.
Executed 1 updates in 47ms.
Number of reduction keys in ktable: 4
Number of reduction keys in the db: 4 (4 alarms total)
Reduction keys added to the ktable: (None)
Reduction keys deleted from the ktable: (None)
Reduction keys updated in the ktable:
uei.opennms.org/nodes/nodeLostService::1:127.0.0.1:Minion-RPC30.4.3. opennms:kafka-evaluate-filter
The evaluate-filter command can be used to test arbitrary SpEL filtering expressions against alarms or events.
Evaluating filters against alarms
To test a filter against an alarm, specify the database id of the alarm and the expression to test:
admin@opennms> opennms:kafka-evaluate-filter --alarm-id 57 "getReductionKey().contains('n33')"
SPEL Expression: getReductionKey().contains('n33')
Alarm with ID 57 has reduction key: uei.opennms.org/alarms/trigger:n33:0.0.0.0:HTTPS_POOLs
Result: trueEvaluating filters against events
To test a filter against an event, specify the UEI of the event and the expression to test:
admin@opennms> opennms:kafka-evaluate-filter --event-uei uei.opennms.org/alarms/trigger "getUei().contains('alarm')"
SPEL Expression: getUei().contains('alarm')
Event has UEI: uei.opennms.org/alarms/trigger
Result: trueIn this case, a new event will be created with the given UEI, and the filter will be evaluated against this new event object. At this time, existing events cannot be referenced by this tool, so this functionality only serves to help make sure the expressions are syntactically valid.
31. Alarm Correlation
31.1. Situation Feedback
31.1.1. Introduction
Situation Feedback allows operators to provide real time feedback on Alarm Correlation.
31.1.2. Installation
Situation Feedback needs to be enabled by installing the feature from the Karaf shell:
feature:install opennms-situation-feedback
In order to ensure that the feature continues to be installed as subsequent restarts, add opennms-situation-feedback to the featuresBoot property in the ${OPENNMS_HOME}/etc/org.apache.karaf.features.cfg.
31.1.3. Requirements
The feature requires Elasticsearch to persist the feeback records.
Configuration Elasticsearch persistence
From a Karaf shell on your OpenNMS Horizon instance, start by configuring the Situation Feedback persistence to use your Elasticsearch cluster:
$ ssh -p 8101 admin@localhost
...
admin@opennms()> config:edit org.opennms.features.situation-feedback.persistence.elastic
admin@opennms()> config:property-set elasticUrl http://elastic:9200
admin@opennms()> config:update
This configuration is stored in ${OPENNMS_HOME/etc/org.opennms.features.situation-feedback.persistence.elastic.cfg.
See Elasticsearch Integration for more information.
|
Installing the feature exposes a ReST endpoint that OpenNMS Helm uses to display and submit feedback.
Further information on the ReST API can be found in the Developer Guide
32. Meta-Data
OpenNMS Horizon supports the assignment of arbitrary metadata to nodes, interfaces and services. You can then use this metadata to dynamically configure service monitoring, performance data collection, service detection, and expression-based thresholds.
The metadata is a simple triad of strings containing a context, a key and the associated value. Each node, each interface and each service can have an arbitrary number of metadata elements assigned to it. The only restriction is that the tuple of context and key must be unique in the element with which it is associated.
The association of metadata with nodes, interfaces and services happens during provisioning. Users can add, query, modify, or delete metadata through the requisition editor in the web UI, or through the ReST endpoints.
A simple domain-specific language (DSL) allows users to access the metadata associated with the elements they are working on, and use it as a variable in parameters and expressions. There is no limitation in defining metadata: users can decide how to define it and use it in expressions.
View metadata currently assigned to nodes, interfaces and services, on the details page associated with that entity in the web UI:

32.1. Contexts
A context distinguishes different kinds of metadata use. OpenNMS Horizon uses several default contexts: pattern (used with polling), requisition, node, interface, and service.
Three special contexts provide details about nodes, interfaces and services objects. Each context has keys associated with it that you can use in a metadata expression.
You can create user-defined contexts in the ReST API by prefixing the context name with X-.
Using an X- prefix can help to avoid future OpenNMS Horizon contexts interfering with a user-defined context, since OpenNMS Horizon contexts are not prefixed in this way.
32.1.1. Node context
The node context provides details about the node currently processed.
The following keys are available under this context:
| Context:Key | Description |
|---|---|
|
The node’s label |
|
The node’s foreign source name |
|
The node’s foreign ID |
|
The NetBIOS domain as provided by SNMP |
|
The NetBIOS name as provided by SNMP |
|
The node’s operating system |
|
The system name of the node |
|
The system location of the node |
|
The system contact specified for the node |
|
The system description of the node |
|
The node’s monitoring location name |
|
The node’s monitoring location area |
32.1.2. Interface context
The interface context provides details about the interface currently processed.
The following keys are available under this context:
| Context:Key | Description |
|---|---|
|
The hostname associated with the IP address of the interface |
|
The IP address of the interface |
|
The netmask of the interface |
|
The SNMP interface index |
|
The SNMP interface alias |
|
The SNMP interface description |
|
The physical address of the interface |
32.1.3. Service context
The service context provides details about the service currently processed.
The following key is available under this context:
| Context:Key | Description |
|---|---|
|
The full name of the service |
32.2. Adding Metadata through the Web UI
You can edit the requisition context in the web UI:
-
Under the admin menu, select Configure OpenNMS.
-
Select Manage Provisioning Requisitions.
-
Click the edit icon beside the requisition you want to work with.
-
Click edit beside the node you want to work with.
-
In the Meta-Data area, click Add Meta-Data.

-
Specify
nodeorinterfaceas the scope of where the metadata will apply. -
Specify the key and a value and click Save.
32.3. The Metadata DSL
The metadata DSL allows interpolation of metadata into a parameter.
The syntax allows the use of patterns like ${context:key|context_fallback:key_fallback|…|default} in an expression.
Each expression can contain multiple references to metadata that will be replaced with the corresponding value during evaluation.
Placeholders start with ${ and end with } containing a reference to a context-key pair.
You may choose to define multiple fallback context-key pairs and and an optional trailing default value.
Separate context and key by a :.
Use a | to separate optional fallback context-key pairs and default value.
If the first context:key item is not available (not on a service, interface, node or any other of the special contexts) the next one after the | is used.
The last one, the default value, is not interpreted as a context:key but is used as a literal and will always succeed.
Examples
${requisition:username}-
Will resolve to the
usernameas defined in the requisitioning UI or an empty value, if there is no such username defined.
A placeholder can contain an optional default value which is separated by a |.
${requisition:username|admin}-
Will resolve to the
usernameas defined in the requisitioning UI or to the valueadmin, if there is no such username defined.
Use fallback context-key pairs in a placeholder after the primary context-key pair to specify other values if the primary context-key pair is not defined.
Separate each fallback context-key-pair by a |.
${requisition:username|requisition:account|admin}-
Will resolve to the
usernameas defined in the requisitioning UI. If there is no such username defined, the fallbackaccountwill be used. If neither exist, the fallback valueadminwill be used.
To resolve the value associated with context-key pair, the DSL uses scopes that determine the resolution order. The last scope will be queried first and if a scope does not contain the queried context-key tuple, the next one will be queried. For example, the resolution of a query on a service entity would be service metadata→interface metatdata→node metadata. On an interface, it is metadata→interface metatdata→node metadata. On the node level, only the node is queried.
Which scopes are available depends on the environment for which an expression is evaluated and is documented in the corresponding places elsewhere in this guide. Some environments also provide additional scopes that are not backed by the persisted metadata but provide additional metadata related to the current evaluation.
32.3.1. Testing an expression
To test an expression, there is a karaf shell command which interpolates a string containing a pattern to the final result:
admin@opennms> opennms:metadata-test -n 1 -i 192.168.0.100 -s ICMP '${fruits:apple|fruits:banana|vegetables:tomato|blue}'
---
Meta-Data for node (id=1)
fruits:
apple='green'
banana='yellow'
vegetables:
tomato='red'
---
Meta-Data for interface (ipAddress=192.168.0.100):
fruits:
apple='brown'
---
Meta-Data for service (name=ICMP):
fruits:
apple='red'
---
Input: '${fruits:apple|fruits:banana|vegetables:tomato|blue}'
Output: 'red'
admin@opennms>32.3.2. Uses
The following places allow the use the Metadata DSL:
33. OpenNMS Horizon Administration
This section describes administrative tasks, such as shutdown and restart, you may need to perform with your OpenNMS Horizon instance.
This chapter provides an example of the order to follow when shutting down and restarting a sample OpenNMS Horizon system: OpenNMS Horizon core layer, persistence and messaging layer, and database layer.
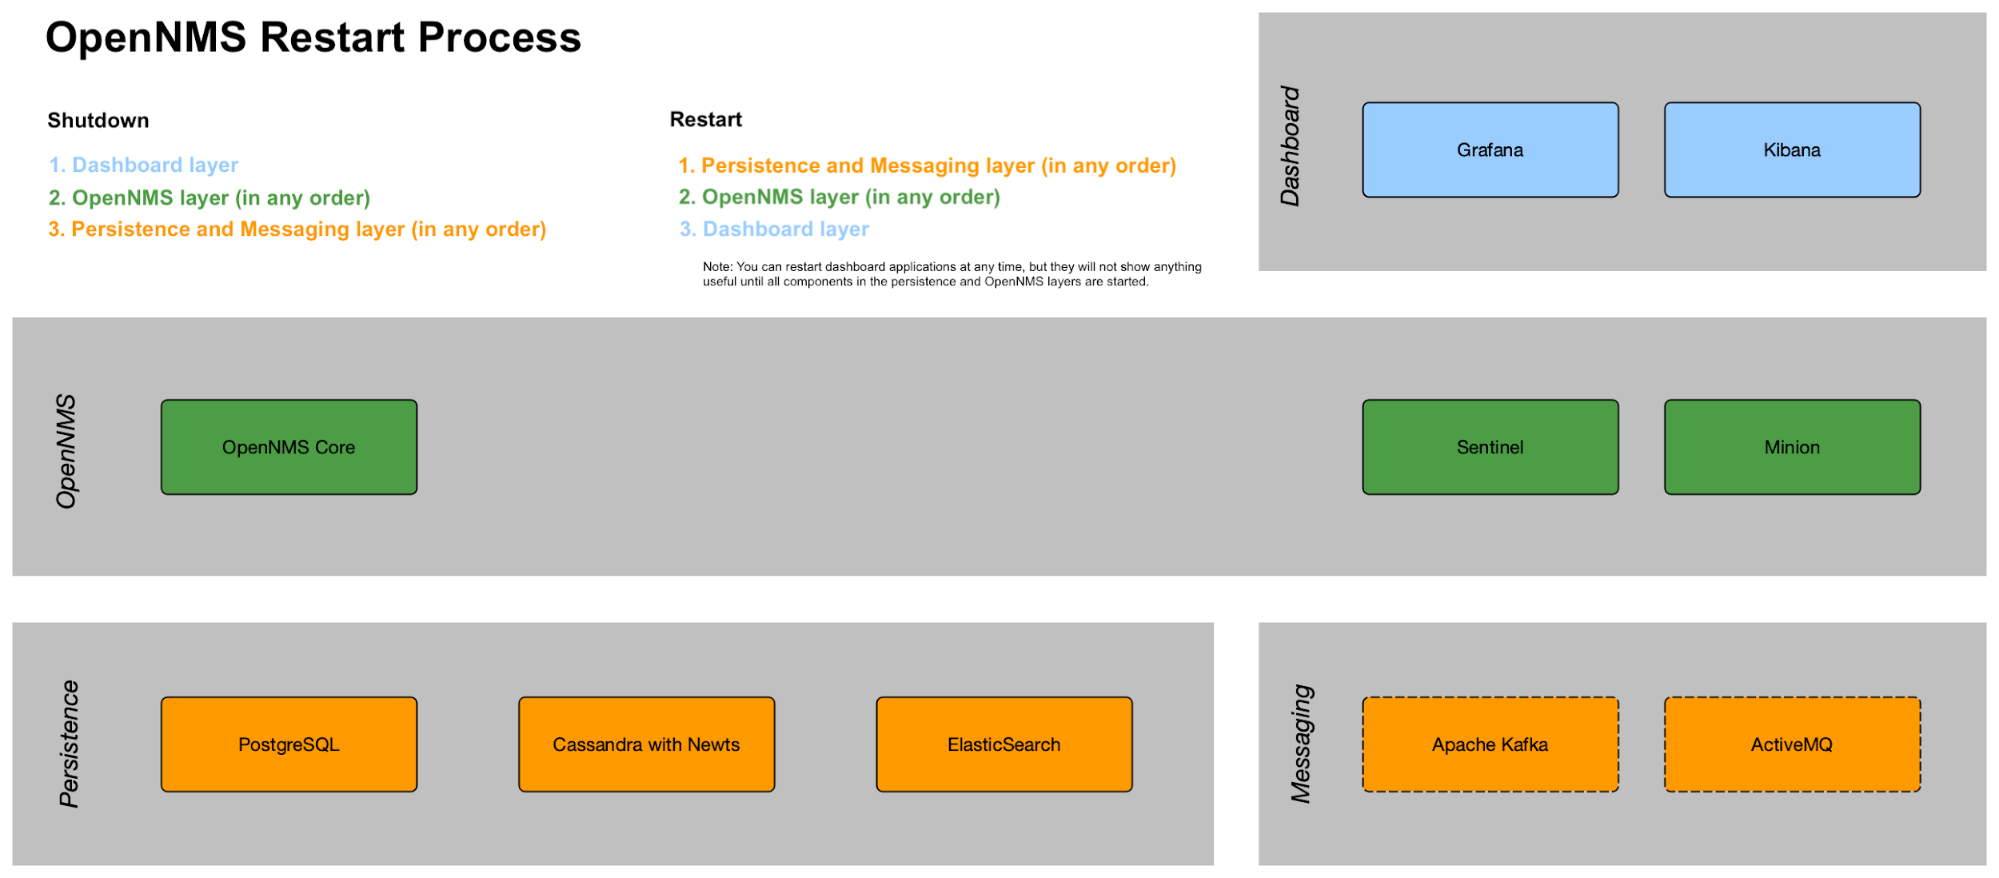
Note that restarting the whole stack is rare. Usually, restarting the OpenNMS Horizon core happens for reconfiguration or to run upgrades. A core restart takes between 2–5 minutes depending on memory configuration. Minion and Sentinel restart faster.
Keep in mind that when shutting down the OpenNMS Horizon core, there will be no notifications, alarms, outage detection, performance data collection, thresholding, or flows. After restarting there will be gaps in your performance graphs for the shutdown time.
Restarting components in the persistence and messaging layer normally happens only for upgrades or catastrophic failures. Exercise caution with restarting components in this layer, since there is the risk of data loss.
| The steps below are illustrative for a sample Linux setup. Your OpenNMS Horizon may be different. Documenting procedures for each setup is beyond the scope of this document. You must be root to run the commands listed below. |
33.1. Shutdown
Shutdown components in the following order:
-
Dashboard applications such as Grafana and Kibana.
systemctl stop grafana-server systemctl stop kibana -
OpenNMS Horizon Core application (Core, Sentinel, Minion), in any order.
-
Turn off notifications first.
-
Login to the OpenNMS Horizon UI.
-
In the top right corner choose User name→Configure OpenNMS:
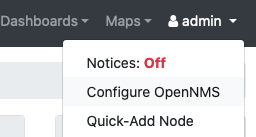
-
Under Event Management, turn off Notification Status and click Update.
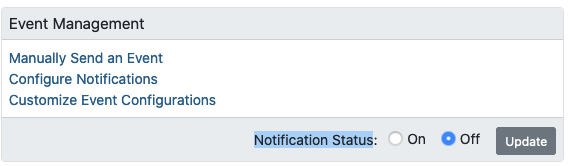
-
-
Access the OpenNMS Horizon system via CLI (putty, SecureCRT, etc.).
-
Become a root user via the following command:
sudo su - -
Type the following commands:
systemctl stop opennms systemctl stop minion systemctl stop sentinel -
-
Persistence and messaging components such as PostgreSQL, Cassandra, Kafka, etc., in any order:
systemctl stop postgresql-12
systemctl stop cassandra
systemctl stop elasticsearch| Neither Kafka nor Zookeeper have systemd definitions. The way to control the processes depends on how they were installed, and is beyond the scope of this documentation. |
33.2. Restart
Restart components in the following order:
-
Persistence and messaging components such as PostgreSQL, Cassandra, Kafka, etc., in any order:
systemctl start postgresql-12 systemctl start cassandra systemctl start elasticsearch -
OpenNMS Horizon Core application second, in any order.
systemctl start opennms systemctl start minion systemctl start sentinel-
In the UI, turn the Notification Status to On and click Update.
-
-
Dashboard applications like Grafana and Kibana last so they function properly.
systemctl start grafana-server
systemctl start kibana| You can restart dashboard applications at any time, but they will not show any useful information until all components in the persistence and OpenNMS Horizon layers have started. |